

Distinct skeletal muscle molecular responses to pulmonary rehabilitation in chronic obstructive pulmonary disease: a cluster analysis
- PMID: 30657653
- PMCID: PMC6463471
- DOI: 10.1002/jcsm.12370
Distinct skeletal muscle molecular responses to pulmonary rehabilitation in chronic obstructive pulmonary disease: a cluster analysis
Abstract
Background: Pulmonary rehabilitation (PR) is a cornerstone in the management of chronic obstructive pulmonary disease (COPD), targeting skeletal muscle to improve functional performance. However, there is substantial inter-individual variability in the effect of PR on functional performance, which cannot be fully accounted for by generic phenotypic factors. We performed an unbiased integrative analysis of the skeletal muscle molecular responses to PR in COPD patients and comprehensively characterized their baseline pulmonary and physical function, body composition, blood profile, comorbidities, and medication use.
Methods: Musculus vastus lateralis biopsies were obtained from 51 COPD patients (age 64 ± 1 years, sex 73% men, FEV1 , 34 (26-41) %pred.) before and after 4 weeks high-intensity supervised in-patient PR. Muscle molecular markers were grouped by network-constrained clustering, and their relative changes in expression values-assessed by qPCR and western blot-were reduced to process scores by principal component analysis. Patients were subsequently clustered based on these process scores. Pre-PR and post-PR functional performance was assessed by incremental cycle ergometry and 6 min walking test (6MWT).
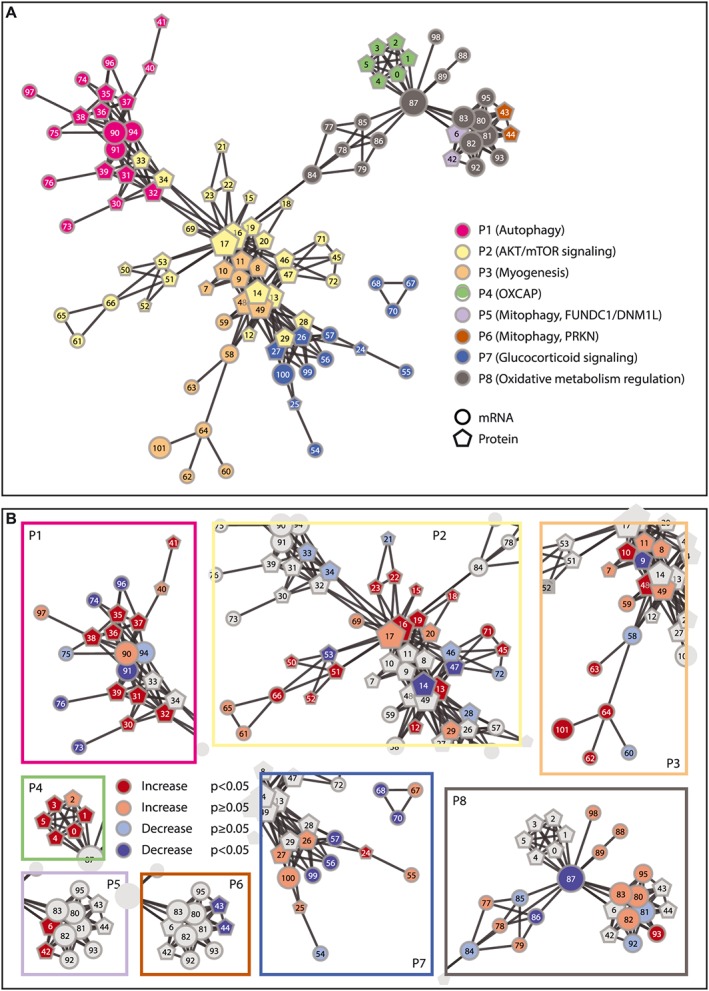
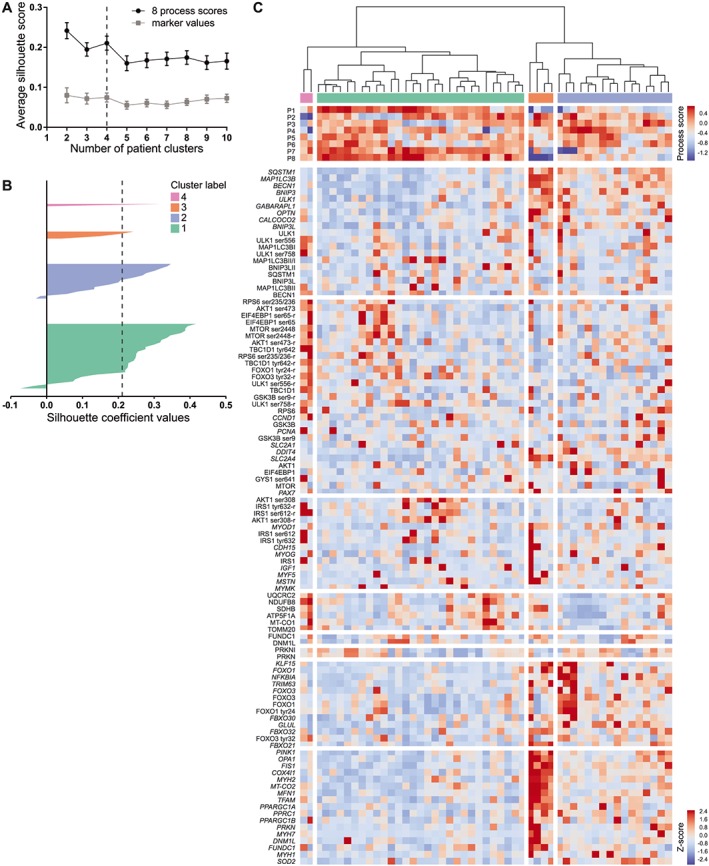
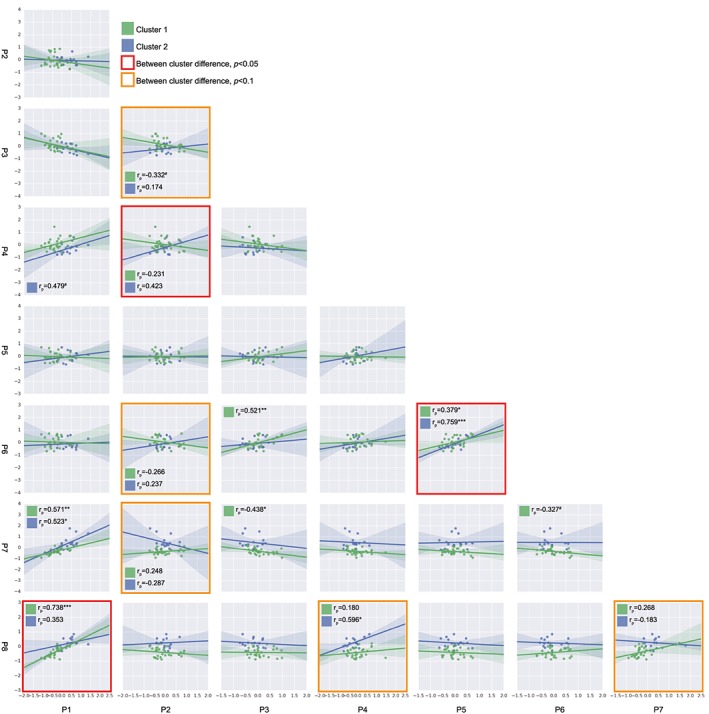
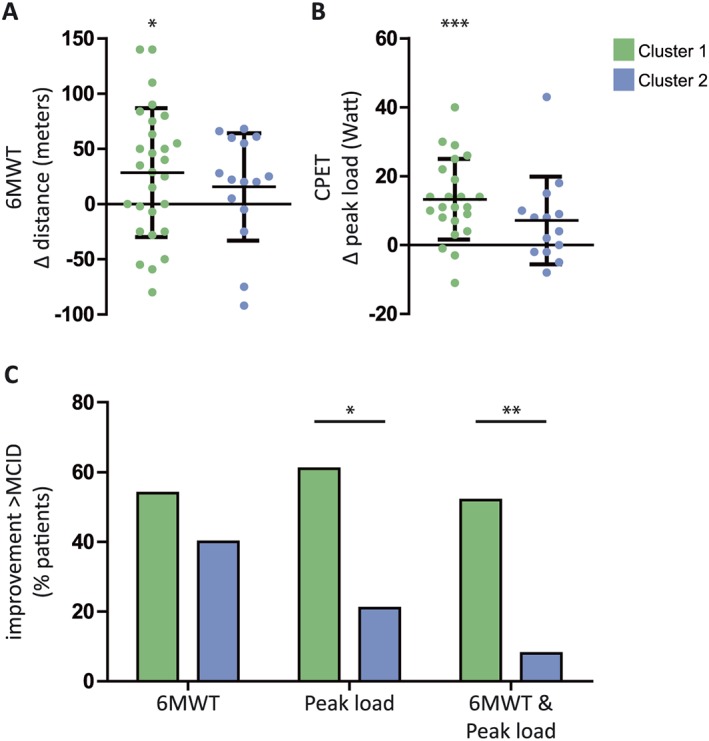
Results: Eight molecular processes were discerned by network-constrained hierarchical clustering of the skeletal muscle molecular rehabilitation responses. Based on the resulting process scores, four clusters of patients were identified by hierarchical cluster analysis. Two major patient clusters differed in PR-induced autophagy (P < 0.001), myogenesis (P = 0.014), glucocorticoid signalling (P < 0.001), and oxidative metabolism regulation (P < 0.001), with Cluster 1 (C1; n = 29) overall displaying a more pronounced change in marker expression than Cluster 2 (C2; n = 16). General baseline characteristics did not differ between clusters. Following PR, both 6 min walking distance (+26.5 ± 8.3 m, P = 0.003) and peak load on the cycle ergometer test (+9.7 ± 1.9 W, P < 0.001) were improved. However, the functional improvement was more pronounced in C1, as a higher percentage of patients exceeded the minimal clinically important difference in peak workload (61 vs. 21%, P = 0.022) and both peak workload and 6 min walking test (52 vs. 8%, P = 0.008) upon PR.
Conclusions: We identified patient groups with distinct skeletal muscle molecular responses to rehabilitation, associated with differences in functional improvements upon PR.
Keywords: Chronic obstructive pulmonary disease; Cluster analysis; Exercise training; Muscle plasticity; Peripheral muscle dysfunction.
© 2019 The Authors. Journal of Cachexia, Sarcopenia and Muscle published by John Wiley & Sons Ltd on behalf of the Society on Sarcopenia, Cachexia and Wasting Disorders.
Conflict of interest statement
The authors declare that they have no conflict of interest.
Figures
Similar articles
-
Different Training-Induced Skeletal Muscle Adaptations in COPD Patients with and without Alpha-1 Antitrypsin Deficiency.Respiration. 2016;92(5):339-347. doi: 10.1159/000449509. Epub 2016 Sep 30. Respiration. 2016. PMID: 27686000
-
Exercise performance and differences in physiological response to pulmonary rehabilitation in severe chronic obstructive pulmonary disease with hyperinflation.J Bras Pneumol. 2016 Apr;42(2):121-9. doi: 10.1590/S1806-37562015000000078. J Bras Pneumol. 2016. PMID: 27167433 Free PMC article.
-
The Influence of Body Composition on Pulmonary Rehabilitation Outcomes in Chronic Obstructive Pulmonary Disease Patients.Lung. 2017 Dec;195(6):729-738. doi: 10.1007/s00408-017-0053-y. Epub 2017 Oct 9. Lung. 2017. PMID: 28993936
-
[Advances in pathogenic mechanisms and pulmonary rehabilitation strategies for skeletal muscle dysfunction in chronic obstructive pulmonary disease].Zhonghua Jie He He Hu Xi Za Zhi. 2024 Dec 12;47(12):1163-1169. doi: 10.3760/cma.j.cn112147-20240624-00358. Zhonghua Jie He He Hu Xi Za Zhi. 2024. PMID: 39653540 Review. Chinese.
-
Effect of pulmonary rehabilitation programs including lower limb endurance training on dyspnea in stable COPD: A systematic review and meta-analysis.Respir Investig. 2020 Sep;58(5):355-366. doi: 10.1016/j.resinv.2020.05.010. Epub 2020 Jul 11. Respir Investig. 2020. PMID: 32660900
Cited by
-
The Impact of Exercise Training and Supplemental Oxygen on Peripheral Muscles in Chronic Obstructive Pulmonary Disease: A Randomized Controlled Trial.Med Sci Sports Exerc. 2023 Dec 1;55(12):2123-2131. doi: 10.1249/MSS.0000000000003268. Epub 2023 Aug 2. Med Sci Sports Exerc. 2023. PMID: 37535316 Free PMC article. Clinical Trial.
-
Hypercapnic Respiratory Failure-Driven Skeletal Muscle Dysfunction: It Is Time for Animal Model-Based Mechanistic Research.Adv Exp Med Biol. 2021;1303:129-138. doi: 10.1007/978-3-030-63046-1_8. Adv Exp Med Biol. 2021. PMID: 33788191 Free PMC article. Review.
-
Relationship between pulmonary function and physical performance among community-living people: results from Look-up 7+ study.J Cachexia Sarcopenia Muscle. 2020 Feb;11(1):38-45. doi: 10.1002/jcsm.12485. Epub 2019 Dec 4. J Cachexia Sarcopenia Muscle. 2020. PMID: 31800168 Free PMC article.
-
Genetic variation in genes regulating skeletal muscle regeneration and tissue remodelling associated with weight loss in chronic obstructive pulmonary disease.J Cachexia Sarcopenia Muscle. 2021 Dec;12(6):1803-1817. doi: 10.1002/jcsm.12782. Epub 2021 Sep 15. J Cachexia Sarcopenia Muscle. 2021. PMID: 34523824 Free PMC article.
-
Update on the Etiology, Assessment, and Management of COPD Cachexia: Considerations for the Clinician.Int J Chron Obstruct Pulmon Dis. 2022 Nov 18;17:2957-2976. doi: 10.2147/COPD.S334228. eCollection 2022. Int J Chron Obstruct Pulmon Dis. 2022. PMID: 36425061 Free PMC article. Review.
References
-
- Barnes PJ, Celli BR. Systemic manifestations and comorbidities of COPD. Eur Respir J 2009;33:1165–1185. - PubMed
-
- Mostert R, Goris A, Weling‐Scheepers C, Wouters EF, Schols AM. Tissue depletion and health related quality of life in patients with chronic obstructive pulmonary disease. Respir Med 2000;94:859–867. - PubMed
-
- Marquis K, Debigare R, Lacasse Y, LeBlanc P, Jobin J, Carrier G, et al. Midthigh muscle cross‐sectional area is a better predictor of mortality than body mass index in patients with chronic obstructive pulmonary disease. Am J Respir Crit Care Med 2002;166:809–813. - PubMed
-
- Schols AM, Broekhuizen R, Weling‐Scheepers CA, Wouters EF. Body composition and mortality in chronic obstructive pulmonary disease. Am J Clin Nutr 2005;82:53–59. - PubMed
MeSH terms
LinkOut - more resources
Full Text Sources
Medical
Research Materials
Miscellaneous
