. 2019 Feb 19;53(4):1893-1904.
doi: 10.1021/acs.est.8b05386. Epub 2019 Feb 4.

Effective Fungal Spore Inactivation with an Environmentally Friendly Approach Based on Atmospheric Pressure Air Plasma

Affiliations

Effective Fungal Spore Inactivation with an Environmentally Friendly Approach Based on Atmospheric Pressure Air Plasma

Nataša Hojnik et al. Environ Sci Technol. .

Abstract

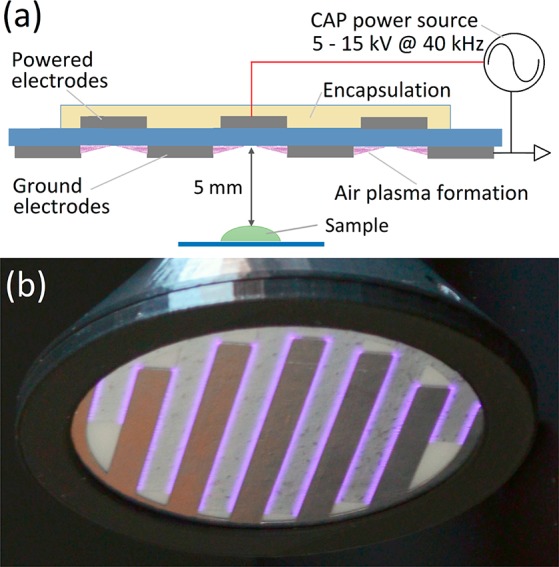
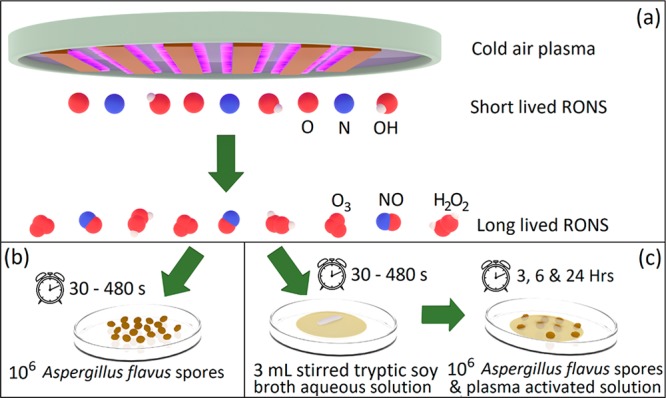
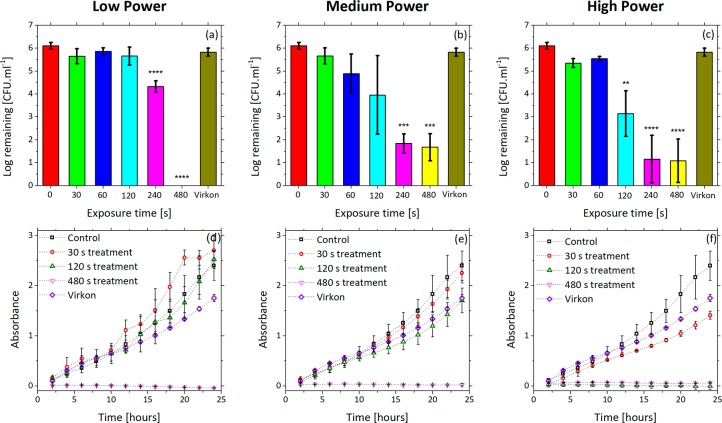
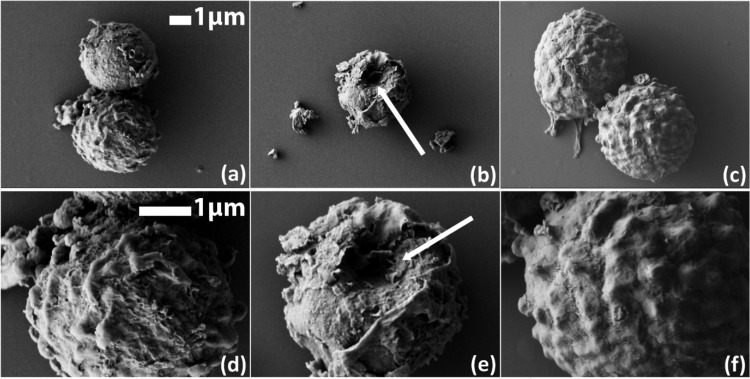
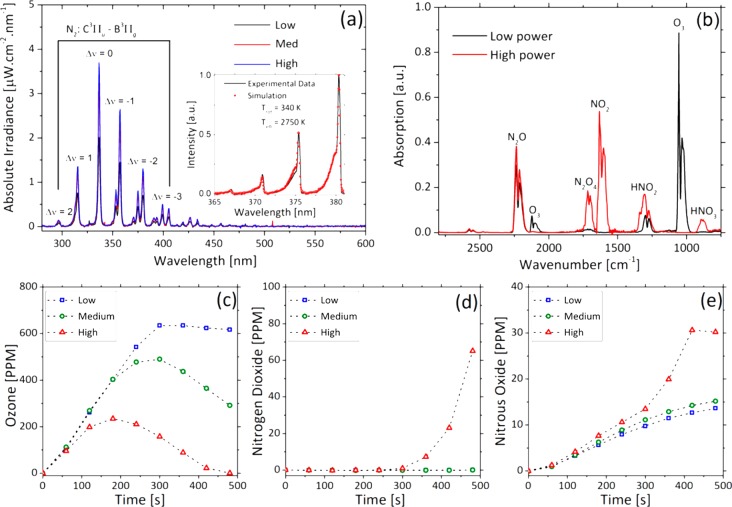
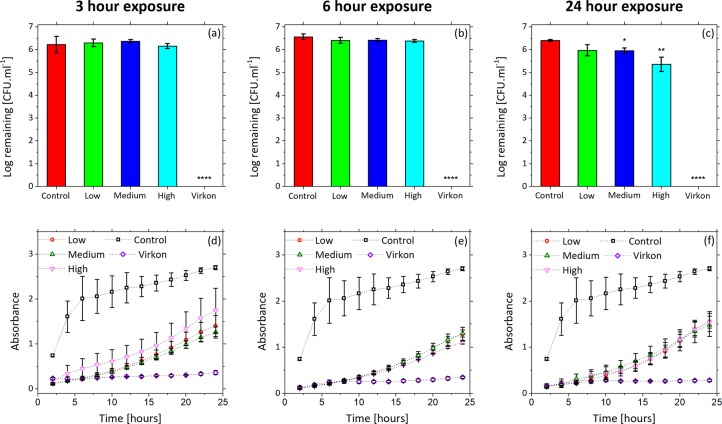
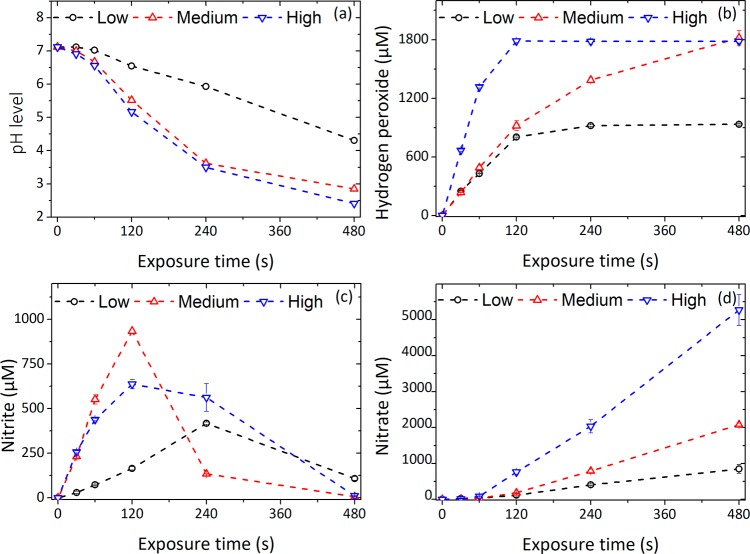
Fungal contamination of surfaces is a global burden, posing a major environmental and public health challenge. A wide variety of antifungal chemical agents are available; however, the side effects of the use of these disinfectants often result in the generation of toxic residues raising major environmental concerns. Herein, atmospheric pressure air plasma generated by a surface barrier discharge (SBD) is presented as an innovative green chemical method for fungal inactivation, with the potential to become an effective replacement for conventional chemical disinfection agents, such as Virkon. Using Aspergillus flavus spores as a target organism, a comparison of plasma based decontamination techniques is reported, highlighting their respective efficiencies and uncovering their underpining inactivation pathways. Tests were performed using both direct gaseous plasma treatment and an indirect treatment using a plasma activated aqueous broth solution (PAB). Concentrations of gaseous ozone and nitrogen oxides were determined with Fourier-transform infrared spectroscopy (FTIR) and Optical emission spectroscopy (OES), whereas hydrogen peroxides, nitrites, nitrates, and pH were measured in PAB. It is demonstrated that direct exposure to the gaseous plasma effluent exhibited superior decontamination efficiency and eliminated spores more effectively than Virkon, a finding attributed to the production of a wide variety of reactive oxygen and nitrogen species within the plasma.


Conflict of interest statement

The authors declare no competing financial interest.

Figures

Figure 1
Figure 1
(a) Schematic of air SBD plasma system used for fungal spore inactivation; (b) photograph of CAP system operating under high-power conditions.
Figure 2
Figure 2
Diagrammatic representation of CAP treatment methodologies: (a) CAP system and the key short- and long-lived plasma generated RONS; (b) direct CAP treatment of A. flavus spores; (c) CAP treatment of aqueous tryptic soy broth solution and subsequent exposure of A. flavus spores to plasma activated broth solution (PAB).
Figure 3
Figure 3
CAP effluent treatment of A. flavus spores: (a), (b), and (c) log numbers of new grown spore units after low, medium, and high power plasma treatment with a comparison provided against a 1% Virkon solution. The initial concentration of spores for (a), (b), and (c) was 1.3 × 10⁶ CFU/mlL. An one way ANOVA was performed between treated samples and control samples (0 s). P-values −0,0332 (*); 0,0021 (**); 0,0002 (***); < 0,0001 (****); (d), (e), (f) metabolic activity of spores exposed to low, medium and high power plasma and a 1% Virkon solution comparison.
Figure 4
Figure 4
Characteristic scanning electron microscopy images of A. flavus spores after exposures to the direct CAP treatment and a 1% Virkon solution under 10 000× magnification ((a), (b), (c)) and 25 000× magnification ((d), (e), (f)): (a) and (b) untreated sample (control); (b) and (e) sample treated with CAP at high power for 120 s with marked plasma produced spore morphology damage; (c) and (f) sample treated with 1% Virkon for 480 s.
Figure 5
Figure 5
Gas chemical composition of plasma gas phase produced by air SBD operated at low, medium and high dissipated power; (a) OES and vibrational and rotational temperature of electrons; (b) FTIR spectra of long-lived species; (c) ozone content; (d) nitrogen dioxide content; (e) nitrous oxide content.
Figure 6
Figure 6
Exposure of A. flavus spores to plasma activated broth (PAB) generated under low, medium and high power conditions for 480 s with a comparison provided against a 1% Virkon solution: (a), (b), (c) log numbers of new grown spore units after exposure to PAB and Virkon for 3, 6, and 24 h. The initial concentration of spores for (a), (b), and (c) was 2.1 × 10⁶, 3.8 × 10⁶ and 2.5 × 10⁶ CFU/mL, respectively. An one way ANOVA was performed comparing results of treated samples to control (0 s). P-values −0,0332 (*); 0,0021 (**); 0,0002 (***); < 0,0001 (****); (d), (e), (f) metabolic activity of spores exposed to PAB and Virkon for 3, 6, and 24 h.
Figure 7
Figure 7
Characteristic scanning electron microscopy images of A. flavus spores after a 6 h exposure to PAB and a 1% Virkon solution under 5000 x magnification ((a)-(c)) and 25 000× magnification ((d)–(f)): (a) and (c) sample incubated in untreated aqueous TSB broth solution (control) with marked mycelia; (b) and (e) sample treated with PAB; (c) and (f) sample treated with 1% Virkon solution.
Figure 8
Figure 8
Liquid phase chemistry of PAB. Created using CAP under low, medium and high dissipated powers. A two way ANOVA was performed comparing results of treated samples to control (0 s); (a) pH values of PAB; (b) concentration of hydrogen peroxide. All treated samples were significantly different compared to control (P ≤ 0,001); (c) concentration of nitrite. All treated samples were significantly different (P ≤ 0,001) with exceptions of those treated for 30 s with low power plasma and 480 s with medium and high power plasma; (d) concentration of nitrate. Significant differences (P ≤ 0,001) occurred after 240 s of exposure to low and medium power plasma, and after 120 s of exposure to high power plasma.
Figure 9
Figure 9
Schematic of main reactions during the CAP treatment of liquid.

Similar articles

Cited by

References

    1. Tamang J. P.; Watanabe K.; Holzapfel W. H. Review: Diversity of Microorganisms in Global Fermented Foods and Beverages. Front. Microbiol. 2016, 7, 377.10.3389/fmicb.2016.00377. - DOI - PMC - PubMed
    1. Nelson J. H. Production of blue cheese flavor via submerged fermentation by Penicillium roqueforti. J. Agric. Food Chem. 1970, 18 (4), 567–569. 10.1021/jf60170a024. - DOI
    1. Demain A. L.; Martens E. Production of valuable compounds by molds and yeasts. J. Antibiot. 2017, 70, 347.10.1038/ja.2016.121. - DOI - PMC - PubMed
    1. Portnoy J. M.; Jara D. Mold allergy revisited. Ann. Allergy, Asthma, Immunol. 2015, 114 (2), 83–89. 10.1016/j.anai.2014.10.004. - DOI - PubMed
    1. Marin S.; Ramos A. J.; Cano-Sancho G.; Sanchis V. Mycotoxins: Occurrence, toxicology, and exposure assessment. Food Chem. Toxicol. 2013, 60, 218–237. 10.1016/j.fct.2013.07.047. - DOI - PubMed

Publication types