. 2019 Apr 23;47(7):3450-3466.
doi: 10.1093/nar/gkz014.

Splicing events in the control of genome integrity: role of SLU7 and truncated SRSF3 proteins

Affiliations

Splicing events in the control of genome integrity: role of SLU7 and truncated SRSF3 proteins

Maddalen Jiménez et al. Nucleic Acids Res. .

Abstract

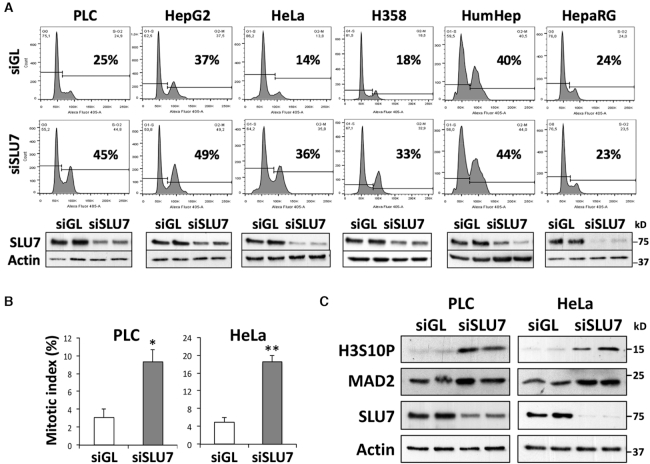
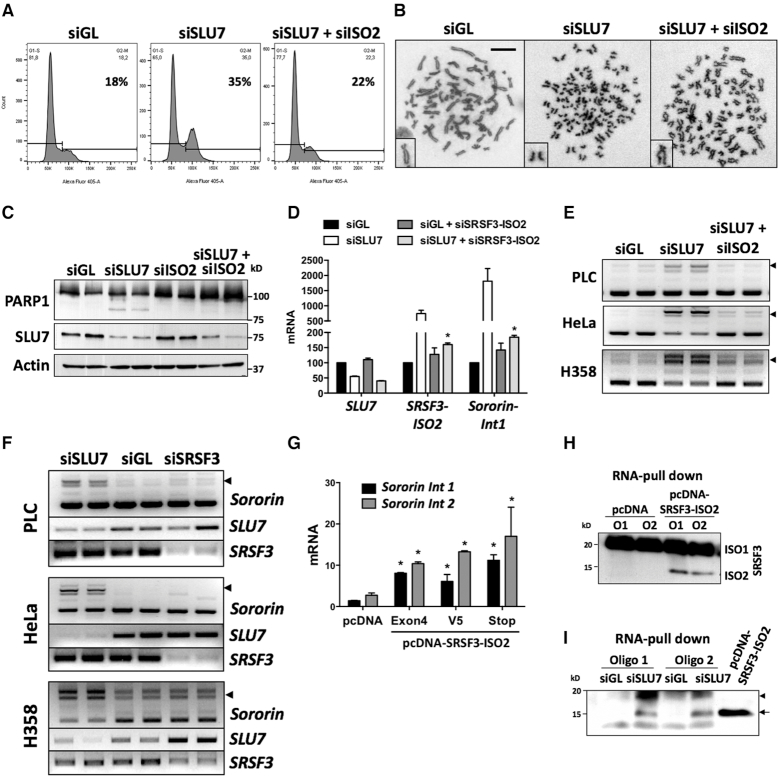
Genome instability is related to disease development and carcinogenesis. DNA lesions are caused by genotoxic compounds but also by the dysregulation of fundamental processes like transcription, DNA replication and mitosis. Recent evidence indicates that impaired expression of RNA-binding proteins results in mitotic aberrations and the formation of transcription-associated RNA-DNA hybrids (R-loops), events strongly associated with DNA injury. We identify the splicing regulator SLU7 as a key mediator of genome stability. SLU7 knockdown results in R-loops formation, DNA damage, cell-cycle arrest and severe mitotic derangements with loss of sister chromatid cohesion (SCC). We define a molecular pathway through which SLU7 keeps in check the generation of truncated forms of the splicing factor SRSF3 (SRp20) (SRSF3-TR). Behaving as dominant negative, or by gain-of-function, SRSF3-TR impair the correct splicing and expression of the splicing regulator SRSF1 (ASF/SF2) and the crucial SCC protein sororin. This unique function of SLU7 was found in cancer cells of different tissue origin and also in the normal mouse liver, demonstrating a conserved and fundamental role of SLU7 in the preservation of genome integrity. Therefore, the dowregulation of SLU7 and the alterations of this pathway that we observe in the cirrhotic liver could be involved in the process of hepatocarcinogenesis.


Figures

Figure 1.
Figure 1.
SLU7 is required for mitosis progression in transformed cells. (A) SLU7 knockdown induces cell-cycle arrest at G2/M in asynchronous transformed cells. Progression through the cell cycle was analyzed by FACS 48 h after transfection with siSLU7 or control siGL in asynchronous human hepatoma cells (PLC/PRF/5 and HepG2), the transformed cell lines HeLa (cervical carcinoma) and H358 (lung cancer), normal human hepatocytes (HumHep) and the well-differentiated human hepatoma cell line HepaRG. The percentage of cells in G2/M phase is indicated. Western blot analysis confirms SLU7 knockdown. Actin was used as loading control. At least two independent experiments of FACS analysis were performed for each cell line. (B) The mitotic index was calculated in asynchronous PLC/PRF/5 and HeLa cells 48 h after transfection with siSLU7 and control siGL by measuring the presence of condensed chromosomes stained with 4′,6-diamidino-2-phenylindole (DAPI). More than 250 cells per condition coming from five independent experiments performed in duplicates were counted. *P < 0.05, **P < 0.01. (C) Western blot analysis of the mitotic marker Ser-10 phosphorylated histone H3 (H3S10P) and the mitotic arrest deficient 2 (MAD2) protein, in PLC/PRF/5 and HeLa cells 48 h after transfection with siSLU7 and control siGL.
Figure 2.
Figure 2.
SLU7 is required for proper spindle assembly and SCC. (A) Metaphases were analyzed by immunofluorescence in PLC/PRF/5 cells 48 h after transfection with control siGL and 2 h after release of overnight treatment with nocodazole. Immunodetection of SLU7 expression and localization is shown in green, the mitotic spindle was visualized with anti-α-Tubulin (TUBA) antibody (red) and DNA was stained with DAPI (blue). Scale bar: 10 μm. (B) Cells transfected with siSLU7 were treated as in A. Cells with normal levels of SLU7 presented their chromosomes aligned in the metaphase plate and normal spindles as control siGL cells. Cells with reduced SLU7 levels (↓SLU7) showed abnormal (monopolar or multipolar) spindle morphology. Scale bar: 10 μm. (C) Representative images of metaphase chromosome spreads from PLC/PRF/5, HeLa and H358 cells 48 h after transfection with siGL or siSLU7. Scale bar: 10 μm. (D) Schematic representation of the genomic locus of human CDCA5 (sororin) gene and the transcripts generated after the correct splicing or the aberrant retention of introns 1 and 2. The location of primers used for PCR1, PCR2 and PCR3 is indicated. (E) Real time quantification of the incorporation of intron 1 (PCR1) and intron 2 (PCR2) into sororin mRNA in PLC/PRF/5 cells 48 h after transfection with two different SLU7-specific siRNAs. *P < 0.05, **P < 0.01. (F) Analysis of sororin transcripts using PCR3 as described in D, in PLC/PRF/5, HeLa and H358 cells 48 h after transfection with siSLU7. Arrows indicate the aberrant intron-incorporating isoforms. (G) Western blot of sororin and SLU7 in PLC/PRF/5 and HeLa cells 48 h after transfection with siSLU7. Actin expression is shown as loading control. All experiments were performed at least three times with biological duplicates per condition.
Figure 3.
Figure 3.
SLU7 protects from R-loop formation and DNA damage induction. (A) PLC/PRF/5 cells were probed for R-loops using the S9.6 antibody 48 h after siSLU7 transfection. Cells were transfected with a RNase H1 (RNH1) expressing plasmid to resolve R-loops as control. Nuclei were stained with DAPI. Scale bar: 10 μm. The right panel shows the quantification of RNA–DNA hybrids (R-loops) per nucleus with ImageJ software. The DAPI signal was used to create a mask of the nucleus. The nuclear S9.6 signal intensity was then determined. The number of nucleus analyzed per condition is indicated. The plot was represented using GraphPad Prism. Red bars represent the median. ****P < 0.0001 (Mann–Whitney U-test). (B) Slot-blot analysis of R-loops using S9.6 antibody in genomic DNA from PLC/PRF/5 cells 48 h after transfection with siGL or siSLU7. Right panels show the same analysis using genomic DNA after treatment with RNAse H1 as control (+RNH1). DNA was stained with methylene blue to show equal loading. (C) Western blot analysis of γ-H2AX and SLU7 in PLC/PRF/5 cells 48 h after transfection with siGL or siSLU7, and a control plasmid (pcDNA3) or a plasmid expressing RNase H1 (RNH1). Actin expression is shown as loading control. All experiments were performed at least three times with biological duplicates per condition.
Figure 4.
Figure 4.
SLU7 controls SRSF1 and SRSF3 pre-mRNAs splicing and prevents the induction of SRSF3-TR forms. (A) Schematic representation of SRSF1 and SRSF3 genes and the different mRNAs generated by alternative splicing. The location of primers used for PCRs are indicated. (B) PCR detection of SRSF3 and SRSF1 isoforms 48 h after transfection with siGL or siSLU7 in the indicated cell lines. The aberrant isoforms are indicated by arrowheads. (C) Western blot analysis of SRSF1, SRSF3 (antibody from MBL), γ-H2AX and SLU7 in PLC/PRF/5, HeLa and H358 cells 48 h after transfection with siGL and siSLU7. Actin was used as loading control. (D) Western blot analysis of truncated SRSF3 forms (antibody from Thermo) in H358 cells 48 h after transfection with siGL, siSLU7 or siSLU7+siISO2. Western blot analysis of SLU7 and Actin protein levels as loading control are shown. Upper right panels show different exposures of the same membrane probed with anti-SRSF3 antibody to better identify the truncated SRSF3 forms. Lower right panels show the RT-PCR analysis of SRSF3-ISO2 and SLU7 mRNAs. All experiments were performed at least three times with biological duplicates per condition.
Figure 5.
Figure 5.
SRSF3-TR forms induced upon SLU7 knockdown behave as dominant-negative controlling SRSF1 splicing and R-loops. (A) The generation of aberrant splice variants of SRSF1 induced upon SLU7 knockdown (siSLU7) in PLC/PRF/5 and HeLa cells is prevented by co-transfection with siISO2 targeting the truncated forms of SRSF3. The expression of SRSF3-ISO2 and SLU7 is shown as control. (B) The downregulation of SRSF1 protein and the induction of DNA damage (γ-H2AX) in PLC/PRF/5 cells after SLU7 knockdown are prevented by co-transfection with siISO2 (samples are the same as in panel A). Western blot analysis of SLU7 and Actin are shown as control. (C) The induction of R-loops after SLU7 knockdown was significantly reduced after co-transfection with siISO2 in PLC/PRF/5 cells (R-loops were detected by immunofluorescence with the S9.6 antibody). Scale bar: 10 μm. The right panel shows the quantification of RNA–DNA hybrids (R-loops) per nucleus with ImageJ software. The DAPI signal was used to create a mask of the nucleus. The nuclear S9.6 signal intensity was then determined. The number of nucleus analyzed per condition is indicated. The plot was represented using GraphPad Prism. Red bars represent the median. ****P < 0.0001 (Mann–Whitney U-test). (D) SRSF3 (siSRSF3) knockdown in PLC/PRF/5 cells results in aberrant SRSF1 splicing and reduced protein, reproducing the effects of SLU7 (siSLU7) knockdown. Western blot analyses of SRSF1, SLU7 and SRSF3 proteins are shown. (E) Real time PCR of p53 isoform beta (p53β) in PLC/PRF/5 cells 48 h after transfection with siSLU7, siSLU7 + siISO2 or siSRSF3. *P < 0.05.
Figure 6.
Figure 6.
SLU7 knockdown-induced SRSF3-TR impair cell-cycle progression and SCC, promote apoptosis and modulate sororin splicing. (AC) Cell-cycle arrest A, loss of SCC as detected by chromosome spreads B (scale bar: 10 μm) and apoptosis as detected by the cleavage of PARP C induced in PLC/PRF/5 cells 48 h after SLU7 knockdown were prevented by co-transfection with siISO2. (D and E) The aberrant incorporation of intron 1 in sororin transcripts after SLU7 knockdown in PLC/PRF/5 cells, detected by real time PCR1 D or gel electrophoresis (PCR3) E was prevented after co-transfection with siISO2. The expression of SLU7 and SRSF3-ISO2 is also shown in D as control. (F) PCR detection (PCR3 in Figure 2D) of the aberrant splicing of sororin (arrowheads) in PLC/PRF/5, HeLa and H358 cells 48 h after SLU7 (siSLU7) or SRSF3 (siSRSF3) knockdown. The expression of SLU7 and SRSF3 is shown as control. (G) PLC/PRF/5 cells were transfected with a control plasmid (pcDNA) or three constructs (Exon4, V5 and Stop) that overexpress SRSF3-ISO2 mRNA (see Supplementary Figure S4E and F). The incorporation of intron 1 and intron 2 into the mRNA of sororin was analyzed by real time PCR1 and PCR2 (from Figure 2D). (H) Western blot analysis of SRSF3 after RNA-pull down using two biotinylated RNA oligos (O1 and O2) from sororin intron 1 containing two putative binding motifs for SRSF3. Extracts using in pull down assays were from PLC/PRF/5 cells transfected with the empty plasmid (pcDNA) or a plasmid expressing SRSF3-ISO2 (stop construct). (I) Western blot analysis of SRSF3 after RNA-pull down with the O1 and O2 biotinylated RNA oligos described in H using extracts from PLC/PRF/5 cells transfected with control siGL or siSLU7. The truncated isoform expressed from the pcDNA-SRSF3-ISO2 Stop construct is shown as control (arrow). The two truncated SRSF3 isoforms induced upon SLU7 knockdown (arrow and arrowhead) are able to bind both oligos. *P < 0.05. All experiments were performed at least three-times with biological duplicates per condition.
Figure 7.
Figure 7.
miR-17 rescues cell-cycle arrest and prevents the induction of SRSF3-TR proteins upon SLU7 knockdown. (A and B) Cell-cycle arrest A and loss of SCC detected by chromosome spreads B (scale bar: 10 μm) induced in PLC/PRF/5 cells 48 h after SLU7 knockdown was prevented by co-transfection with miR-17. (C) The aberrant splicing of sororin induced in PLC/PRF/5, HeLa and H358 cells 48 h after SLU7 knockdown was also prevented by co-transfection with miR-17. (D) Co-transfection of miR-17 with siSLU7 recovered sororin protein levels downregulated by siSLU7 in PLC/PRF/5 cells. (E) SRSF3 exon 4 was cloned as 3′UTR in the pMIR-REPORT luciferase plasmid (pEXON4). The same sequence with the mutations at the miR-17 recognition motif marked in bold was also cloned (pMut) as control. PLC/PRF/5 and HeLa cells were transfected with pEXON4 or pMut plasmids and miR-17 or a control miRNA (Mock). Luciferase activity was analyzed 48 h after transfection. *P < 0.05. (F) The expression of SRSF3-ISO2 was measured by real time PCR in PLC/PRF/5, HeLa and H358 cells 48 h after transfection with siGL, siSLU7 or siSLU7 + miR-17. *P < 0.05, **P < 0.01. (G) Western blot analysis of SRSF3 in H358 cells 48 h after transfection with siGL, siSLU7 or siSLU7 + miR-17. The truncated forms of SRSF3 are indicated by arrows. (H) The generation of aberrant splice variants of SRSF1 induced upon SLU7 knockdown (siSLU7) in PLC/PRF/5 and HeLa cells is prevented by co-transfection with miR17. The expression of SRSF3-ISO2 and SLU7 is shown as control. (I) The induction of R-loops after SLU7 knockdown was significantly reduced after co-transfection with miR-17 in PLC/PRF/5 cells (R-loops were detected by immunofluorescence with the S9.6 antibody). Scale bar: 10 μm. The right panel shows the quantification of RNA–DNA hybrids per nucleus with ImageJ software. The DAPI signal was used to create a mask of the nucleus. The nuclear S9.6 signal intensity was then determined. The number of nucleus analyzed per condition is indicated. The plot was represented using GraphPad Prism. Red bars represent the median. ****P < 0.0001 (Mann–Whitney U-test). All experiments were performed at least three times with biological duplicates per condition.
Figure 8.
Figure 8.
SLU7 knockdown induces genomic instability in vivo. (A) Ki67 immunostaining in the liver of mice 48, 72 and 96 h after 2/3 partial hepatectomy (PH) or control surgery (SH) 21 days after the injection of adenoassociated virus to inhibit SLU7 expression in the liver (AAV-shSLU7) or control virus (AAV-Ren). (n = 5 mice per group). (B) Liver to body weight ratio in AAV-shSLU7 and AAV-Ren mice 24, 48, 72 and 96 h after 2/3 partial hepatectomy (PH). (n = 5 mice per group). *P < 0.05. (C) Real time PCR quantification of sororin mRNA and intron 1-containing sororin transcripts in the liver of AAV-Ren and AAV-shSLU7 mice 24 and 34 h after PH. (n = 5 mice per group). *P < 0.05. (D) Western blot analysis of sororin, γ-H2AX, MAD2, P21, SLU7 and Actin, as loading control, in the liver of AAV-Ren and AAV-shSLU7 mice 24 h after PH. (E) Western blot analysis of γ-H2AX, SLU7 and Actin, as loading control, in the liver of AAV-Ren and AAV-shSLU7 mice. PCR analysis of Srsf3 Iso1 and Iso2 transcripts by PCR is also shown. (F) Quantitative analysis of hepatocyte ploidy in the liver of AAV-Ren and AAV-shSLU7. The percentage of 2n, 4n and 8n nuclei is indicated. (n = 4 mice per group). *P < 0.05. (G) Real time PCR quantification of SRSF3-ISO2 expression in samples from control (n = 10), cirrhotic (n = 24) and HCC (n = 22) tissues. **P < 0.01 and ***P < 0.001 versus controls. (H) Western blot analysis of SRSF3 after RNA-pull down with the biotinylated RNA oligo O1 from sororin intron 1 containing a putative binding motif for SRSF3. Pools of three liver tissue samples from controls (CO), cirrhotic patients (CI) and HCCs were used for pull down assays. Extracts from PLC/PRF/5 cells transfected with pcDNA-SRSF3-ISO2 were included as control.
Figure 9.
Figure 9.
Schematic representation of the mechanisms regulated by SLU7 involved in the maintenance of genome integrity. See text for details.

Similar articles

Cited by

References

    1. Aguilera A., Gómez-González B.. Genome instability: a mechanistic view of its causes and consequences. Nat. Rev. Genet. 2008; 9:204–217. - PubMed
    1. Hanahan D., Weinberg R.A.. Hallmarks of cancer: the next generation. Cell. 2011; 144:646–674. - PubMed
    1. Vogelstein B., Papadopoulos N., Velculescu V.E., Zhou S., Diaz L.A., Kinzler K.W.. Cancer genome landscapes. Science. 2013; 339:1546–1558. - PMC - PubMed
    1. Gaillard H., García-Muse T., Aguilera A.. Replication stress and cancer. Nat. Rev. Cancer. 2015; 15:276–289. - PubMed
    1. Kotsantis P., Petermann E., Boulton S.J.. Mechanisms of Oncogene-Induced replication Stress: Jigsaw falling into place. Cancer Discov. 2018; 8:537–555. - PMC - PubMed

Publication types

MeSH terms