. 2019 Apr 8;47(6):2946-2965.
doi: 10.1093/nar/gkz003.

RecFOR epistasis group: RecF and RecO have distinct localizations and functions in Escherichia coli

Affiliations

RecFOR epistasis group: RecF and RecO have distinct localizations and functions in Escherichia coli

Sarah S Henrikus et al. Nucleic Acids Res. .

Abstract

In bacteria, genetic recombination is a major mechanism for DNA repair. The RecF, RecO and RecR proteins are proposed to initiate recombination by loading the RecA recombinase onto DNA. However, the biophysical mechanisms underlying this process remain poorly understood. Here, we used genetics and single-molecule fluorescence microscopy to investigate whether RecF and RecO function together, or separately, in live Escherichia coli cells. We identified conditions in which RecF and RecO functions are genetically separable. Single-molecule imaging revealed key differences in the spatiotemporal behaviours of RecF and RecO. RecF foci frequently colocalize with replisome markers. In response to DNA damage, colocalization increases and RecF dimerizes. The majority of RecF foci are dependent on RecR. Conversely, RecO foci occur infrequently, rarely colocalize with replisomes or RecF and are largely independent of RecR. In response to DNA damage, RecO foci appeared to spatially redistribute, occupying a region close to the cell membrane. These observations indicate that RecF and RecO have distinct functions in the DNA damage response. The observed localization of RecF to the replisome supports the notion that RecF helps to maintain active DNA replication in cells carrying DNA damage.


Figures

Figure 1
Figure 1
Cells lacking recF and recO present differences in sensitivity to DNA damaging agents. (A), (B) and (C) spot plate dilution assays of MG1655 (wild-type), EAW629 (ΔrecF), EAW114 (ΔrecO), EAW669 (ΔrecR), EAW788 (recF[K36R]). Cells grown to exponential phase (OD600 ∼ 0.2) were serial diluted to the dilution 10−5. Serial dilutions were spotted on LB agar and LB agar supplemented with the indicated DNA damaging agent. Plates were incubated overnight at 37°C. Images show a representative experiment of independent triplicates. (A) Sensitivity of cells exposed to 5 μM NFZ or 3 μg/ml MMC. The sensitivities to NFZ and MMC are almost identical for ΔrecF, ΔrecO, ΔrecR and recF(K36R) strains (ΔrecF and recF(K36R) are slightly more resistant than ΔrecO, ΔrecR to NFZ). (B) Sensitivity of cells exposed to 0.3 μM bleo or 0.10 μg/ml TMP. ΔrecO, ΔrecR are ∼10 times more sensitive to bleo in comparison to wild-type, ΔrecF and recF(K36R) mutants. (C) Sensitivity of cells exposed to 7.5 ng/ml cipro or 5 mM HU. Deletion of recF confers resistance to cipro and HU. The ATPase deficient recF mutant (recF[K36R]) confers resistance to cipro. (D) Expression of the SOS reporter fusion PrecN-gfp over a period of 10 h in wild-type (blue), ΔrecF (green) and ΔrecO strains (red). Cells grown to exponential phase (OD600 ∼ 0.2) were exposed to 10 μM NFZ (downward facing triangle), 0.5 μg/ml MMC (star-shaped), 0.4 μM bleo (square), 15 μg/ml TMP (diamond), 10 ng/ml cip (pentagon) or 200 mM HU (upward facing triangle). Untreated cells (grey circle) were used as a control. The expression of PrecN-gfp per cell is expressed in relative fluorescent units (R.F.U). Upper three panels show the PrecN-gfp average expression as function of time for wt (left, blue), ΔrecF (middle, green) and ΔrecO (right, red). Error bars represent the standard deviation of biological triplicates. Lower panel, violin plot representing the global expression of PrecN-gfp, the central dot indicates the median value.
Figure 2.
Figure 2.
Construction and single-molecule imaging of RecF and RecO fusion constructs. (A) Construction of EAW670 (recF-YPet) and EAW814 (recO-YPet) as well as EAW779 (recF-mKate2) and EAW672 (recO-mKate2). The recF or recO gene of E. coli K12 MG1655 was modified using λRED recombineering so that RecF or RecO is expressed as a fusion with a fluorescent protein YPet or mKate2. (B) Detection of DNA-bound molecules in single-molecule fluorescence images. Molecules of fusion proteins that are not bound to DNA will diffuse quickly (D ≈ 10 μm2/s for a typical cytosolic protein) and thus signals from individual molecules will blur over the entire cell in our images (34- or 100-ms exposures). Molecules of fusion proteins that are bound to DNA; however, experience greatly reduced motion and thus appear as punctate foci. Because of this diffusional contrast, it is possible to detect individual molecules of RecF and RecO fusion proteins when bound to DNA. (C) Time-lapse imaging of RecF-YPet and RecO-mKate2 in response to UV irradiation. Cells were UV irradiated in a flow cell directly after t = 0 min. Images were taken from time-lapse experiments before UV irradiation (0 min) and after UV irradiation (30 and 60 min time-points); scale bar: 5 μm. (D) Histograms showing the number of RecF-YPet and RecO-mKate2 foci per cell in response to UV irradiation. Bright-field images were used to determine the position of cells within different fields of view. The numbers of foci per cell were counted for each cell and plotted in a histogram. We plotted these histograms for the time-point before UV irradiation (0 min) and several time-points following UV irradiation (10, 30, 60 and 90 min). The mean over the number of foci per cell is depicted in each histogram for each time-point. The number of cells that went into each histogram is indicated as n.
Figure 3.
Figure 3.
Binding behaviour of RecF-YPet and RecO-YPet to chromosomal DNA. (A) Average projection over time of RecF-YPet signal and representative time traces for RecF-YPet binding to DNA (continuous illumination with 34-ms exposure times over 300 frames). Average projections stem from burst acquisition movies before UV exposure and 60 min after UV exposure. The projection was made over 10 × 34 ms; scale bar: 5 μm. (B) Average projection over time of RecO-YPet signal and representative time traces for RecO-YPet binding to DNA (continuous illumination with 34-ms exposure times over 300 frames). Average projections stem from burst acquisition movies before UV exposure and 60 min after UV exposure. The projection was made over 10 × 34 ms; scale bar: 5 μm. (C) Histogram showing the number of RecF-YPet and RecO-YPet molecules per focus before UV exposure and 30–60 min after UV exposure. For the number of RecF-YPet molecules per focus before UV irradiation, 161 trajectories were sampled. For the number of RecF-YPet molecules per focus upon UV irradiation, 285 trajectories were sampled. To determine the number of RecO-YPet molecules per focus, 32 trajectories were sampled before UV exposure and 61 trajectories after UV exposure. For further explanation, see Supplementary Figure S3. (D) Autocorrelation function obtained for RecF-YPet binding events before and after UV exposure. For further explanation, see Supplementary Figure S4. (E) Autocorrelation function obtained for RecO-YPet binding events before and after UV exposure. For further explanation see Supplementary Figure S4. (F) Components of the autocorrelation for RecF-YPet and RecO-YPet binding to DNA. Components of the autocorrelation function for RecF-YPet before and after UV exposure are long (1.5 s), medium (0.3 s) and short (<0.034 s). For RecO-YPet, components are split in long (2.2 s), medium (0.3 s) and short (<0.034 s). Error bars for long and medium components are derived from the exponential fit (Supplementary Figure S4), error bars for short events stem from the standard error of the mean at lag time 0 s.
Figure 4.
Figure 4.
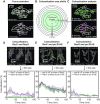
Spatiotemporal behaviour of RecF-YPet and RecO-mKate2 following UV treatment. (A) Time-lapse imaging of RecF-YPet in response to UV irradiation. Cells were UV irradiated in a flow cell directly after t = 0 min. Images were taken from time-lapse experiments before UV irradiation (0 min) and after UV irradiation (30 and 90 min time-points); scale bar: 5 μm. (B) Histogram showing the localization of RecF foci along the short axis of the cell. Histograms are derived from ∼100 cells at each time-point (for exact numbers, see Figure 2). The centre spline of the cell (a line drawn down the long axis) is at 0 μm, the cell membrane is at 0.5 and −0.5 μm. (C) 2D contour plot showing the spatiotemporal behaviour of RecF-YPet following the SOS response. The cell width is given in micrometres, the mid-cell position is at 0 μm and the dashed red line indicates the signal of a membrane binding protein, LacY. High focus abundance and other high-spatial frequency features are shown by red coloured areas in the localization map; low focus abundance is illustrated by blue coloured areas. (D) Time-lapse imaging of RecO-mKate2 in response to UV irradiation. For further description see panel (A); scale bar: 5 μm. (E) Histogram showing the localization of RecO foci along the short axis of the cell. For further description, see panel (B). (F) 2D contour plot showing the spatiotemporal behaviour of RecO-mKate2 following the SOS response. For further description, see panel (C).
Figure 5.
Figure 5.
Colocalization measurements of RecF/RecO, RecF/replisomes and RecO/replisomes. (A) Exemplary selection of RecF-YPet and RecO-mKate2 foci. Selection boxes indicate selected foci for recF-YPet and RecO-mKate2; scale bar: 3 μm. (B) Diagram of area shells used for colocalization analysis. As colocalization is a radial measurement, histograms of colocalization distances are constructed using bins of linearly increasing area rather than distance. A colocalization radius of 218 nm was used for all measurements since two replisome components colocalize within this colocalization radius. (C) Montage of two-colour images shown in (A). RecF-YPet foci appear in green and RecO-mKate2 foci appear in magenta. Upper panel: Colocalization percentages for RecF-YPet with RecO-mKate2 are determined from selected foci in the RecF-YPet channel (green circles) that colocalize to the same position with RecO-mKate2 foci from the other channel (magenta crosses). Lower panel: The opposite is shown to determine colocalization percentages of RecO-mKate2 (magenta circles) with RecF-YPet (green crosses); scale bar: 3 μm. (D) Colocalization measurements of RecF-YPet with RecO-mKate2 in response to 10 J/m2 UV. Merged images of RecF-YPet (green signal) and RecO-mkate2 (magenta signal) are shown before UV irradiation and after UV irradiation (30 and 60 min). Colocalization was measured over >300 cells. The percentage of RecF-YPet foci that contain a RecO-mKate2 focus is plotted as a green line plot over 180 min at intervals of 10 min. Similarly, the colocalization of RecO-mkate2 with RecF-YPet is plotted as a magenta line plot; scale bar: 5 μm. (E) Colocalization measurements of RecF-mKate2 with DnaX-YPet (replisomes) in response to 10 J/m2 UV. Merged images of RecF-mKate2 (magenta signal) and DnaX-YPet (green signal) are shown before UV irradiation and after UV irradiation (30 and 60 min). The percentage of RecF-mKate2 foci that contain a DnaX-YPet focus is plotted in green, the percentage of DnaX-YPet that colocalize with RecF-mKate2 is depicted with a magenta line plot (n > 300 cells); scale bar: 5 μm. (F) Colocalization measurements of RecO-mKate2 with DnaX-YPet (replisomes) in response to 10 J/m2 UV. Merged images of RecO-mkate2 (magenta signal) and DnaX-YPet (green signal) are shown before UV irradiation and after UV irradiation (30 and 60 min). Colocalization of RecF-mKate2 with DnaX-YPet is illustrated by a green line plot; colocalization of DnaX-YPet with RecO-mKate2 is presented by a magenta line plot (n > 300 cells); scale bar: 5 μm.
Figure 6.
Figure 6.
Colocalization measurements of RecF with replisomes in ΔrecO and RecO with replisomes in ΔrecF. (A) Histograms showing the number of RecF-YPet foci per cell in ΔrecO (green) and recO+ (blue) under normal growth conditions. Bright-field images were used to determine the position of cells within different fields of view. The numbers of foci per cell were counted for each cell and plotted in a histogram. The mean over the number of foci per cell is given in each histogram. The number of cells included in each histogram is also indicated as n. (B) Histograms showing the number of RecO-mKate2 foci per cell in ΔrecF (pink) and recF+ (grey) under normal growth conditions. Bright-field images were used to determine the position of cells within different fields of view. The numbers of foci per cell were counted for each cell and plotted in a histogram. The mean over the number of foci per cell is given in each histogram. The number of cells included in each histogram is also indicated as n. (C) Colocalization measurements of RecF-mKate2 with DnaX-YPet (replisomes) in ΔrecO following 10 J/m2 UV. The percentage of RecF-mKate2 foci that contain a DnaX-YPet focus is plotted in green, the percentage of DnaX-YPet that colocalizes with RecF-mKate2 is depicted with a magenta line plot (n > 100 cells). The colocalization of RecF-mKate2 with DnaX-YPet in recO+ (magenta scatter plot), and the colocalization of DnaX-YPet with RecF-mKate2 in recO+ (green scatter plot) is also plotted for each time-point as in Figure 5E. (D) Colocalization measurements of RecO-mKate2 with DnaX-YPet (replisomes) in ΔrecF following 10 J/m2 UV. The percentage of RecO-mKate2 foci that contain a DnaX-YPet focus is plotted in green, the percentage of DnaX-YPet that colocalizes with RecO-mKate2 is depicted with a magenta line plot (n > 100 cells). The colocalization of RecO-mKate2 with DnaX-YPet in recF+ (magenta scatter plot) and the colocalization of DnaX-YPet with RecO-mKate2 in recF+ (green scatter plot) are also plotted for each time-point as in Figure 5F.
Figure 7.
Figure 7.
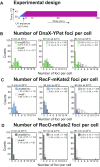
Number of DnaX-YPet, RecF-mKate2 and RecO-mKate2 foci per cell in replicating cells (dnaB+) and cells experiencing replication blocking (dnaB8[Ts]). (A) Experimental design. First image is taken at 30°C (0 min) when no UV damage is yet induced. Then, the temperature is ramped up to 42°C. UV damage is induced at 3–4 min. At 42°C, they are reached at 5 min and hold until the end of the experiment, at 120 min. (B) Histograms showing the number of DnaX-YPet foci per cell in dnaB+ (light grey) and dnaB8(Ts) (green) before UV exposure, at 30°C (0 min) and after UV exposure at 42°C (30 and 90 min). Bright-field images were used to determine the position of cells within different fields of view. The numbers of foci per cell were counted for each cell and plotted in a histogram. The mean over the number of foci per cell is given in each histogram. The number of cells included in each histogram is also indicated as n. (C) Histograms showing the number of RecF-mKate2 foci per cell in dnaB+ (light grey) and dnaB8(Ts) (blue) before UV exposure, at 30°C (0 min) and after UV exposure at 42°C (30 and 90 min). Bright-field images were used to determine the position of cells within different fields of view. The numbers of foci per cell were counted for each cell and plotted in a histogram. The mean over the number of foci per cell is given in each histogram. The number of cells included in each histogram is also indicated as n. (D) Histograms showing the number of RecO-mKate2 foci per cell in dnaB+ (light grey) and dnaB8(Ts) (dark grey) before UV exposure, at 30°C (0 min) and after UV exposure at 42°C (30 and 90 min). Bright-field images were used to determine the position of cells within different fields of view. The numbers of foci per cell were counted for each cell and plotted in a histogram. The mean over the number of foci per cell is given in each histogram. The number of cells included in each histogram is also indicated as n.

References

    1. Fuchs R.P. Tolerance of lesions in E. coli: chronological competition between translesion synthesis and damage avoidance. DNA Repair. 2016; 44:51–58. - PubMed
    1. Laranjo L.T., Gross S.J., Zeiger D.M., Lovett S.T.. SSB recruitment of Exonuclease I aborts template-switching in Escherichia coli. DNA Repair. 2017; 57:12–16. - PMC - PubMed
    1. Lovett S.T. Template-switching during replication fork repair in bacteria. DNA Repair. 2017; 56:118–128. - PMC - PubMed
    1. Cox M.M., Goodman M.F., Kreuzer K.N., Sherratt D.J., Sandler S.J., Marians K.J.. The importance of repairing stalled replication forks. Nature. 2000; 404:37–41. - PubMed
    1. Clark A.J., Sandler S.J.. Homologous genetic recombination: the pieces begin to fall into place. Crit. Rev. Microbiol. 1994; 20:125–142. - PubMed

Publication types

LinkOut - more resources