. 2019 Mar 18;47(5):2205-2215.
doi: 10.1093/nar/gkz016.

Identification of microRNA clusters cooperatively acting on epithelial to mesenchymal transition in triple negative breast cancer

Affiliations

Identification of microRNA clusters cooperatively acting on epithelial to mesenchymal transition in triple negative breast cancer

Laura Cantini et al. Nucleic Acids Res. .

Abstract

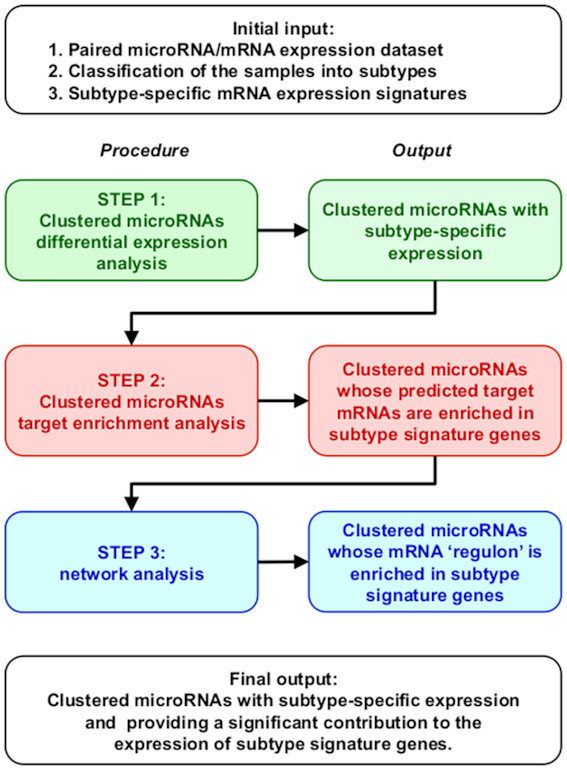
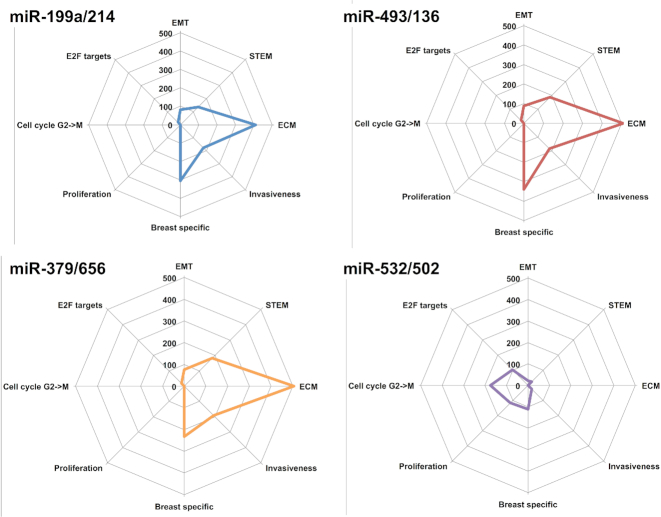
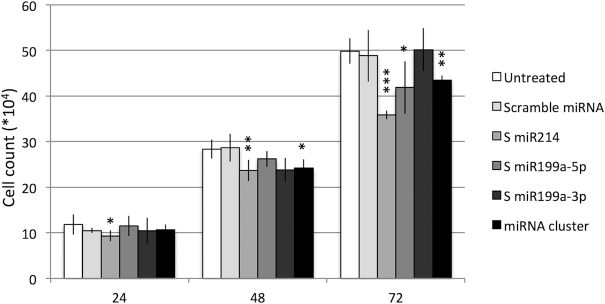
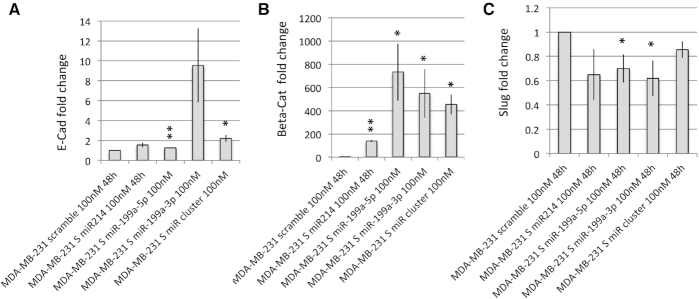
MicroRNAs play important roles in many biological processes. Their aberrant expression can have oncogenic or tumor suppressor function directly participating to carcinogenesis, malignant transformation, invasiveness and metastasis. Indeed, miRNA profiles can distinguish not only between normal and cancerous tissue but they can also successfully classify different subtypes of a particular cancer. Here, we focus on a particular class of transcripts encoding polycistronic miRNA genes that yields multiple miRNA components. We describe 'clustered MiRNA Master Regulator Analysis (ClustMMRA)', a fully redesigned release of the MMRA computational pipeline (MiRNA Master Regulator Analysis), developed to search for clustered miRNAs potentially driving cancer molecular subtyping. Genomically clustered miRNAs are frequently co-expressed to target different components of pro-tumorigenic signaling pathways. By applying ClustMMRA to breast cancer patient data, we identified key miRNA clusters driving the phenotype of different tumor subgroups. The pipeline was applied to two independent breast cancer datasets, providing statistically concordant results between the two analyses. We validated in cell lines the miR-199/miR-214 as a novel cluster of miRNAs promoting the triple negative breast cancer (TNBC) phenotype through its control of proliferation and EMT.


Figures

Figure 1.
Figure 1.
Schematic representation of the Clustered microRNA Master Regulator Analysis (ClustMMRA) workflow. The schema reports the data required as initial input, the four analytical steps with the respective outputs, and the final output of the pipeline.
Figure 2.
Figure 2.
Pathways controlled by the deregulated miRNA clusters. A summary of the main biological functions controlled by the different miRNA clusters is here reported. Y-axis of the radarplot corresponds to the sum of the absolute log(P-value) of all the pathways associated to a given function.
Figure 3.
Figure 3.
In vitro analysis of miRNA modulation effect on MDA-MB-231 cells proliferation. MDA-MB-231 cells were treated for 24,48,72 hours (h) with sense (S) oligonucleotide encoding for miRNA cluster or single miRNA (miR-214, miR-199a-5p, miR-199a-3p) or a scramble miRNA. The effect of miRNA modulation on cell proliferation is shown. Average±sd of three independent experiments for each cell line are shown. t-test P-value < 0.001 (***), <0.01 (**), <0.05 (*).
Figure 4.
Figure 4.
Effect of miRNA modulation on EMT marker genes. MiRNA modulated MDA-MB-231 cells were used for RT-PCR analysis of EMT marker genes. RT-PCR analysis shows the effect of single miRNA or miRNA cluster modulation vs scramble oligonucleotide treated cells on E-cadherin (A), beta-catenin (B) and slug (C). Average±sd of three independent experiments for each cell line are shown. t-test P-value <0.01 (**), <0.05 (*).
Figure 5.
Figure 5.
Extracellular matrix (ECM) immunofluorescence assay: collagen I staining. Average of the values of fluorescence intensity of Collagen I (Col I) of single cells, after background correction. Col I immunofluorescence was performed and pictures were taken at the same exposure (1 s) and gain (6.8). The more representative pictures for each sample are shown (A). Single picture fluorescence intensity was quantified by ImageJ analysis software (n = 6 images for each sample), and CTCF method was applied and quantified (B) (t test n = 6, P value < 0.05, *; P value < 0.01, **).

References

    1. Bartel D.P. MicroRNAs: genomics, biogenesis, mechanism, and function. Cell. 2004; 116:281–297. - PubMed
    1. Friedman R.C., Farh K.K.-H., Burge C.B., Bartel D.P.. Most mammalian mRNAs are conserved targets of microRNAs. Genome Res. 2009; 19:92–105. - PMC - PubMed
    1. Hanahan D., Weinberg R.A.. Hallmarks of cancer: the next generation. Cell. 2011; 144:646–674. - PubMed
    1. Cimmino A., Calin G.A., Fabbri M., Iorio M.V., Ferracin M., Shimizu M., Wojcik S.E., Aqeilan R.I., Zupo S., Dono M. et al.. miR-15 and miR-16 induce apoptosis by targeting BCL2. Proc. Natl. Acad. Sci. U.S.A. 2005; 102:13944–13949. - PMC - PubMed
    1. Ma L., Teruya-Feldstein J., Weinberg R.A.. Tumour invasion and metastasis initiated by microRNA-10b in breast cancer. Nature. 2007; 449:682–688. - PubMed

Publication types

MeSH terms