

Vitamin-D2 treatment-associated decrease in 25(OH)D3 level is a reciprocal phenomenon: a randomized controlled trial
- PMID: 30658603
- PMCID: PMC6339397
- DOI: 10.1186/s12902-019-0337-8
Vitamin-D2 treatment-associated decrease in 25(OH)D3 level is a reciprocal phenomenon: a randomized controlled trial
Abstract
Background: Vitamin-D2 (D2) treatment has been associated with a decrease in 25-hydroxy (25(OH)) vitamin-D3 (D3) level, suggesting that D3 treatment would be preferred to raise total 25(OH) vitamin-D (D) level. We postulated that D2 treatment-associated decrease in 25(OH)D3 level is related to the increase in 25(OH)D level rather than being D2-specific, and thus there would be a similar D3 treatment-associated decrease in 25(OH)D2 level.
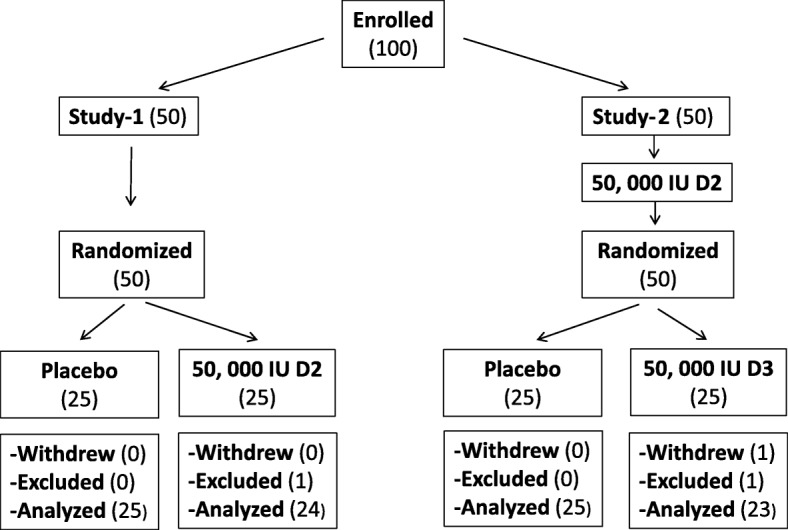
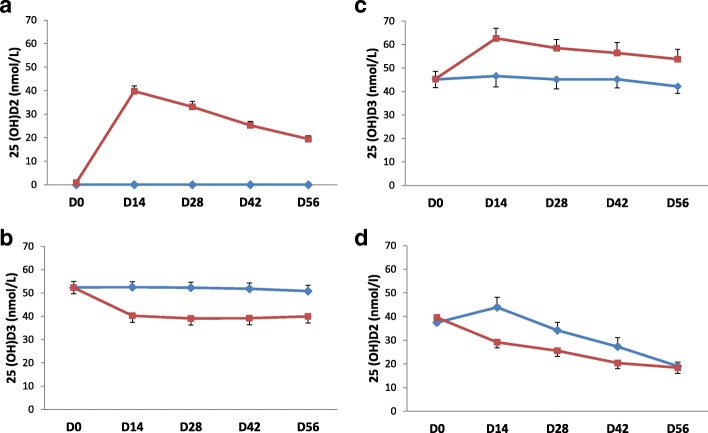
Methods: Fifty volunteers were block-randomized to 50,000 IU D2 or placebo orally once (study-1) and fifty volunteers received 50,000 IU D2 orally once and 4 days later block-randomized to 50,000 IU D3 or placebo orally once (study-2). Interventions were concealed from volunteers and research coordinators and blindly-administered. Serum 25(OH)D2 and 25(OH)D3 levels were blindly-determined at baseline and days 14, 28, 42, and 56, post-randomization by high performance liquid chromatography assay. Results of 97 participants were analyzed. Primary outcome measure was day-28 D2-associated change in 25(OH)D3 level in study-1 and D3-associated change in 25(OH)D2 level in study-2, adjusted for baseline levels.
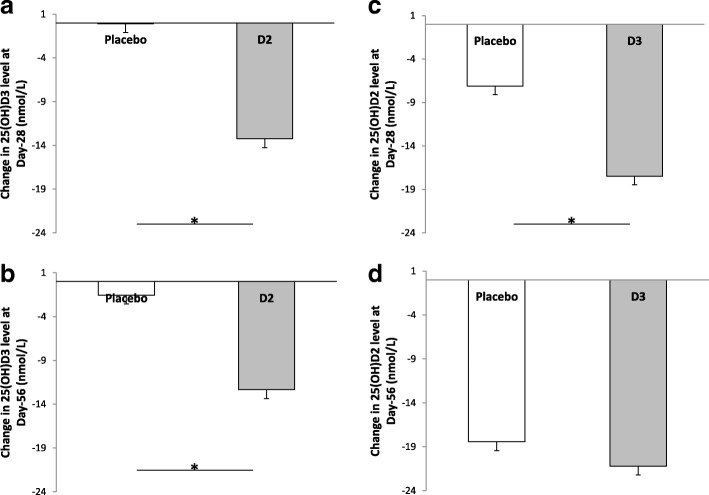
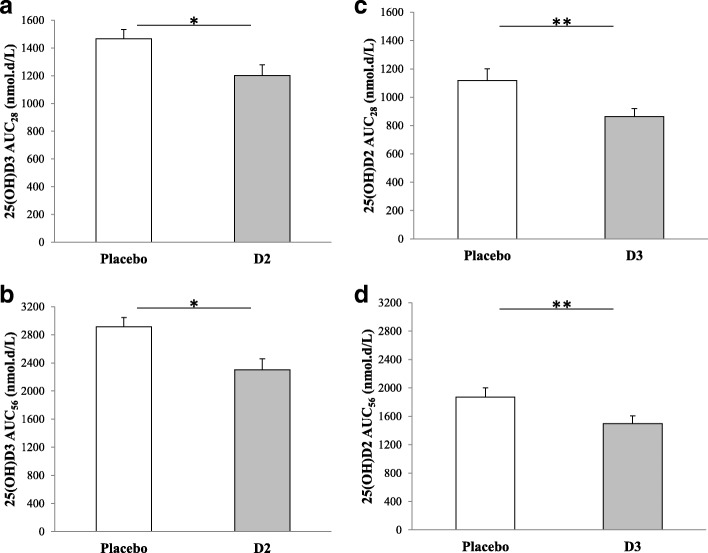
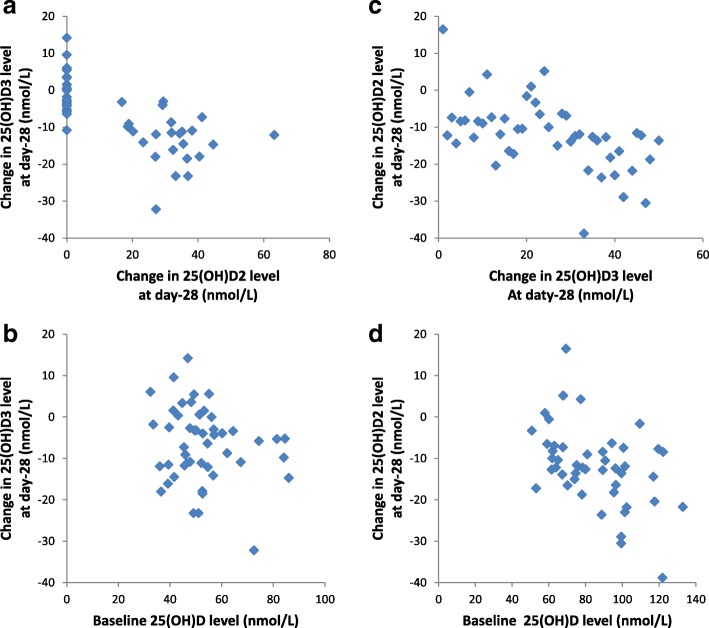
Results: Mean (95% confidence interval) difference between the active and placebo arms in the decrease in day-28 25(OH)D3 (study-1) and 25(OH)D2 (study-2) levels was 13.2 (9.7 to 16.6) and 9.8 (5.2 to 14.4) nmol/L, respectively. Corresponding differences at day-56 were 10.8 (6.8 to 14.8) and 1.7 (- 7.6 to 11.1) nmol/L, respectively. The difference between the placebo and active arms in area-under-the-curve at day-28 (AUC28) and day-56 (AUC56) were 262.3 (197.8 to 326.7) and 605.1 (446.3 to 784.0) for 25(OH)D3 (study-1) and 282.2 (111.2 to 453.3) and 431.2 (179.3 to 683.2) nmol.d/L for 25(OH)D2 (study-2), respectively. There were significant correlations between day-28 changes in 25(OH)D2 and 25(OH)D3 levels in study-1 (rho = - 0.79, p < 0.001) and study-2 (rho = - 0.36, p = 0.01), and between day-28 changes in 25(OH)D2 level and baseline 25(OH)D level in study-2 (rho = - 0.42, p = 0.003).
Conclusions: Compared to placebo, D3 treatment is associated with a decrease in 25(OH)D2 level similar in magnitude to D2-treatment associated decrease in 25(OH)D3 level; however, the D3-placebo difference in 25(OH)D2 level is shorter-lasting. Changes in 25(OH)D2 and 25(OH)D3 levels are correlated with each other and with baseline 25 (OH) D levels, suggesting a common regulatory mechanism.
Trial registration: ClinicalTrial.gov identifier: NCT03035084 (registered January 27, 2017).
Keywords: 25-hydroxyvitamin D2 level; 25-hydroxyvitamin D3 level; Cholecalciferol treatment; Ergocalciferol treatment.
Conflict of interest statement
Ethics approval and consent to participate
The study was conducted according to the ethical guidelines of the Declaration of Helsinki and was approved by the KFSH&RC Research Ethics Committee (RAC 2161235). All participants provided a written informed consent.
Consent for publication
Not applicable.
Competing interests
The authors declare that they have no competing interests.
Publisher’s Note
Springer Nature remains neutral with regard to jurisdictional claims in published maps and institutional affiliations.
Figures
Similar articles
-
Differential effects of vitamin D2 and D3 supplements on 25-hydroxyvitamin D level are dose, sex, and time dependent: a randomized controlled trial.BMC Endocr Disord. 2017 Feb 24;17(1):12. doi: 10.1186/s12902-017-0163-9. BMC Endocr Disord. 2017. PMID: 28231782 Free PMC article. Clinical Trial.
-
Daily supplementation with 15 μg vitamin D2 compared with vitamin D3 to increase wintertime 25-hydroxyvitamin D status in healthy South Asian and white European women: a 12-wk randomized, placebo-controlled food-fortification trial.Am J Clin Nutr. 2017 Aug;106(2):481-490. doi: 10.3945/ajcn.116.138693. Epub 2017 Jul 5. Am J Clin Nutr. 2017. PMID: 28679555 Clinical Trial.
-
Fortified malted milk drinks containing low-dose ergocalciferol and cholecalciferol do not differ in their capacity to raise serum 25-hydroxyvitamin D concentrations in healthy men and women not exposed to UV-B.J Nutr. 2012 Jul;142(7):1286-90. doi: 10.3945/jn.111.156166. Epub 2012 May 23. J Nutr. 2012. PMID: 22623396 Clinical Trial.
-
Serum 25(OH)D response to vitamin D3 supplementation: a meta-regression analysis.Nutrition. 2014 Sep;30(9):975-85. doi: 10.1016/j.nut.2013.12.020. Epub 2014 Jan 10. Nutrition. 2014. PMID: 24993750 Review.
-
The effect of vitamin D2 supplementation on vitamin D levels in humans: A time and dose-response meta-analysis of randomized controlled trials.Steroids. 2024 May;205:109394. doi: 10.1016/j.steroids.2024.109394. Epub 2024 Mar 6. Steroids. 2024. PMID: 38458370 Review.
Cited by
-
A ferritin-related dietary pattern is positively associated with iron status but negatively associated with vitamin D status in pregnant women: a cross-sectional study.Eur J Nutr. 2024 Nov 28;64(1):30. doi: 10.1007/s00394-024-03547-z. Eur J Nutr. 2024. PMID: 39607573 Free PMC article.
-
Comparison of the Effect of Daily Vitamin D2 and Vitamin D3 Supplementation on Serum 25-Hydroxyvitamin D Concentration (Total 25(OH)D, 25(OH)D2, and 25(OH)D3) and Importance of Body Mass Index: A Systematic Review and Meta-Analysis.Adv Nutr. 2024 Jan;15(1):100133. doi: 10.1016/j.advnut.2023.09.016. Epub 2023 Oct 20. Adv Nutr. 2024. PMID: 37865222 Free PMC article.
-
Vitamins D3 and D2 have marked but different global effects on gene expression in a rat oligodendrocyte precursor cell line.Mol Med. 2020 Apr 9;26(1):32. doi: 10.1186/s10020-020-00153-7. Mol Med. 2020. PMID: 32272884 Free PMC article.
-
Vitamin D Metabolism and Guidelines for Vitamin D Supplementation.Clin Biochem Rev. 2020 Dec;41(3):103-126. doi: 10.33176/AACB-20-00006. Clin Biochem Rev. 2020. PMID: 33343045 Free PMC article. Review.
-
Differential Effects of Oral Boluses of Vitamin D2 vs Vitamin D3 on Vitamin D Metabolism: A Randomized Controlled Trial.J Clin Endocrinol Metab. 2019 Dec 1;104(12):5831-5839. doi: 10.1210/jc.2019-00207. J Clin Endocrinol Metab. 2019. PMID: 31199458 Free PMC article. Clinical Trial.
References
-
- Holick MF, Biancuzzo RM, Chen TC, Klein EK, Young A, Bibuld D, Reitz R, Salameh W, Ameri A, Tannenbaum AD. Vitamin D2 is as effective as vitamin D3 in maintaining circulating concentrations of 25-hydroxyvitamin D. J Clin Endocrinol Metab. 2008;93(3):677–681. doi: 10.1210/jc.2007-2308. - DOI - PMC - PubMed
Publication types
MeSH terms
Substances
Associated data
Grants and funding
LinkOut - more resources
Full Text Sources
Medical
