

Augmented feedback for powered wheelchair training in a virtual environment
- PMID: 30658668
- PMCID: PMC6339295
- DOI: 10.1186/s12984-019-0482-3
Augmented feedback for powered wheelchair training in a virtual environment
Abstract
Background: Powered wheelchair (PW) driving is a complex activity and requires the acquisition of several skills. Given the risks involved with PW use, safe and effective training methods are needed. Virtual reality training allows users to practice difficult tasks in a safe environment. An additional benefit is that augmented feedback can be provided to optimize learning. The purpose of this study was to investigate whether providing augmented feedback during powered wheelchair simulator training results in superior performance, and whether skills learned in a virtual environment transfer to real PW driving.
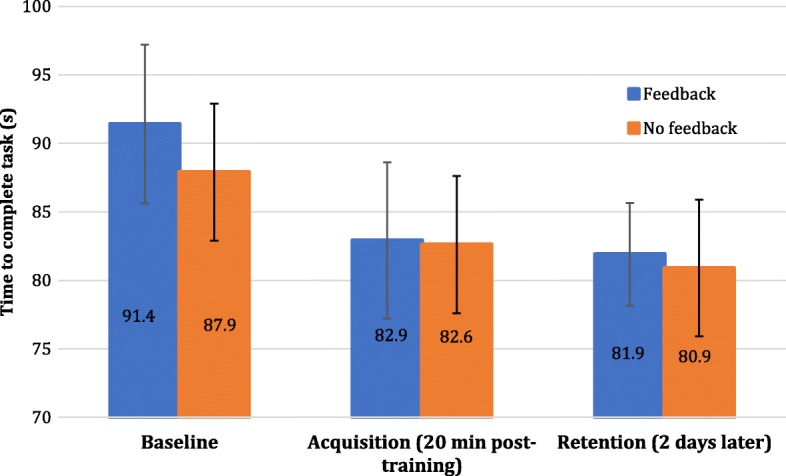
Methods: Forty healthy young adults were randomly allocated to two groups: one received augmented feedback during simulator training while the control group received no augmented feedback. PW driving performance was assessed at baseline in both the real and virtual environment (RE and VE), after training in VE and two days later in VE and RE (retention and transfer tests).
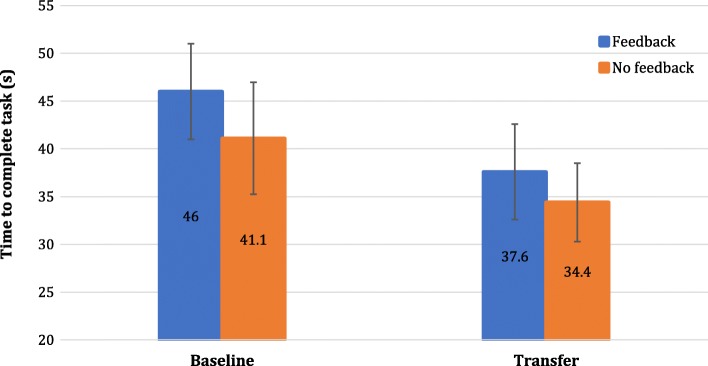
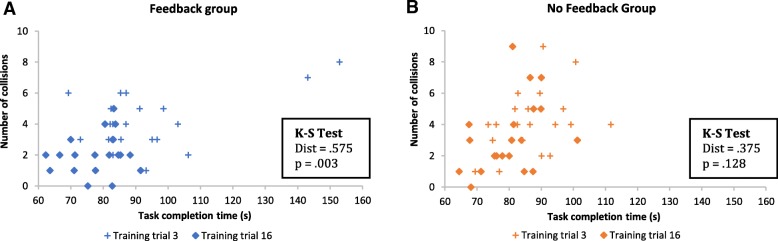
Results: Both groups showed significantly better task completion time and number of collisions in the VE after training and these results were maintained two days later. The transfer test indicated better performance in the RE compared to baseline for both groups. Because time and collisions interact, a post-hoc 2D Kolmogonov-Smirnov test was used to investigate the differences in the speed-accuracy distributions for each group; a significant difference was found for the group receiving augmented feedback, before and after training, whereas the difference was not significant for the control group. There were no differences at the retention test, suggesting that augmented feedback was most effective during and immediately after training.
Conclusions: PW simulator training is effective in improving task completion time and number of collisions. A small effect of augmented feedback was seen when looking at differences in the speed-accuracy distributions, highlighting the importance of accounting for the speed-accuracy tradeoff for PW driving.
Keywords: Augmented feedback; Powered wheelchair; Training; Virtual reality.
Conflict of interest statement
Ethics approval and consent to participate
The study received ethics approval from CRIR. All participants provided their informed consent.
Consent for publication
Not applicable.
Competing interests
The authors declare that they have no competing interests.
Publisher’s Note
Springer Nature remains neutral with regard to jurisdictional claims in published maps and institutional affiliations.
Figures


Similar articles
-
Augmented feedback for manual wheelchair propulsion technique training in a virtual reality simulator.J Neuroeng Rehabil. 2021 Sep 21;18(1):142. doi: 10.1186/s12984-021-00936-x. J Neuroeng Rehabil. 2021. PMID: 34548085 Free PMC article. Clinical Trial.
-
Development and user validation of driving tasks for a power wheelchair simulator.Disabil Rehabil. 2017 Jul;39(15):1549-1556. doi: 10.1080/09638288.2016.1226423. Epub 2016 Sep 27. Disabil Rehabil. 2017. PMID: 27669905
-
A scoping review of powered wheelchair driving tasks and performance-based outcomes.Disabil Rehabil Assist Technol. 2020 Jan;15(1):76-91. doi: 10.1080/17483107.2018.1527957. Epub 2019 Feb 7. Disabil Rehabil Assist Technol. 2020. PMID: 30729829
-
Simulation System of Electric-Powered Wheelchairs for Training Purposes.Sensors (Basel). 2020 Jun 24;20(12):3565. doi: 10.3390/s20123565. Sensors (Basel). 2020. PMID: 32599692 Free PMC article.
-
Skills assessment metrics of electric powered wheelchair driving in a virtual environment: a survey.Med Biol Eng Comput. 2022 Feb;60(2):323-335. doi: 10.1007/s11517-022-02500-8. Epub 2022 Jan 10. Med Biol Eng Comput. 2022. PMID: 35013870 Review.
Cited by
-
Acoustic Feedback in Gait Rehabilitation-Pre-Post Effects in Patients With Unilateral Hip Arthroplasty.Front Sports Act Living. 2021 May 7;3:654546. doi: 10.3389/fspor.2021.654546. eCollection 2021. Front Sports Act Living. 2021. PMID: 34027404 Free PMC article.
References
-
- Pithon T, Weiss T, Richir S, Klinger E. Wheelchair simulators: a review. Technol Disabil. 2009;21:1–10.
Publication types
MeSH terms
Grants and funding
LinkOut - more resources
Full Text Sources
Medical
