. 2019 Jan 18;38(1):25.
doi: 10.1186/s13046-019-1033-2.

DHHC protein family targets different subsets of glioma stem cells in specific niches

Affiliations

DHHC protein family targets different subsets of glioma stem cells in specific niches

Xueran Chen et al. J Exp Clin Cancer Res. .

Abstract

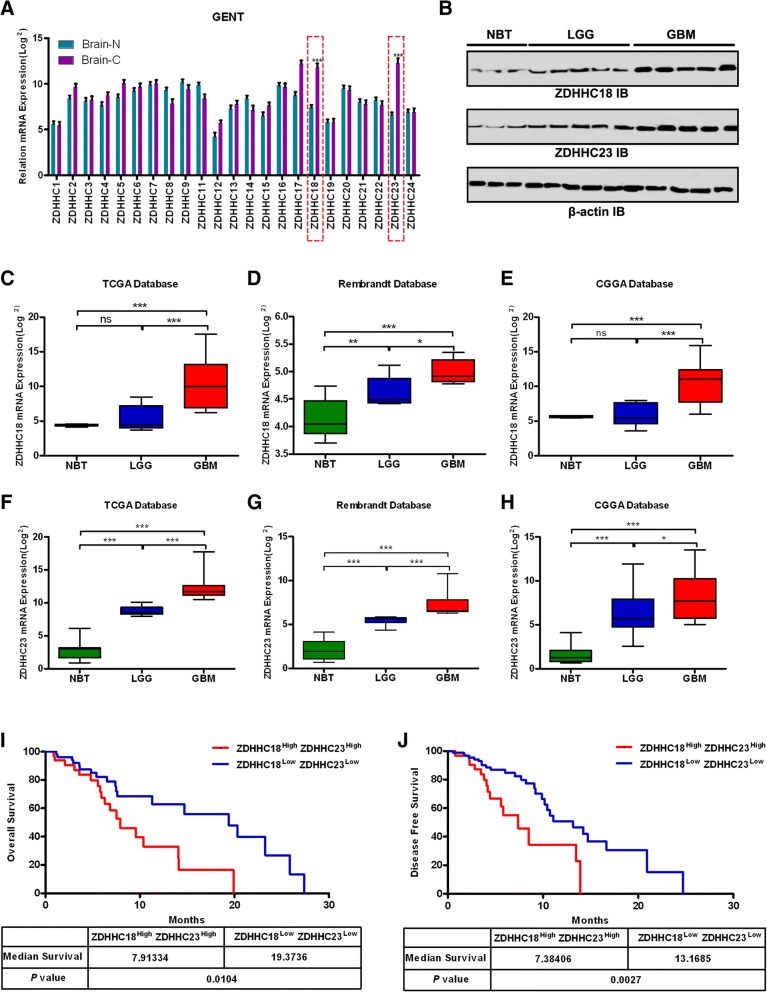
Background: Glioblastomas (GBM) comprise different subsets that exhibit marked heterogeneity and plasticity, leading to a lack of success of genomic profiling in guiding the development of precision medicine approaches against these tumors. Accordingly, there is an urgent need to investigate the regulatory mechanisms for different GBM subsets and identify novel biomarkers and therapeutic targets relevant in the context of GBM-specific niches. The DHHC family of proteins is associated tightly with the malignant development and progression of gliomas. However, the role of these proteins in the plasticity of GBM subsets remains unclear.

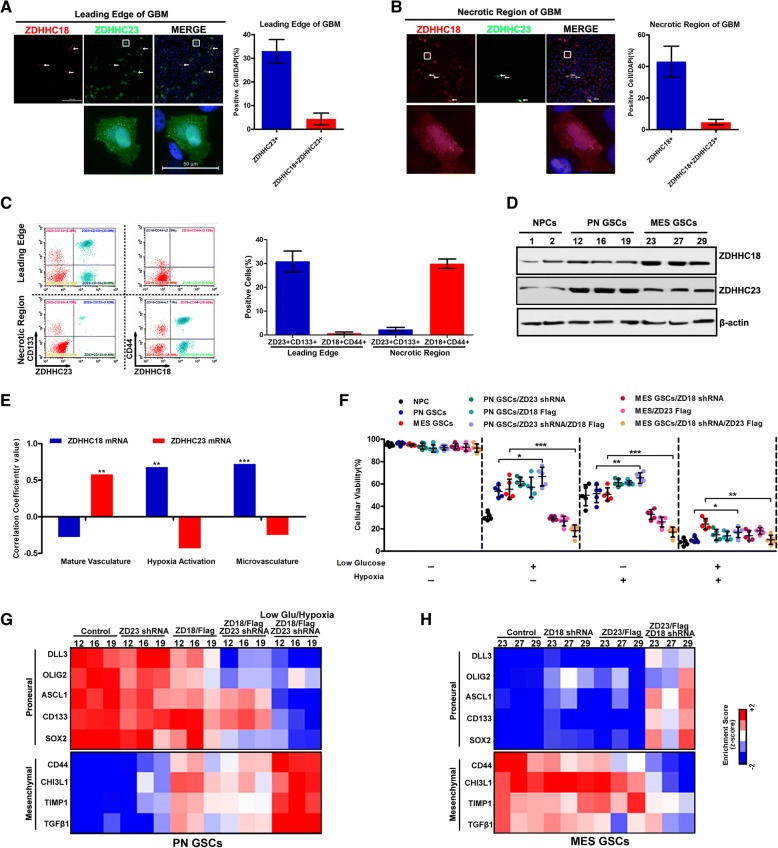
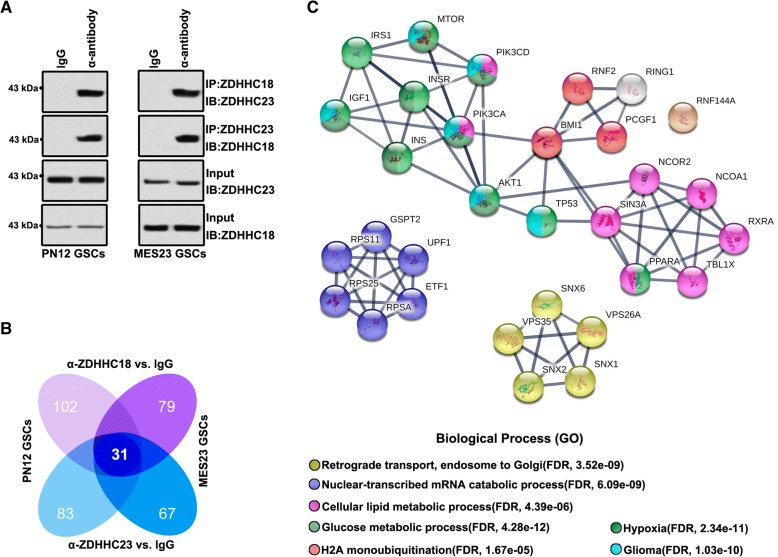
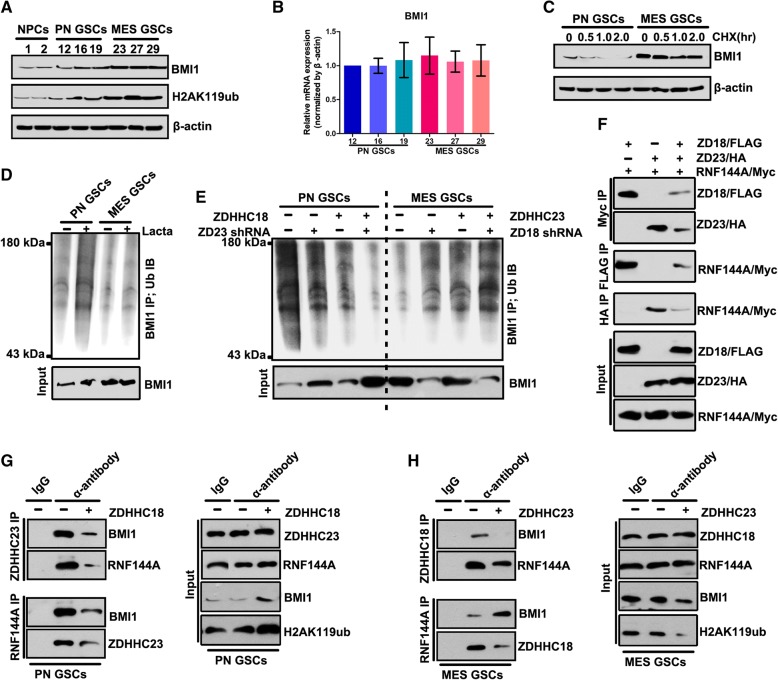
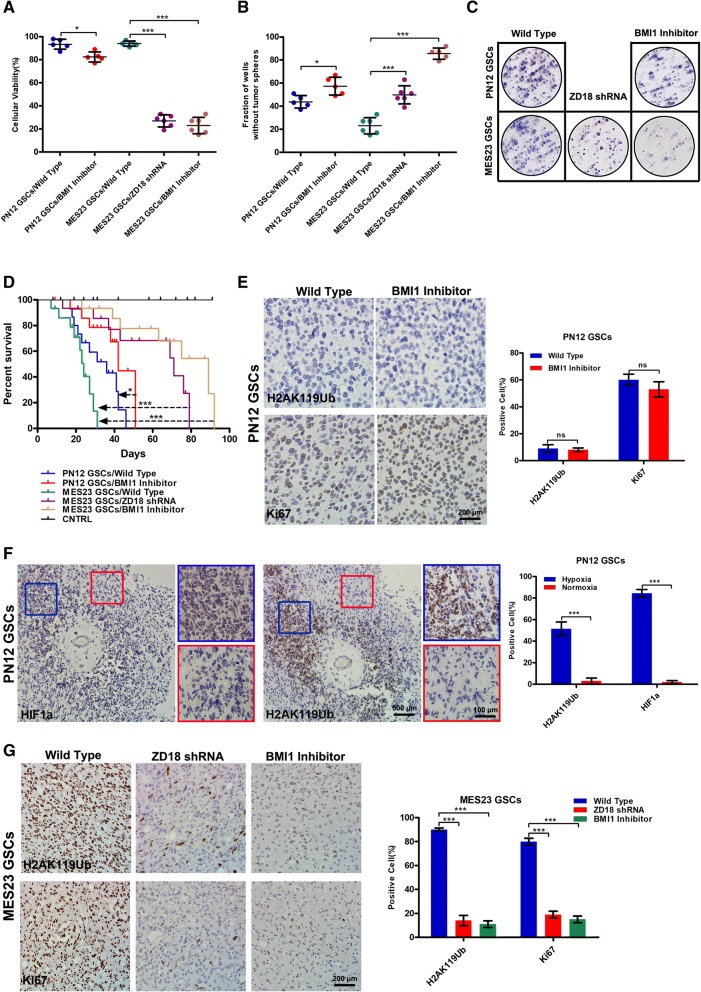
Methods: This study utilized human glioma proneural or mesenchymal stem cells as indicated. The effects of DHHC proteins on different GBM subsets were investigated through in vitro and in vivo assays (i.e., colony formation assay, flow cytometry assay, double immunofluorescence, western blot, and xenograft model). Western blot, co-immunoprecipitation, and liquid chromatograph mass spectrometer-mass spectrometry assays were used to detect the protein complexes of ZDHHC18 and ZDHHC23 in various GBM subtypes, and explore the mechanism of DHHC proteins in targeting different subsets of GSCs in specific niches.

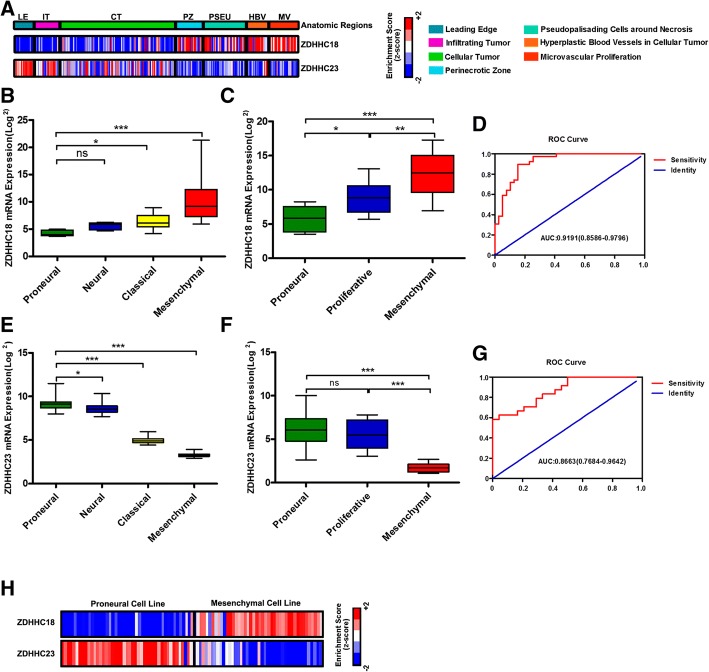
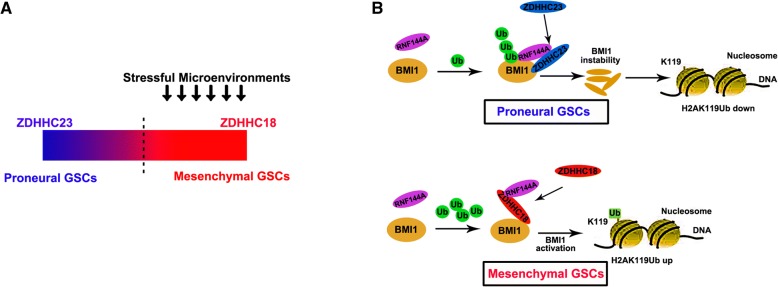
Results: ZDHHC18 and ZDHHC23 could target the glioma stem cells of different GBM subsets in the context of their specific niches and regulate the cellular plasticity of these subtypes. Moreover, mechanistic investigations revealed that ZDHHC18 and ZDHHC23 competitively interact with a BMI1 E3 ligase, RNF144A, to regulate the polyubiquitination and accumulation of BMI1. These events contributed to the transition of glioma stem cells in GBM and cell survival under the stressful tumor microenvironment.

Conclusions: Our work highlights the role of DHHC proteins in the plasticity of GBM subsets and reveals that BMI1 represents a potential therapeutic target for human gliomas.

Keywords: BMI1; DHHC protein; Glioblastoma; Glioma stem cell.


Conflict of interest statement

Ethics approval and consent to participate

This study was reviewed and approved by the Institutional Review Board of the Animal Use and Care Committees at Hefei Institutes of Physical Science, CAS.

Consent for publication

All authors have agreed to publish this manuscript.

Competing interests

The authors declare that they have no competing interests.

Publisher’s Note

Springer Nature remains neutral with regard to jurisdictional claims in published maps and institutional affiliations.

Figures

Fig. 1
Fig. 1
Expression of ZDHHC18 or ZDHHC23 is associated with tumor grade in gliomas. a Public data retrieved from the GENT database indicate that the expression levels of ZDHHC18 and ZDHHC23 are higher in brain cancer tissues (C) than those in normal brain tissues (N). The data were downloaded to normalized log2 value for each gene in the database and the graph was re-drawn in R program. (***, p < 0.001; Brain-N: n = 176, brain-C: n = 2357). b Expression levels of ZDHHC18 and ZDHHC23 as detected by western blot analysis in LGG, and GBM gliomas and normal brain tissues. β-actin was used as a loading control. NBT, normal brain tissue; LGG, low grade glioma; GBM, glioblastoma multiforme. c-e Quantification of ZDHHC18 mRNA expression levels in gliomas in TCGA (c), Rembrandt (d), and CGGA (e) datasets (ns, not significant; *, p < 0.05; **, p < 0.01; ***, p < 0.001). f-h Quantification of ZDHHC23 mRNA expression levels in gliomas in TCGA (f), Rembrandt (g), and CGGA (h) datasets (*, p < 0.05; ***, p < 0.001). i and j Cumulative overall survival (i) and disease-free survival (j) of patients with GBM and low/high co-expression levels of ZDHHC18/ZDHHC23 (based on median expression levels of ZDHHC18 and ZDHHC23, respectively) estimated using the Kaplan–Meier method and compared with the log-rank test in the same set of patients (n = 32; *, p < 0.05; ***, p < 0.001)
Fig. 2
Fig. 2
Expression of ZDHHC18 or ZDHHC23 is associated with glioblastoma (GBM) subgroups in patients with glioma. a Heatmap showing the expression pattern of ZDHHC18 and ZDHHC23 as indicated by Z-scores in distinct anatomic regions of GBM tissues from the Ivy GAP database (RNA-sample, n = 122; patient, n = 10). The corresponding histological feature for each RNA-sample is labeled as follows: leading edge (LE); infiltrating tumor (IT); cellular tumor (CT); perinecrotic zone (PZ); pseudopallisading cells around necrosis (PSEU); hyperplastic blood vessels in cellular tumor (HBV); microvascular proliferative region (MV). b and c Quantification of GBM subtype-specific ZDHHC18 expression in the TCGA and GSE4271 datasets. Log2-transformed values of the expression levels of ZDHHC18 mRNA are listed on the Y-axis. Error bars represent the SEM. d Receiver operating characteristic (ROC) curve showing sensitivity of ZDHHC18 as a marker to distinguish patients with mesenchymal from non-mesenchymal subtype GBM. e and f Quantification of GBM subtype-specific ZDHHC23 expression in the TCGA and GSE4271 datasets. Log2-transformed expression of ZDHHC23 mRNA levels is listed on the Y-axis. Error bars represent the SEM. g ROC curve showing the sensitivity of ZDHHC23 as a marker to distinguish patients with proneural from non-proneural subtype GBM. h Heatmap showing the expression pattern of ZDHHC18 and ZDHHC23 as indicated by Z-scores in the proneural and mesenchymal glioma cell lines from the GENT database (RNA-sample n = 266)
Fig. 3
Fig. 3
ZDHHC18 and ZDHHC23 target different subsets of glioma stem cells (GSCs) in specific niches. a, b Immunofluorescence images showing ZDHHC18 (red) and ZDHHC23 (green) positive locations and cells in the leading edge (a) and neurotic (b) regions of the glioblastoma (GBM) samples. Scale bar (upper image): 200 μm; (lower image, inset box): 50 μm (white). Quantification of ZDHHC23 positive or ZDHHC18 and ZDHHC23 positive cells in three fields is presented. Error bars represent the SEM. c Results of flow cytometry analysis showing the relationship between the expression of ZDHHC18 (or ZDHHC23) and stem cell marker CD133 (or CD44) in the leading edge and neurotic regions of the GBM samples. Quantification of ZDHHC18/CD133, ZDHHC23/CD133, ZDHHC18/CD44, and ZDHHC23/CD44 positive cells in three fields is presented. Error bars represents the SEM. d Expression levels of ZDHHC18 and ZDHHC23 detected by western blot analysis in neural progenitor cells (NPC1 and NPC2), proneural GSCs (PN12, PN16, and PN19), and mesenchymal GSCs (MES23, MES27, and MES29). β-actin was used as a loading control. e Bar graph showing Pearson coefficients of correlation between ZDHHC18 (blue) or ZDHHC23 (red) mRNA expression and the mature vasculature, microvasculature, and hypoxia activation signatures in 12 GSC and one NPC culture (**, p < 0.01; ***, p < 0.001). f Cell viability of NPC1, proneural GSCs (PN12), mesenchymal GSCs (MES23), or proneural (or mesenchymal) GSCs transfected with indicated plasmids was determined under baseline, low-glucose, hypoxia, or conditions with a combination of these stresses. Data are presented as means ± SEM (*, p < 0.05; **, p < 0.01; ***, p < 0.001). g and h Heatmap showing the molecular subtype marker expression in proneural GSCs (PN12, PN16, and PN19), mesenchymal GSCs (MES23, MES27, and MES29), and proneural (or mesenchymal) GSCs transfected with indicated plasmids under baseline or low-glucose/hypoxia stress. Proneural markers: DLL3, OLIG2, ASCL1, CD133, and SOX2; mesenchymal markers: CD44, CHI3L1, TIMP1, and TGFβ1. Z-scores were calculated from the ΔCt values obtained in the qPCR analysis
Fig. 4
Fig. 4
BMI1 constitutes a potential interaction partner in the ZDHHC18/ZDHHC23 protein interaction network in proneural and mesenchymal glioma stem cells (GSCs). a, b Lysates from proneural GSCs (PN12) and mesenchymal GSCs (MES23) were subjected to immunoprecipitation using anti-ZDHHC18 and anti-ZDHHC23 antibodies, respectively, and then (a) immunoblotted with anti-ZDHHC18 and anti-ZDHHC23 antibodies, or (b) the IP-protein complex was subjected to LC/MS-MS analysis. Venn diagrams showing the overlaps between specific peaks of the various IP-protein complexes. c Protein–protein interaction networks indicated by STRING software showing the overlapping peaks in both the proneural and mesenchymal GSCs after immunoprecipitation with anti-ZDHHC18 and anti-ZDHHC23 antibodies, respectively. The shared regions mostly converged on 31 protein targets, generally associated with retrograde transport, nuclear-transcribed mRNA catabolic process, cellular lipid, and glucose metabolic processes, H2A monoubiquitination, hypoxia microenvironment, and glioma development
Fig. 5
Fig. 5
ZDHHC18 and ZDHHC23 regulate BMI1 polyubiquitination. a Expression levels of BMI1 and H2AK119Ub detected by western blot analysis in neural progenitor cells (NPC1 and NPC2), proneural glioma stem cells (GSCs) (PN12, PN16, and PN19), and mesenchymal GSCs (MES23, MES27, and MES29). β-actin was used as a loading control. b mRNA levels of BMI1 were detected by RT-PCR analysis in the proneural GSCs (PN12, PN16, and PN19) and mesenchymal GSCs (MES23, MES27, and MES29). β-actin was used as a loading control. Data are presented as means ± SEM. c BMI1 protein expression in PN12 and MES23 GSCs after cycloheximide treatment (CHX, 50 μM) for the indicated times. d, e Immunoprecipitation followed by immunoblotting was performed for determining BMI1 polyubiquitination in PN12 and MES23 GCSs in the presence and absence of lactacystin treatment for 5 h (Lacta, 10 μM) (d) or transfected with the indicated plasmids in the presence of lactacystin treatment for 5 h (Lacta, 10 μM) (e). f Lysates from 293 T cells expressing the FLAG-ZDHHC18, HA-ZDHHC23, and Myc-RNF144A were subjected to immunoprecipitation, followed by immunoblotting with anti-FLAG, anti-HA, and anti-Myc antibodies. g, h Lysates from PN12 (g) or MES23 (h) GSCs transfected with the indicated plasmids were subjected to immunoprecipitation with anti-ZDHHC23 (g), anti-ZDHHC18 (h), or anti-RNF144A antibody (g and h), followed by immunoblotting with anti-BMI1, anti-RNF144A, anti-ZDHHC18, and anti-ZDHHC23 antibodies
Fig. 6
Fig. 6
BMI1 inhibitor (PTC596) is effective against the mesenchymal subgroup of glioblastoma (GBM). a-c Cell viability (a), tumorsphere formation (b), and foci formation (c) was determined for proneural (PN12) and mesenchymal (MES23) glioma stem cells (GSCs) transfected with the indicated plasmids in the presence or absence of PTC596 (10 μM) treatment for 24 h (a), 72 h (b), or 2 weeks (c) . Data are presented as means ± SEM (*, p < 0.05; ***, p < 0.001). d Kaplan–Meier survival curve showing the survival of NOD SCID gamma mice injected with 500 PN12 or 500 MES23 (or shRNA-ZDHHC18 MES23) GSCs with or without PTC596 treatment (n = 15; *, p < 0.05; ***, p < 0.001). e Immunohistochemistry analysis for H2AK119Ub and Ki-67 in sections from the xenografts of intracranially implanted PN12 GSCs. Quantification of H2AK119Ub and Ki67 positive cells in three fields is presented. Error bars represent the SEM (ns, not significant). Scale bar, 200 μm. f Immunohistochemistry analysis for HIF1α and H2AK119Ub in sections from the xenografts of intracranially implanted PN12 GSCs. Blue box, hypoxic region; red box, normoxic region. Scale bar: (left image) 500 μm; (right image, inset box) 100 μm (white). Quantification of HIF1α and H2AK119Ub positive cells in three fields is presented. Error bars represent the SEM (***, p < 0.001). g Immunohistochemistry analysis for H2AK119Ub and Ki-67 in sections from the xenografts of intracranially implanted MES23 GSCs transfected with the indicated plasmids with or without PTC596 treatment. Quantification of H2AK119Ub and Ki67 positive cells in three fields is presented. Error bars represent the SEM (***, p < 0.001). Scale bar, 200 μm
Fig. 7
Fig. 7
Schematic diagram. a Schematic diagram showing induction of the mesenchymal-to-proneural transition by the depletion of ZDHHC18 and the upregulation of ZDHHC23. Heterogeneous distribution of glioma stem cells (GSCs) occurs in different types of niches and the transcriptional groups of glioblastoma are plastic. The response to stress might be chosen based on the dependence on DHHC proteins, in which cellular survival is promoted by ZDHHC18 under nutrient scarcity and low oxygen stress. b Schematic diagram showing that the ubiquitin-mediated proteolysis maintains BMI1 protein stability in different GSC subtypes. In the proneural GSCs, ZDHHC23 recruits RNF144A for polyubiquitination of BMI1. However, ZDHHC18 hinders the association of RNF144A and BMI1 to reduce the level of polyubiquitinated BMI1 in the mesenchymal GSCs

Similar articles

Cited by

References

    1. Lapointe S, Perry A, Butowski NA. Primary brain tumours in adults. Lancet. 2018;392:432–446. doi: 10.1016/S0140-6736(18)30990-5. - DOI - PubMed
    1. Wen PY, Kesari S. Malignant gliomas in adults. N Engl J Med. 2008;359:492–507. doi: 10.1056/NEJMra0708126. - DOI - PubMed
    1. Reardon DA, Wen PY. Glioma in 2014: unravelling tumour heterogeneity-implications for therapy. Nat Rev Clin Oncol. 2015;12:69–70. doi: 10.1038/nrclinonc.2014.223. - DOI - PubMed
    1. Manoranjan B, Venugopal C, McFarlane N, Doble BW, Dunn SE, Scheinemann K, Singh SK. Medulloblastoma stem cells: modeling tumor heterogeneity. Cancer Lett. 2013;338:23–31. doi: 10.1016/j.canlet.2012.07.010. - DOI - PubMed
    1. Man J, Yu X, Huang H, Zhou W, Xiang C, Miele L, Liu Z, Bebek G, Bao S, Yu JS. Hypoxic induction of Vasorin regulates Notch1 turnover to maintain glioma stem-like cells. Cell Stem Cell. 2018;22:104–118. doi: 10.1016/j.stem.2017.10.005. - DOI - PMC - PubMed

LinkOut - more resources