

Increased brain age in adults with Prader-Willi syndrome
- PMID: 30658944
- PMCID: PMC6412082
- DOI: 10.1016/j.nicl.2019.101664
Increased brain age in adults with Prader-Willi syndrome
Abstract
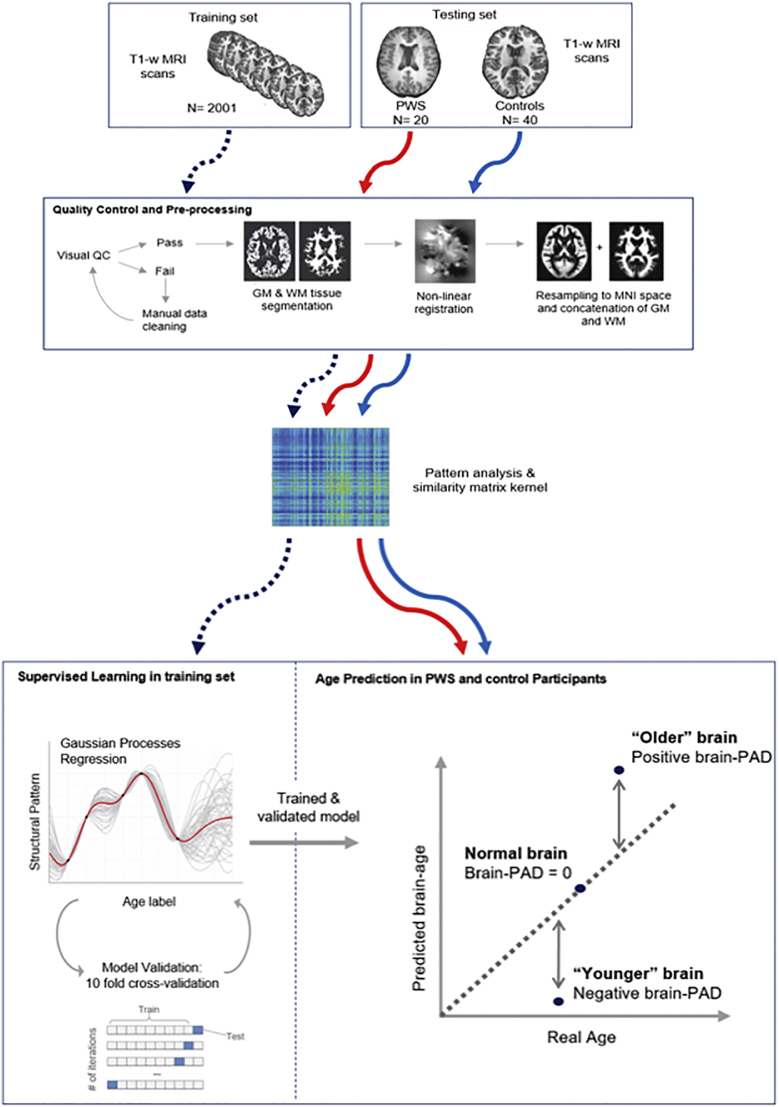
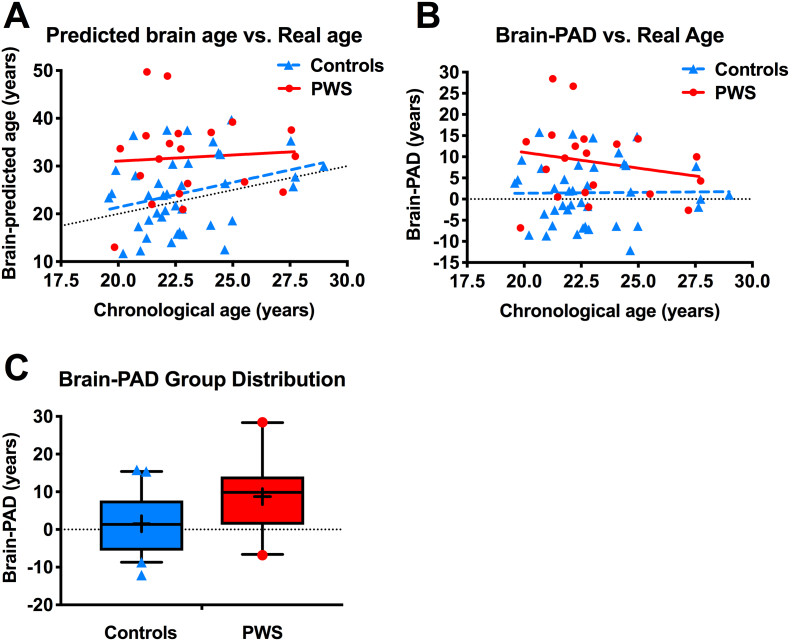
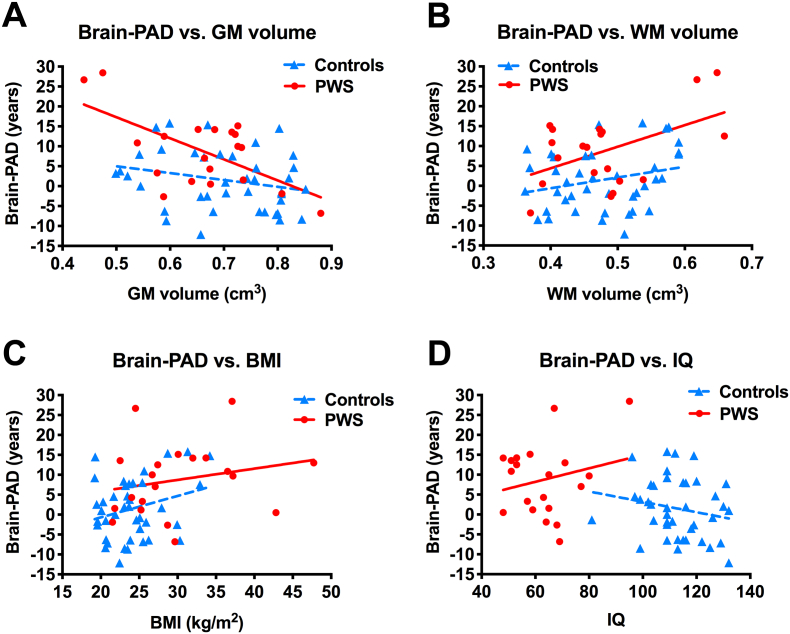
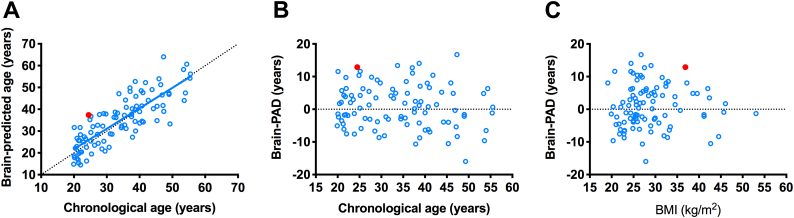
Prader-Willi syndrome (PWS) is the most common genetic obesity syndrome, with associated learning difficulties, neuroendocrine deficits, and behavioural and psychiatric problems. As the life expectancy of individuals with PWS increases, there is concern that alterations in brain structure associated with the syndrome, as a direct result of absent expression of PWS genes, and its metabolic complications and hormonal deficits, might cause early onset of physiological and brain aging. In this study, a machine learning approach was used to predict brain age based on grey matter (GM) and white matter (WM) maps derived from structural neuroimaging data using T1-weighted magnetic resonance imaging (MRI) scans. Brain-predicted age difference (brain-PAD) scores, calculated as the difference between chronological age and brain-predicted age, are designed to reflect deviations from healthy brain aging, with higher brain-PAD scores indicating premature aging. Two separate adult cohorts underwent brain-predicted age calculation. The main cohort consisted of adults with PWS (n = 20; age mean 23.1 years, range 19.8-27.7; 70.0% male; body mass index (BMI) mean 30.1 kg/m2, 21.5-47.7; n = 19 paternal chromosome 15q11-13 deletion) and age- and sex-matched controls (n = 40; age 22.9 years, 19.6-29.0; 65.0% male; BMI 24.1 kg/m2, 19.2-34.2) adults (BMI PWS vs. control P = .002). Brain-PAD was significantly greater in PWS than controls (effect size mean ± SEM +7.24 ± 2.20 years [95% CI 2.83, 11.63], P = .002). Brain-PAD remained significantly greater in PWS than controls when restricting analysis to a sub-cohort matched for BMI consisting of n = 15 with PWS with BMI range 21.5-33.7 kg/m2, and n = 29 controls with BMI 21.7-34.2 kg/m2 (effect size +5.51 ± 2.56 years [95% CI 3.44, 10.38], P = .037). In the PWS group, brain-PAD scores were not associated with intelligence quotient (IQ), use of hormonal and psychotropic medications, nor severity of repetitive or disruptive behaviours. A 24.5 year old man (BMI 36.9 kg/m2) with PWS from a SNORD116 microdeletion also had increased brain PAD of 12.87 years, compared to 0.84 ± 6.52 years in a second control adult cohort (n = 95; age mean 34.0 years, range 19.9-55.5; 38.9% male; BMI 28.7 kg/m2, 19.1-43.1). This increase in brain-PAD in adults with PWS indicates abnormal brain structure that may reflect premature brain aging or abnormal brain development. The similar finding in a rare patient with a SNORD116 microdeletion implicates a potential causative role for this PWS region gene cluster in the structural brain abnormalities associated primarily with the syndrome and/or its complications. Further longitudinal neuroimaging studies are needed to clarify the natural history of this increase in brain age in PWS, its relationship with obesity, and whether similar findings are seen in those with PWS from maternal uniparental disomy.
Keywords: Body mass index; MRI; Obesity; PWS; SNORD116; Structural neuroimaging.
Copyright © 2019 The Authors. Published by Elsevier Inc. All rights reserved.
Figures
References
-
- Alosco M.L., Stanek K.M., Galioto R., Korgaonkar M.S., Grieve S.M., Brickman A.M., Spitznagel M.B., Gunstad J. Body mass index and brain structure in healthy children and adolescents. Int. J. Neurosci. 2014;124(1):49–55. - PubMed
-
- Amos-Landgraf J.M., Ji Y., Gottlieb W., Depinet T., Wandstrat A.E., Cassidy S.B., Driscoll D.J., Rogan P.K., Schwartz S., Nicholls R.D. Chromosome breakage in the Prader-Willi and Angelman syndromes involves recombination between large, transcribed repeats at proximal and distal breakpoints. Am. J. Hum. Genet. 1999;65(2):370–386. - PMC - PubMed
-
- Bieth E., Eddiry S., Gaston V., Lorenzini F., Buffet A., Conte Auriol F., Molinas C., Cailley D., Rooryck C., Arveiler B., Cavaillé J., Salles J.P., Tauber M. Highly restricted deletion of the SNORD116 region is implicated in Prader-Willi Syndrome. Eur. J. Hum. Genet. 2015 Feb;23(2):252–255. - PMC - PubMed
Publication types
MeSH terms
Grants and funding
LinkOut - more resources
Full Text Sources
Other Literature Sources
Medical
