Population Genomics Insights into Adaptive Evolution and Ecological Differentiation in Streptomycetes
- PMID: 30658977
- PMCID: PMC6585496
- DOI: 10.1128/AEM.02555-18
Population Genomics Insights into Adaptive Evolution and Ecological Differentiation in Streptomycetes
Abstract
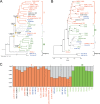
Deciphering the genomic variation that represents microevolutionary processes toward species divergence is key to understanding microbial speciation, which has long been under debate. Streptomycetes are filamentous bacteria that are ubiquitous in nature and the richest source of antibiotics; however, their speciation processes remain unknown. To tackle this issue, we performed a comprehensive population genomics analysis on Streptomyces albidoflavus residing in different habitats and with a worldwide distribution and identified and characterized the foundational changes within the species. We detected three well-defined phylogenomic clades, of which clades I and III mainly contained free-living (soil/marine) and insect-associated strains, respectively, and clade II had a mixed origin. By performing genome-wide association studies (GWAS), we identified a number of genetic variants associated with free-living or entomic (denoting or relating to insects) habitats in both the accessory and core genomes. These variants contributed collectively to the population structure and had annotated or confirmed functions that likely facilitate differential adaptation of the species. In addition, we detected higher levels of homologous recombination within each clade and in the free-living group than within the whole species and in the entomic group. A subset of the insect-associated strains (clade III) showed a relatively independent evolutionary trajectory with more symbiosis-favorable genes but little genetic interchange with the other lineages. Our results demonstrate that ecological adaptation promotes genetic differentiation in S. albidoflavus, suggesting a model of ecological speciation with gene flow in streptomycetes.IMPORTANCE Species are the fundamental units of ecology and evolution, and speciation leads to the astounding diversity of life on Earth. Studying speciation is thus of great significance to understand, protect, and exploit biodiversity, but it is a challenge in the microbial world. In this study, using population genomics, we placed Streptomyces albidoflavus strains in a spectrum of speciation and showed that the genetic differences between phylogenomic clusters evolved mainly by environmental selection and gene-specific sweeps. These findings highlight the role of ecology in structuring recombining bacterial species, making a step toward a deeper understanding of microbial speciation. Our results also raise concerns of an underrated microbial diversity at the intraspecies level, which can be utilized for mining of ecologically relevant natural products.
Keywords: adaptive evolution; ecological differentiation; population genomics; speciation; streptomycetes.
Copyright © 2019 American Society for Microbiology.
Figures


Similar articles
-
Habitat Adaptation Drives Speciation of a Streptomyces Species with Distinct Habitats and Disparate Geographic Origins.mBio. 2022 Feb 22;13(1):e0278121. doi: 10.1128/mbio.02781-21. Epub 2022 Jan 11. mBio. 2022. PMID: 35012331 Free PMC article.
-
Population genetic analysis of Streptomyces albidoflavus reveals habitat barriers to homologous recombination in the diversification of streptomycetes.Appl Environ Microbiol. 2015 Feb;81(3):966-75. doi: 10.1128/AEM.02925-14. Epub 2014 Nov 21. Appl Environ Microbiol. 2015. PMID: 25416769 Free PMC article.
-
Comparative genomics reveals broad genetic diversity, extensive recombination and nascent ecological adaptation in Micrococcus luteus.BMC Genomics. 2021 Feb 18;22(1):124. doi: 10.1186/s12864-021-07432-5. BMC Genomics. 2021. PMID: 33602135 Free PMC article.
-
Population Genomics of Adaptive Radiation.Mol Ecol. 2025 Jan;34(2):e17574. doi: 10.1111/mec.17574. Epub 2024 Dec 24. Mol Ecol. 2025. PMID: 39717932 Review.
-
The Global Genome Question: Microbes as the Key to Understanding Evolution and Ecology: This report is based on a colloquium, “The Global Genome Question: Microbes as the Key to Understanding Evolution and Ecology,” sponsored by the American Academy of Microbiology and held October 11-13, 2002, in Longboat Key, Florida.Washington (DC): American Society for Microbiology; 2004. Washington (DC): American Society for Microbiology; 2004. PMID: 33119236 Free Books & Documents. Review.
Cited by
-
Regulation of Antibiotic Production by Signaling Molecules in Streptomyces.Front Microbiol. 2019 Dec 19;10:2927. doi: 10.3389/fmicb.2019.02927. eCollection 2019. Front Microbiol. 2019. PMID: 31921086 Free PMC article. Review.
-
Habitat Adaptation Drives Speciation of a Streptomyces Species with Distinct Habitats and Disparate Geographic Origins.mBio. 2022 Feb 22;13(1):e0278121. doi: 10.1128/mbio.02781-21. Epub 2022 Jan 11. mBio. 2022. PMID: 35012331 Free PMC article.
-
Dissolution of the Disparate: Co-ordinate Regulation in Antibiotic Biosynthesis.Antibiotics (Basel). 2019 Jun 18;8(2):83. doi: 10.3390/antibiotics8020083. Antibiotics (Basel). 2019. PMID: 31216724 Free PMC article. Review.
-
Distribution and Evolutionary History of Sialic Acid Catabolism in the Phylum Actinobacteria.Microbiol Spectr. 2022 Feb 23;10(1):e0238021. doi: 10.1128/spectrum.02380-21. Epub 2022 Jan 12. Microbiol Spectr. 2022. PMID: 35019771 Free PMC article.
-
Enhancing Antifungal Drug Discovery Through Co-Culture with Antarctic Streptomyces albidoflavus Strain CBMAI 1855.Int J Mol Sci. 2024 Nov 27;25(23):12744. doi: 10.3390/ijms252312744. Int J Mol Sci. 2024. PMID: 39684453 Free PMC article.
References
-
- Barraclough TG, Balbi KJ, Ellis RJ. 2012. Evolving concepts of bacterial species. Evol Biol 39:148–157. doi:10.1007/s11692-012-9181-8. - DOI
Publication types
MeSH terms
Substances
LinkOut - more resources
Full Text Sources
Molecular Biology Databases

