. 2019 Mar 6;85(6):e02523-18.
doi: 10.1128/AEM.02523-18. Print 2019 Mar 15.

Resilience and Assemblage of Soil Microbiome in Response to Chemical Contamination Combined with Plant Growth

Affiliations

Resilience and Assemblage of Soil Microbiome in Response to Chemical Contamination Combined with Plant Growth

Shuo Jiao et al. Appl Environ Microbiol. .

Abstract

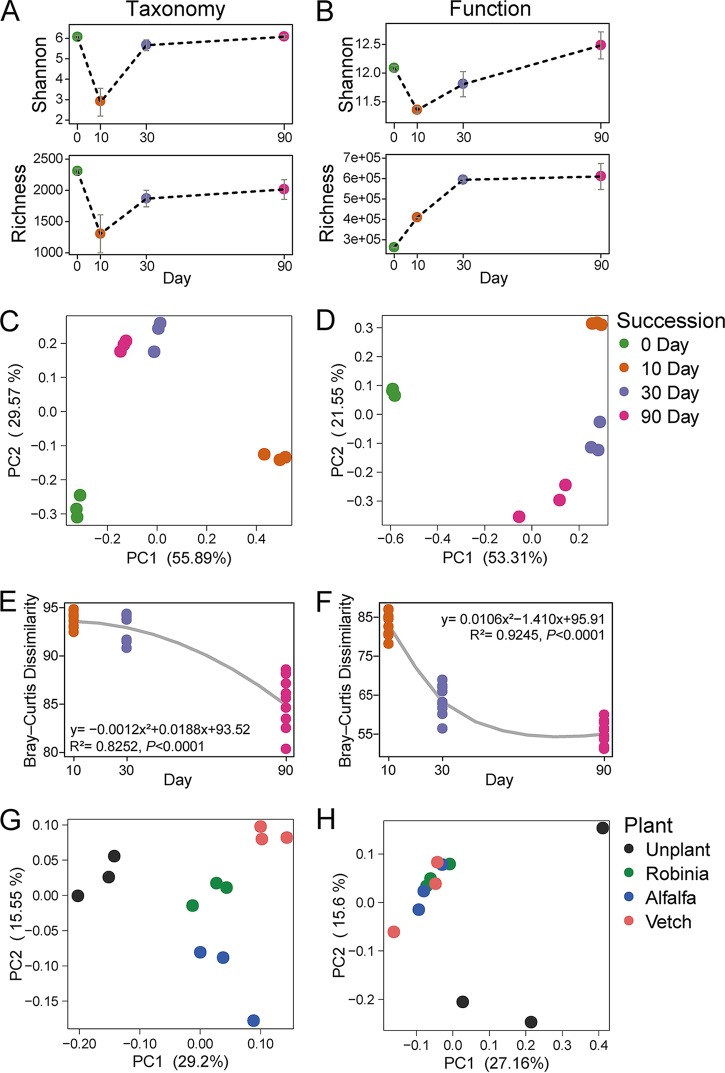
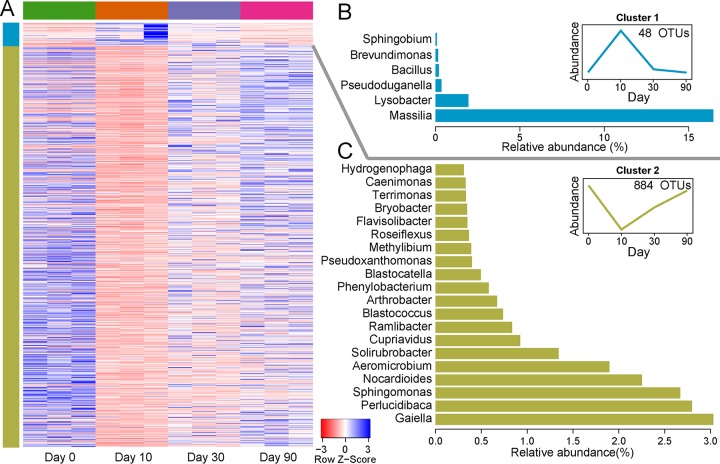
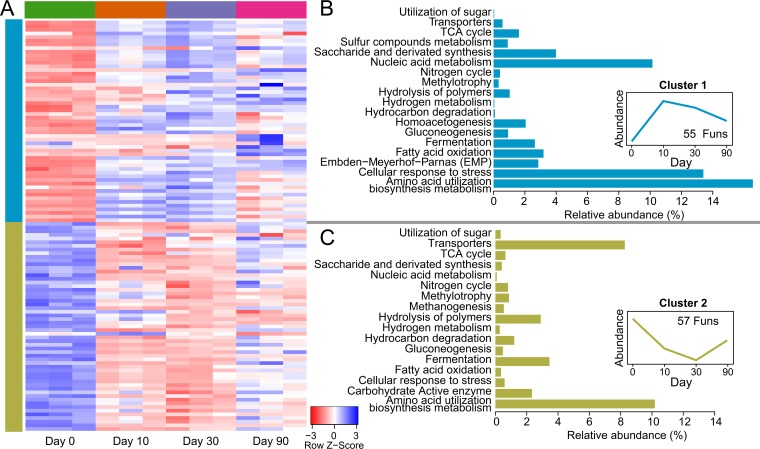
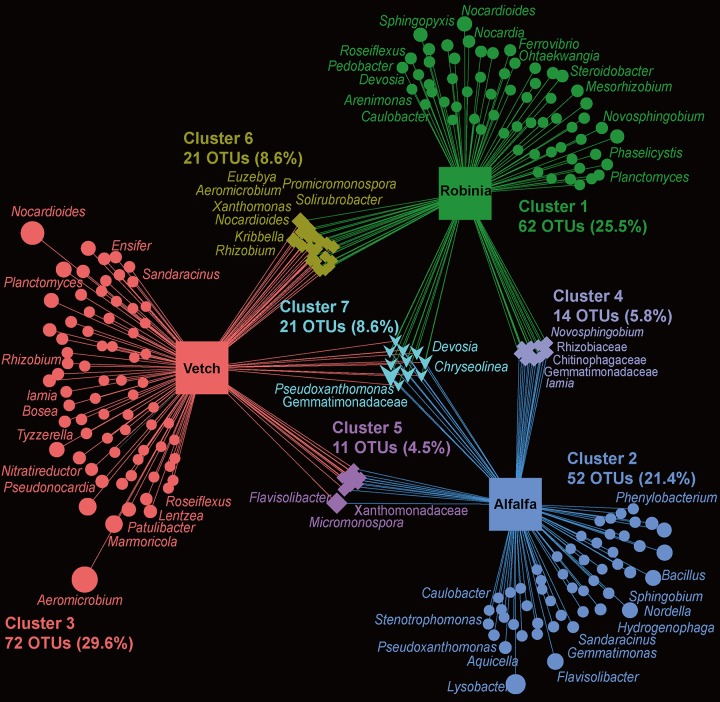
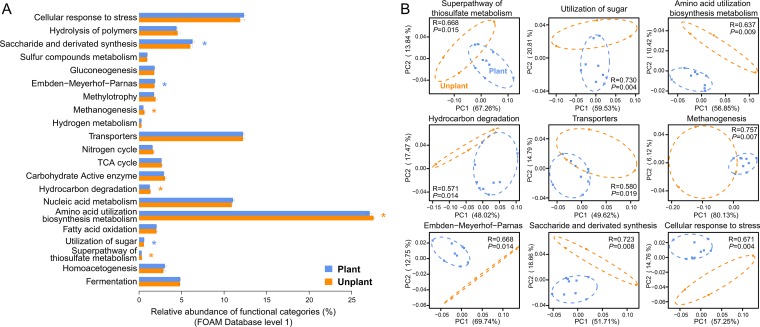
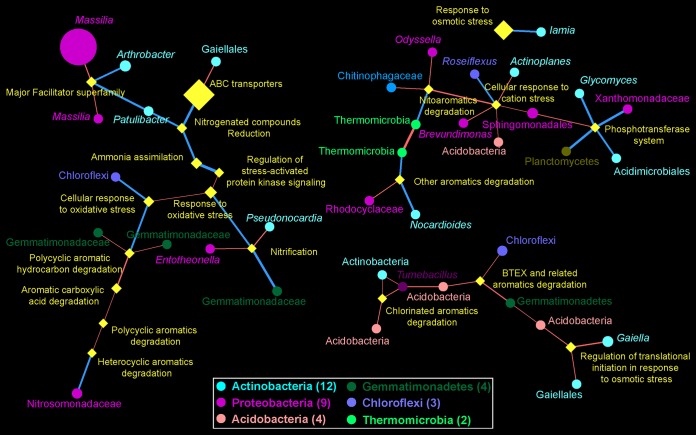
A lack of knowledge of the microbial responses to environmental change at the species and functional levels hinders our ability to understand the intrinsic mechanisms underlying the maintenance of microbial ecosystems. Here, we present results from temporal microcosms that introduced inorganic and organic contaminants into agro-soils for 90 days, with three common legume plants. Temporal dynamics and assemblage of soil microbial communities and functions in response to contamination under the influence of growth of different plants were explored via sequencing of the 16S rRNA amplicon and by shotgun metagenomics. Soil microbial alpha diversity and structure at the taxonomic and functional levels exhibited resilience patterns. Functional profiles showed greater resilience than did taxonomic ones. Different legume plants imposed stronger selection on taxonomic profiles than on functional ones. Network and random forest analyses revealed that the functional potential of soil microbial communities was fostered by various taxonomic groups. Betaproteobacteria were important predictors of key functional traits such as amino acid metabolism, nucleic acid metabolism, and hydrocarbon degradation. Our study reveals the strong resilience of the soil microbiome to chemical contamination and sensitive responses of taxonomic rather than functional profiles to selection processes induced by different legume plants. This is pivotal to develop approaches and policies for the protection of soil microbial diversity and functions in agro-ecosystems with different response strategies from global environmental drivers, such as soil contamination and plant invasion.IMPORTANCE Exploring the microbial responses to environmental disturbances is a central issue in microbial ecology. Understanding the dynamic responses of soil microbial communities to chemical contamination and the microbe-soil-plant interactions is essential for forecasting the long-term changes in soil ecosystems. Nevertheless, few studies have applied multi-omics approaches to assess the microbial responses to soil contamination and the microbe-soil-plant interactions at the taxonomic and functional levels simultaneously. Our study reveals clear succession and resilience patterns of soil microbial diversity and structure in response to chemical contamination. Different legume plants exerted stronger selection processes on taxonomic than on functional profiles in contaminated soils, which could benefit plant growth and fitness as well as foster the potential abilities of hydrocarbon degradation and metal tolerance. These results provide new insight into the resilience and assemblage of soil microbiome in response to environmental disturbances in agro-ecosystems at the species and functional levels.

Keywords: functional reassembly; metagenomics; microbial resilience; plant invasion; response strategy; soil contamination; taxonomic levels.


Figures

FIG 1
FIG 1
General patterns of microbial alpha and beta diversity in response to soil contamination and plant growth. The alpha diversity of richness and Shannon-Wiener index and the beta diversity based on Bray-Curtis distance between the samples were estimated. (A and B) Temporal changes in alpha diversity during incubation with organic and inorganic pollutants (phenanthrene + n-octadecane + cadmium) are shown for the taxonomic (A) and functional (B) traits. (C and D) PCoA of beta diversity among the samples of different incubation time points for the taxonomic (C) and functional (D) traits. (E and F) Dissimilarities of beta diversity between samples of day 0 and other time points for the taxonomic (E) and functional (F) traits, as estimated by the fitted quadratic OLS models. (G and H) PCoA of beta diversity among the samples of different plants grown in soil for the taxonomic (G) and functional (H) traits.
FIG 2
FIG 2
Temporal dynamics of the microbial communities at the species level during incubation under soil contamination. This analysis was performed using the maSigPro method based on operational taxonomic units (OTUs) with an average relative abundance of >0.005%. (A) Temporal dynamic visualization of the significant OTUs was based on a cluster analysis that grouped OTUs with similar profiles and conveyed here in a heatmap. Each row in the heatmap has been standardized (to a mean of zero and a standard deviation of one), with its color intensity proportional to the standardized relative abundances of the taxa. The taxonomic distributions of the significant OTUs were estimated at the genus level for cluster 1 (B) and cluster 2 (C).
FIG 3
FIG 3
Temporal dynamics of the microbial communities at the functional level during incubation under soil contamination. This analysis was conducted using the maSigPro method based on the functional traits of FOAM level 2. (A) Temporal dynamic visualization of the significant OTUs was based on a cluster analysis that grouped OTUs with similar profiles and conveyed here in a heatmap. Each row in the heatmap has been standardized (to a mean of zero and a standard deviation of one), with its color intensity proportional to the standardized relative abundances of the taxa. (B and C) Functional distributions (Funs) of the significant traits were estimated at the FOAM level 1 for cluster 1 (B) and cluster 2 (C). Detailed information on the functional traits of FOAM level 2 is shown in Table S1.
FIG 4
FIG 4
The bipartite association network depicting the associations between the significantly enriched OTUs and the different plant species treatments (estimated via linear statistics in the “limma” package for R). Node sizes represent the relative abundance levels of the OTUs. Edges represent the association patterns of individual OTUs with different plant treatments. Circle-shaped nodes represent those OTUs only associated with one treatment. Diamond-shaped nodes represent the OTUs associated with two treatments. Triangle-shaped nodes represent the cross-combination OTUs associated with all three treatments. The number of OTUs and relative abundance levels are provided for each cluster (1 to 6), as are the taxonomic distributions of the dominant OTUs per cluster.
FIG 5
FIG 5
Effects of plant growth on the soil microbial community functional profile. (A) Relative abundance of the functional traits (FOAM database level 1) between samples with and without plants growing in the soil. The error bars show standard errors. Blue asterisks (*) indicate those categories significantly more abundant in samples with plant growth (P < 0.05, Wilcoxon rank-sum test) and orange asterisks (*) indicate the categories that were significantly more abundant in samples without plant growth. (B) PCoA plots of the functional genes classified into particular categories of FOAM database level 1. Similarity values between the samples with and without plant growth were examined via the ANOSIM test, which are shown in each plot. Only significant categories are displayed. The dashed ellipses in blue and orange represent the clustering of samples with and without plant growth, respectively.
FIG 6
FIG 6
Disentangling the potential associations between the soil microbial taxa and functional traits via a network analysis. This analysis was based on the SpiecEasi method. Functional traits were selected as a functional subset (FOAM level 2) of the cellular response to stress, hydrocarbon degradation, transporters, and nitrogen cycle. Microbial taxa were the OTUs with a relative abundance of >0.05%. Yellow nodes represent functional traits; other nodes were colored according to phylum. The size of each node is proportional to relative abundance. The taxonomic distributions of these OTUs are also given. BTEX, benzene, toluene, ethylbenzene, and xylene.

Similar articles

Cited by

References

    1. Shade A, Peter H, Allison SD, Baho DL, Berga M, Burgmann H, Huber DH, Langenheder S, Lennon JT, Martiny JBH, Matulich KL, Schmidt TM, Handelsman J. 2012. Fundamentals of microbial community resistance and resilience. Front Microbiol 3:417. - PMC - PubMed
    1. Trenberth KE, Dai AG, van der Schrier G, Jones PD, Barichivich J, Briffa KR, Sheffield J. 2014. Global warming and changes in drought. Nat Clim Chang 4:17–22. doi:10.1038/nclimate2067. - DOI
    1. Callaway RM, Bedmar EJ, Reinhart KO, Silvan CG, Klironomos J. 2011. Effects of soil biota from different ranges on Robinia invasion: acquiring mutualists and escaping pathogens. Ecology 92:1027–1035. - PubMed
    1. Liang Y, Zhao H, Deng Y, Zhou J, Li G, Sun B. 2016. Long-term oil contamination alters the molecular ecological networks of soil microbial functional genes. Front Microbiol 7:60. doi:10.3389/fmicb.2016.00060. - DOI - PMC - PubMed
    1. Jiao S, Chen W, Wang J, Zhang L, Yang F, Lin Y, Wei G. 2018. Plant growth and oil contamination alter the diversity and composition of bacterial communities in agricultural soils across China. Land Degrad Dev 29:1660–1671. doi:10.1002/ldr.2932. - DOI

Publication types

LinkOut - more resources