. 2019 Mar;29(3):494-505.
doi: 10.1101/gr.233866.117. Epub 2019 Jan 18.

Large-scale discovery of mouse transgenic integration sites reveals frequent structural variation and insertional mutagenesis

Affiliations

Large-scale discovery of mouse transgenic integration sites reveals frequent structural variation and insertional mutagenesis

Leslie O Goodwin et al. Genome Res. 2019 Mar.

Abstract

Transgenesis has been a mainstay of mouse genetics for over 30 yr, providing numerous models of human disease and critical genetic tools in widespread use today. Generated through the random integration of DNA fragments into the host genome, transgenesis can lead to insertional mutagenesis if a coding gene or an essential element is disrupted, and there is evidence that larger scale structural variation can accompany the integration. The insertion sites of only a tiny fraction of the thousands of transgenic lines in existence have been discovered and reported, due in part to limitations in the discovery tools. Targeted locus amplification (TLA) provides a robust and efficient means to identify both the insertion site and content of transgenes through deep sequencing of genomic loci linked to specific known transgene cassettes. Here, we report the first large-scale analysis of transgene insertion sites from 40 highly used transgenic mouse lines. We show that the transgenes disrupt the coding sequence of endogenous genes in half of the lines, frequently involving large deletions and/or structural variations at the insertion site. Furthermore, we identify a number of unexpected sequences in some of the transgenes, including undocumented cassettes and contaminating DNA fragments. We demonstrate that these transgene insertions can have phenotypic consequences, which could confound certain experiments, emphasizing the need for careful attention to control strategies. Together, these data show that transgenic alleles display a high rate of potentially confounding genetic events and highlight the need for careful characterization of each line to assure interpretable and reproducible experiments.


Figures

Figure 1.
Figure 1.
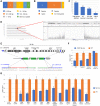
Discovery of the integration loci for 40 transgenic mouse lines. (A) Distribution of the categories of transgenes included in this study. (B) Distribution of transgenes by molecular type. (C) Ideogram showing the physical distribution of transgene insertion sites identified by TLA. (D) Types of genetic alterations that accompany transgene insertions. (E) Proportion of insertion sites that occur in genes (exon or intron) or nongene loci (intergenic).
Figure 2.
Figure 2.
Deletions accompanying transgenic insertions. (A) Profile of sizes of deletions identified at integration loci. (B) For integrations that occur in genes, the profile of the number of genes affected by the insertion event. (C) Illustration of the potential impact of transgene insertions into genes, including the number of genes with reported knockout (KO) alleles, the number of KO alleles with a reported phenotype, and number of genes shown to be essential for life. (D) Genome-wide and zoomed Chr 13 view of TLA reads mapped to the mouse genome. (E) Schematic of the insertion locus in the Tek-cre [Tg(Tek-cre)12Flv] line. Blue bars indicate the 5′ and 3′ limits of the deleted region, with the relative orientation of transgene copies adjacent to the breakpoint as determined from sequence-confirmed fusion fragments. Locations of qPCR probes to confirm copy number are shown. (F) Results of LOA qPCR assays showing the expected loss of one copy of Mtrr and Fastkd3 and exon 15 of Adcy2, which lie within the deletion. Adcy2 exon 14, which lies outside of the deletion, has the expected two copies. WT copy number is arbitrarily set at 1, thus a value of 0.5 would indicate loss of one copy. (G) LOA assays for 13 other genes/loci deletions identified in this study. Strains are indicated by Stock # above the gene symbol for each test. For strains 4191 and 4631, the complete loss of Immp2l and Cdh18, respectively, is consistent with the homozygous maintenance of these lines.
Figure 3.
Figure 3.
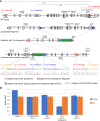
Complex structural variations (SVs) accompanying transgenic insertions. (A) Schematic of the SV accompanying the Wnt1-cre2 [Tg(Wnt1-cre)2Sor] transgene insertion. The locus includes a large duplication with a partial deletion that accompanies the transgene insertion. The entire duplicated interval is inverted and is inserted into exon 5 of the E2f1 gene. The red triangles identify the extent of the entire SV that is inverted, the blue bars indicate the insertion site of the transgene and the extent of the deletion within the duplicated fragment, and the orange bars indicate the location of the SV insertion. qPCR probes are indicated on the WT locus. The qPCR probe for E2f1 exon 5 spans the breakpoint of SV insertion. Confirmation of each fusion fragment that defines the SV by PCR-Sanger sequence is illustrated. (B) LOA confirmation of the expected copy number for each gene/exon affected by the SV.
Figure 4.
Figure 4.
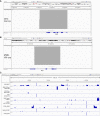
TLA reveals additional passenger cassettes and fragments in transgenes. (A,B) View of TLA reads (indicated in gray above the gene model) that map to the human growth hormone (GH1, also known as hGH) and the mouse metallothionein (Mt1) gene for two transgenes (Ins2-cre and Vil-cre, respectively), showing the inclusion of the entire gene structure, including coding exons. (C) Reads for nine transgenes mapped to the Escherichia coli genome indicating a variable level of coinsertion into the transgene integration site. Deep coverage for discrete loci shared between multiple lines indicates sequences that are part of the transgene vector. The amount of E. coli cointegration ranges from a few hundred bp to more than 200 kb. Short names for each transgene are used for readability and are defined in Supplemental Table S1.
Figure 5.
Figure 5.
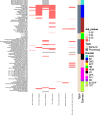
Physiology and behavioral testing of the cre transgenic lines in the KOMP pipeline. Mice were tested in 12 phenotypic domains spanning behavior and physiology (color-coded, right bar). Each test is further grouped broadly into behavior (peach) or physiology (gray) domains. Significant differences from controls are shown in the heatmap (FDR-corrected P-values). Individual output parameters are listed and color-coded on the left y-axis. Tests with no data are shown in gray. (ABR) Auditory brainstem response; (HB) hole board; (LD) light/dark transition; (OFA) open field assay; (PPI) pre-pulse inhibition; (RR) rotarod; (SLEEP) piezoelectric sleep/wake; (TST) tail suspension test; (BC) body composition; (CBC) clinical biochemistry; (ECT) electroconvulsive seizure threshold; (HEM) hematology. Homozygous transgenic lines: Alb-cre [B6.Cg-Tg(Alb-cre)21Mgn/J], Ins2-cre [B6.Cg-Tg(Ins2-cre)25Mgn/J], Lck-cre [B6.Cg-Tg(Lck-cre)548Jxm/J]. Hemizygous transgenic lines: Nes-cre [B6.Cg-Tg(Nes-cre)1Kln/J], Vav1-cre [B6.Cg-Tg(Vav1-icre)A2Kio/J], Vil1-cre [B6.Cg-Tg(Vil1-cre)997Gum/J], Wnt1-cre [B6.Cg-Tg(Wnt1-cre)11Rth Tg(Wnt1-GAL4)11Rth/J].

References

    1. Bersell K, Choudhury S, Mollova M, Polizzotti BD, Ganapathy B, Walsh S, Wadugu B, Arab S, Kuhn B. 2013. Moderate and high amounts of tamoxifen in αMHC-MerCreMer mice induce a DNA damage response, leading to heart failure and death. Dis Model Mech 6: 1459–1469. 10.1242/dmm.010447 - DOI - PMC - PubMed
    1. Cain-Hom C, Splinter E, van Min M, Simonis M, van de Heijning M, Martinez M, Asghari V, Cox JC, Warming S. 2017. Efficient mapping of transgene integration sites and local structural changes in Cre transgenic mice using targeted locus amplification. Nucleic Acids Res 45: e62 10.1093/nar/gkw1329 - DOI - PMC - PubMed
    1. Chen ZY, He CY, Meuse L, Kay MA. 2004. Silencing of episomal transgene expression by plasmid bacterial DNA elements in vivo. Gene Ther 11: 856–864. 10.1038/sj.gt.3302231 - DOI - PubMed
    1. de Angelis MH, Nicholson G, Selloum M, White J, Morgan H, Ramirez-Solis R, Sorg T, Wells S, Fuchs H, Fray M, et al. 2015. Analysis of mammalian gene function through broad-based phenotypic screens across a consortium of mouse clinics. Nat Genet 47: 969–978. 10.1038/ng.3360 - DOI - PMC - PubMed
    1. de Vree PJ, de Wit E, Yilmaz M, van de Heijning M, Klous P, Verstegen MJ, Wan Y, Teunissen H, Krijger PH, Geeven G, et al. 2014. Targeted sequencing by proximity ligation for comprehensive variant detection and local haplotyping. Nat Biotechnol 32: 1019–1025. 10.1038/nbt.2959 - DOI - PubMed

Publication types