. 2019 Mar 15;79(6):1069-1084.
doi: 10.1158/0008-5472.CAN-18-2505. Epub 2019 Jan 18.

Mitochondrial miRNA Determines Chemoresistance by Reprogramming Metabolism and Regulating Mitochondrial Transcription

Affiliations

Mitochondrial miRNA Determines Chemoresistance by Reprogramming Metabolism and Regulating Mitochondrial Transcription

Song Fan et al. Cancer Res. .

Abstract

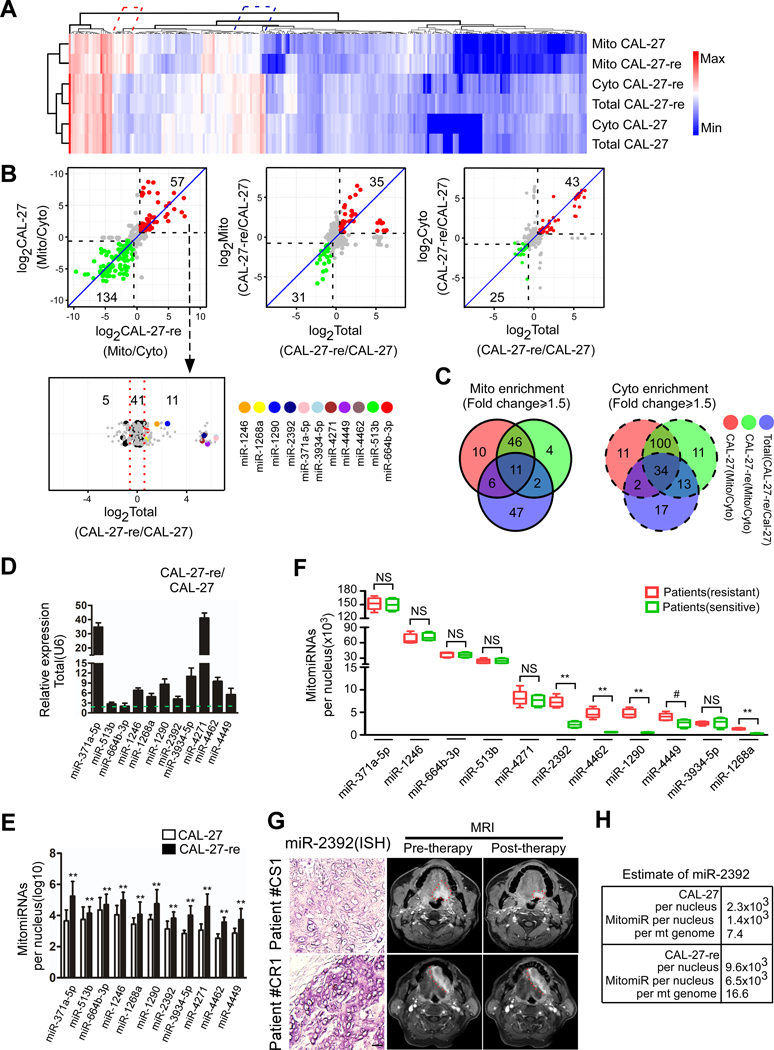
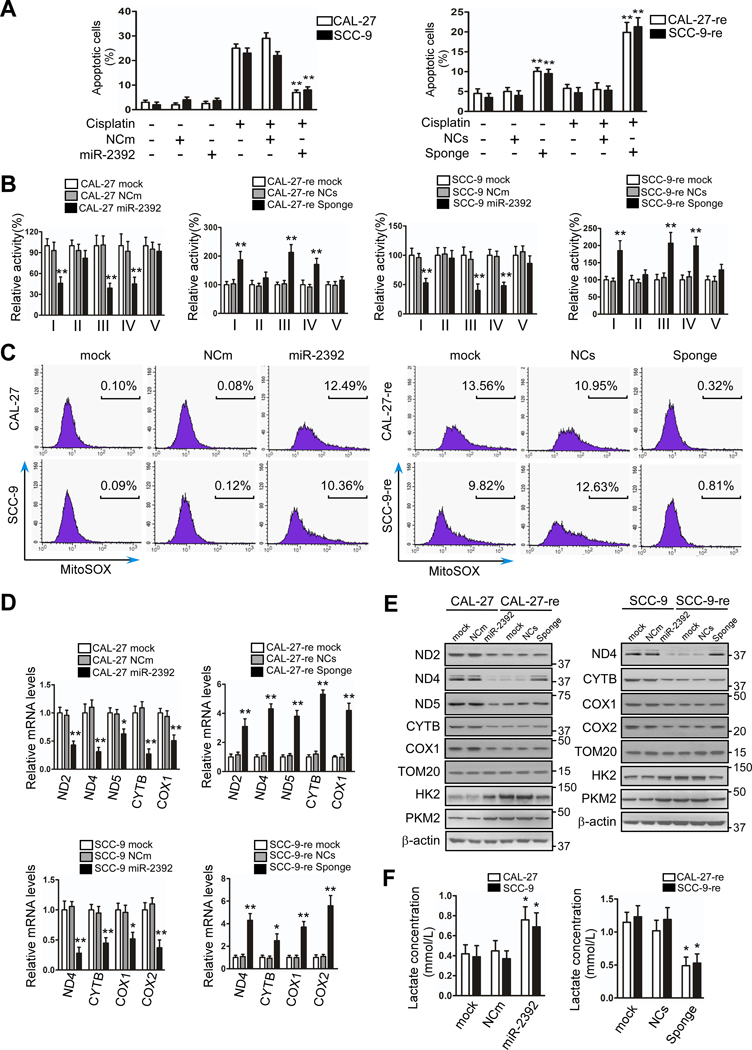
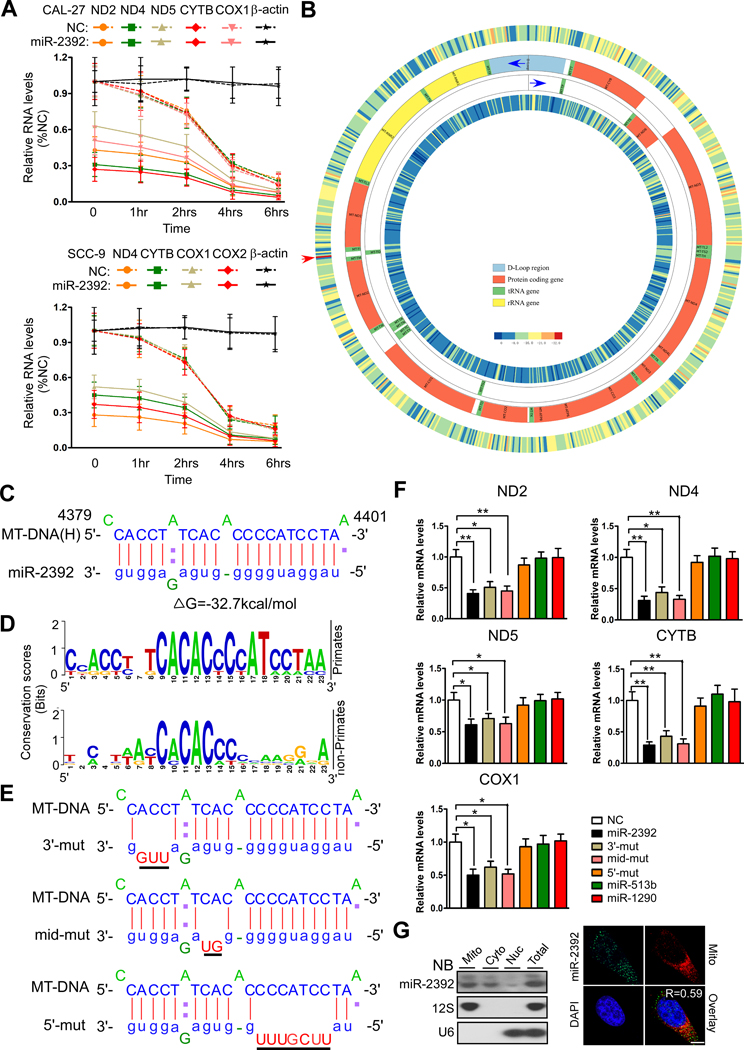
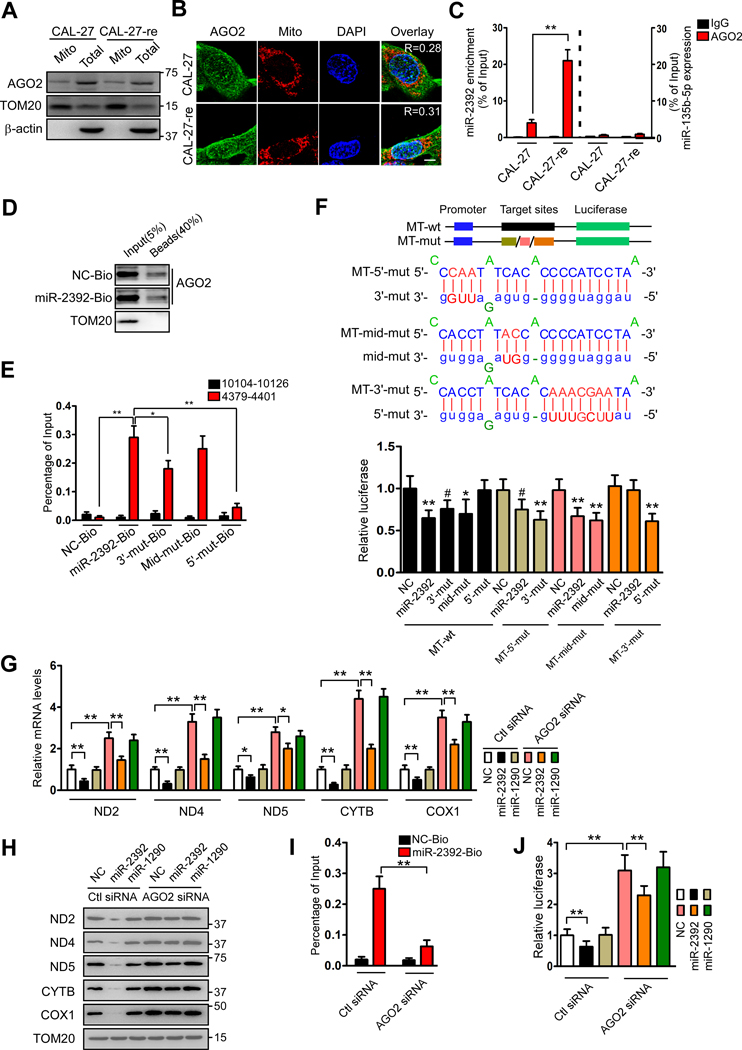
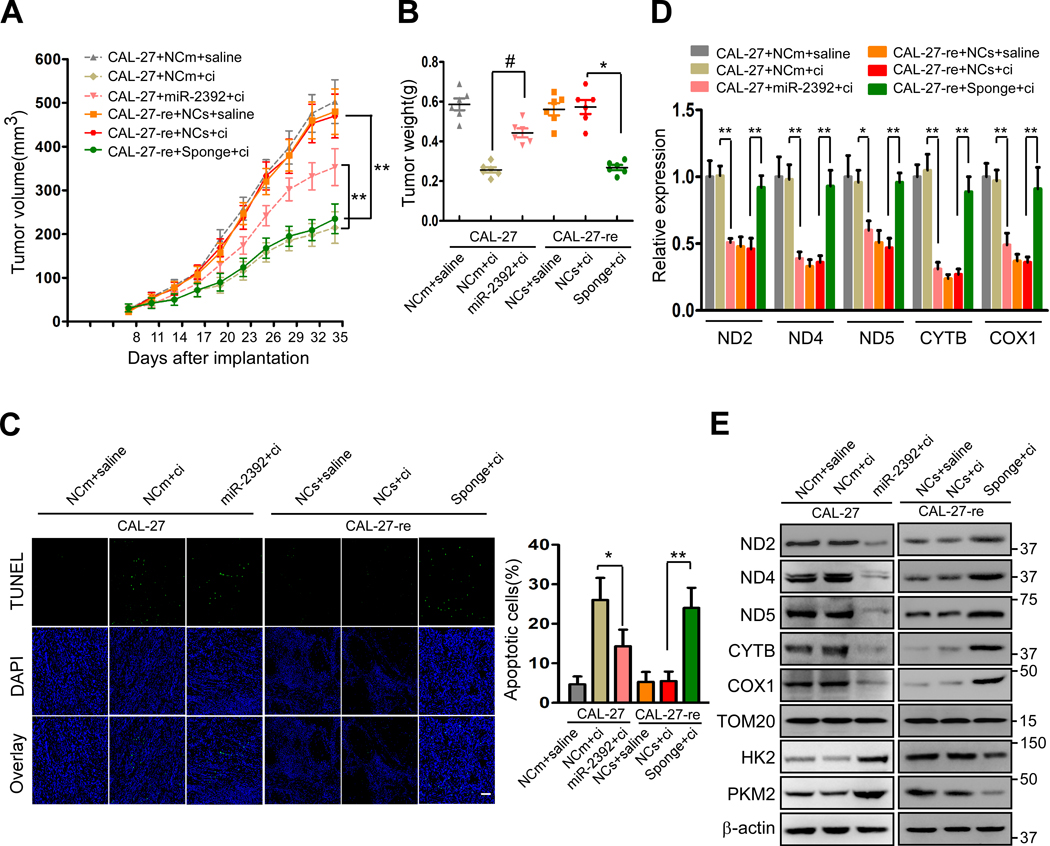
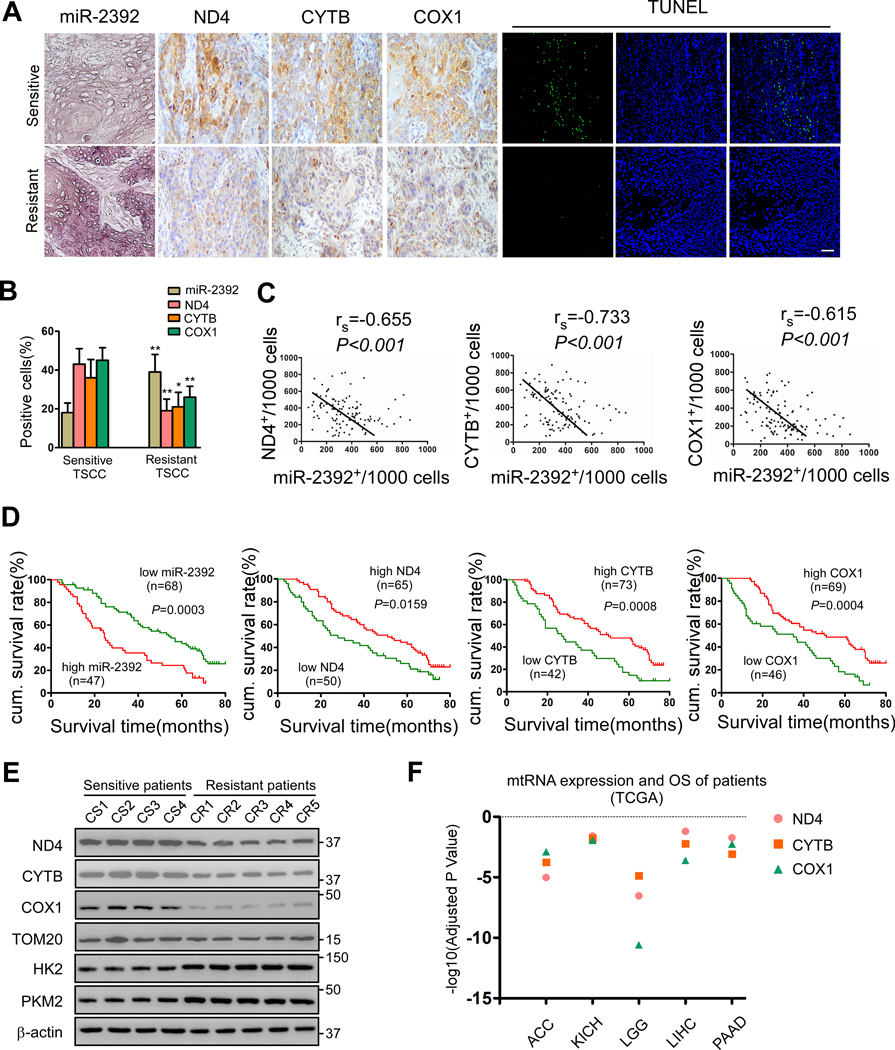
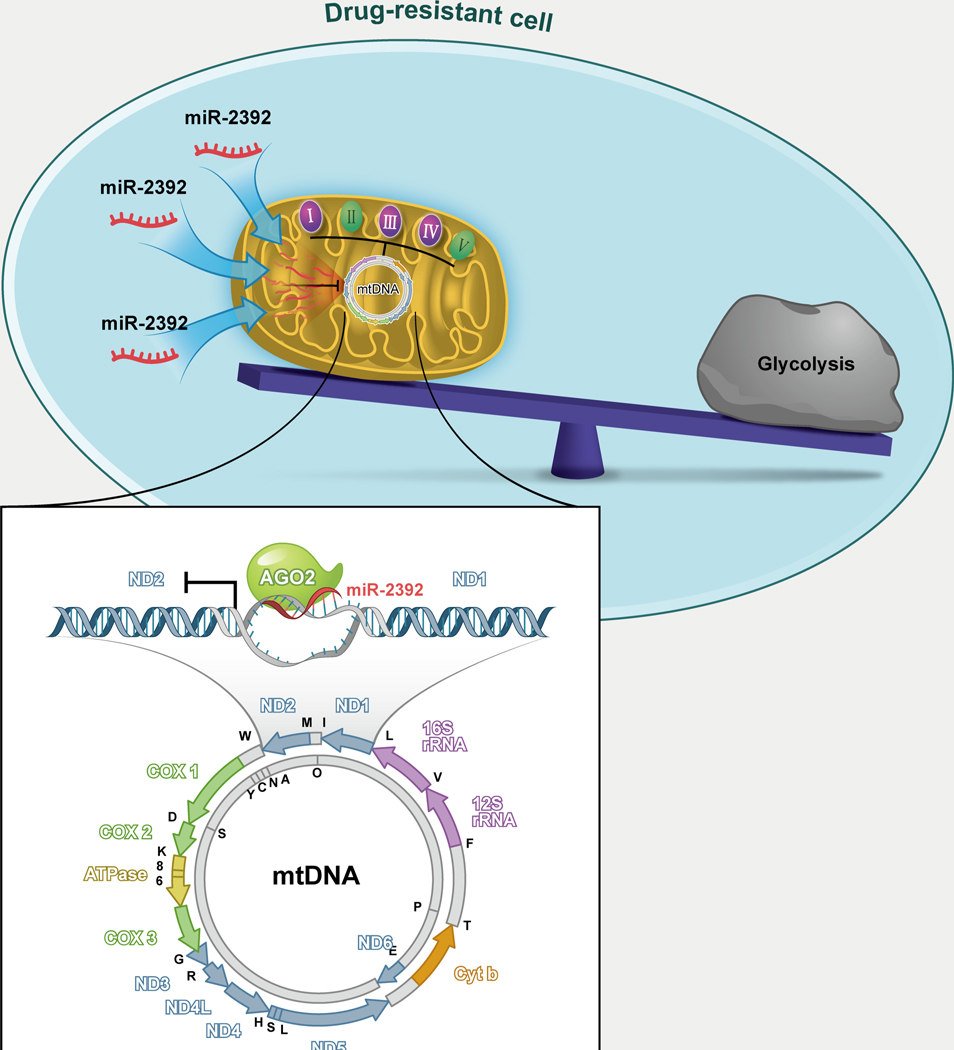
miRNAs that translocate from the nucleus to mitochondria are referred to as mitochondrial microRNAs (mitomiR). mitomiRs have been shown to modulate the translational activity of the mitochondrial genome, yet their role in mitochondrial DNA (mtDNA) transcription remains to be determined. Here we report that the mitomiR-2392 regulates chemoresistance in tongue squamous cell carcinoma (TSCC) cells by reprogramming metabolism via downregulation of oxidative phosphorylation and upregulation of glycolysis. These effects were mediated through partial inhibition of mtDNA transcription by mitomiR-2392 rather than through translational regulation. This repression required specific miRNA-mtDNA base pairing and Argonaute 2. mitomiR-2392 recognized target sequences in the H-strand and partially inhibited polycistronic mtDNA transcription in a cell-specific manner. A retrospective analysis of TSCC patient tumors revealed a significant association of miR-2392 and regulated mitochondrial gene expression with chemosensitivity and overall survival. The clinical relevance of targeted mitochondrial genes was consistently validated by The Cancer Genome Atlas RNA sequencing in multiple types of cancer. Our study revealed for the first time the role of mitomiR in mtDNA transcription and its contribution to the molecular basis of tumor cell metabolism and chemoresistance.Significance: These findings uncover a novel mechanism by which mitomiRNA regulates mitochondrial transcription and provide rationale for use of mitomiRNA and mtDNA-encoded genes to predict chemosensitivity and patient clinical prognosis.


Conflict of interest statement

Disclosure of Potential Conflicts of Interest: No potential conflicts of interest were disclosed.

Figures

Figure 1.
Figure 1.. mitomiR expression in TSCC cisplatin-resistant cells and their parental lines.
(A). Hierarchical clustering of relative miRNA expression in the mitochondrial fraction (Mito), cytoplasmic fraction (Cyto), and total cell homogenate (Total) of CAL27 and CAL-27-re cells. miRNA expression log2-fold change over blue to red color gradation is based on the ranking of each condition from minimum (blue) to maximum (red). A total of 263 miRNA genes are depicted. Red cluster indicates significantly upregulated miRNAs in the mitochondria; Blue indicates significantly downregulated miRNAs in the mitochondria. (B). Log2-fold relative miRNA probe distribution showing differential miRNA expression from Mito/Cyto (upper left panel), Mito (upper middle panel) or Cyto (upper right panel) compared with Total miRNA in CAL-27 and CAL-27-re cells. Genes in the right upper quadrant exhibited upregulated expression and in the left lower quadrant exhibited downregulated expression. In CAL-27-re cells compared with CAL-27 cells, eleven mitomiRs were upregulated, and five mitomiRs were downregulated, while 41 mitomiRs showed no differences (lower panel). (fold change≥1.5). Mito, mitochondrial; Cyto, cytoplasmic. (C). Venn diagrams depicting overlapping miRNAs that are enriched in mitochondria and upregulated in CAL-27-re cells (left panel) and cytoplasmic enriched miRNAs upregulated in CAL-27-re cells (right panel) (fold change≥1.5). (D). qRT-PCR results showing that 11 mitomiRs were up regulated in CAL-27-re cells compared with their levels in CAL-27 cells; U6 served as the internal control for the total RNA analysis. (E). Quantification of 11 mitomiRs per CAL-27 and CAL27-re nucleus. (F). Quantification of 11 mitomiRs per nucleus of primary cultured cells from chemosensitive and chemoresistant patients. (G). Representative images of miR-2392 expression (left panels) of tissue specimens and tumor response (right panels) in patients with chemosensitive(CS) and chemoresistant(CR) tumors. Bar=20 μm. (H). Quantification of miR-2392 per CAL-27 and CAL-27-re nucleus or per mitochondrial genome. NS, no significance, #P<0.05, **P<0.001, 2-tailed Students t tests.
Figure 2.
Figure 2.. mitomiR-2392 regulates cisplatin resistance and metabolism reprogramming.
(A) Flow cytometry analysis showing that CAL-27 or SCC-9 cells transfected with miR-2392 mimic resist cisplatin-induced apoptosis, while CAL-27-re or SCC-9-re cells with stable expression of a miR-2392 sponge were sensitive to cisplatin-induced apoptosis. (B) The activity of mitochondrial respiratory chain complex Ⅰ, Ⅲ, and Ⅳ was significantly downregulated in CAL-27 and SCC-9 cells by transfection with miR-2392 mimic. Meanwhile, the activity of mitochondrial respiratory chain complex Ⅰ, Ⅲ, and Ⅳ subunits was restored in CAL-27-re and SCC9-re cells with stable expression of a miR-2392 sponge. (C) Transfection of CAL-27 and SCC-9 cells with miR-2392 mimic enhanced ROS production, while ROS production was relieved by stable expression of a miR-2392 sponge in CAL-27-re and SCC-9-re cells. (D) Transfection with a miR-2392 mimic reduced ND2, ND4, ND5, CYTB, and COX1 mRNA expression in CAL-27 cells and ND4, CYTB, COX1, and COX2 in SCC-9 cells, but the ND2, ND4, ND5, CYTB, and COX1 mRNA levels in CAL-27-re cells and the ND4, CYTB, COX1, and COX2 levels in SCC-9-re cells were upregulated by stable expression of a miR-2392 sponge. (E) The expression levels of the proteins encoded by the genes mentioned in panel D were further confirmed by western blotting. HK2 and PKM2 were upregulated in CAL-27 and SCC-9 cells upon transfection with the miR-2392 mimic but were downregulated in CAL-27-re and SCC-9-re cells stably expressing the miR-2392 sponge. (F) Lactate production was enhanced in CAL-27 and SCC-9 cells by transfection with miR2392 mimic but was downregulated in CAL-27-re and SCC-9-re cells with stable expression of a miR-2392 sponge. NCm, negative control for miR-2392 mimic; NCs, negative control for miR-2392 sponge. *P<0.01, **P<0.001, 1-way ANOVA followed by Dunnett’s tests for multiple comparisons.
Figure 3.
Figure 3.. mitomiR-2392 partially regulates mitochondrial gene transcription.
(A). Real-time PCR following transcription inhibition by actinomycin-D treatment in CAL27 and SCC-9 cells transfected with miR-2392 mimics or its negative control. The ratio of individual MT-mRNA in group with transfection of mimics to that transfected with negative control was calculated at each time point. The percentage of RNA change with respect to time zero is also shown. (B) Circos plot showing the free energy and binding sites between miR-2392 and the mitochondrial genome. The outer track shows the H strand, while the inner track shows the L strand. The red arrow indicates the most likely binding sites at 4379 to 4401 of mtDNA. (C) RNAhybrid analysis showing the alignment of miR-2392 with the mtDNA H strand, overlapping at 4379 to 4401. (D) WebLogo analysis revealed that the targeted region of the H strand is highly conserved in 6 primates. (E) Alignment of mutant miR-2392 mimic with overlapping of the H strand of mtDNA (mismatched bases underlined). (F) ND2, ND4, ND5, CYTB and COX1 mRNA expression affected by miR-2392 mimic and mutant miR-2392 mimic(3’mut and Mid-mut) in CAL-27 cells. Mitochondrial miR-513b and miR-1290 without an optimal binding site within mtDNA were selected as the controls. (G) Northern blotting results demonstrating intramitochondrial localization of miR-2392; 12S rRNA served as the mitochondrial internal control and U6 as the internal control for total RNA analysis(left panel). Fluorescence in situ hybridization (FISH) indicated that miR-2392 mainly overlaid with the mitochondria in CAL-27 cells(right panel). Co-localization coefficient(R) equals 0.59. The scale bar equals 3 μm. *P<0.01, **P<0.001, 1-way ANOVA followed by Dunnett’s tests for multiple comparisons.
Figure 4.
Figure 4.. mitomiR-2392 regulates mitochondrial gene transcription associated with AGO2.
(A) Western blotting shows the presence of AGO2 in the mitochondria. (B) Immunofluorescence staining indicates that a portion of AGO2 overlaid with mitochondria. The scale bar equals 3 μm. R equals 0.28 and 0.31 in CAL-27 and CAL27-re cells, respectively. (C) RNA immunoprecipitation (RIP) demonstrated that miR2392 but not miR-135b-5p was co-immunoprecipitated with AGO2 in mitochondria, and more miR-2392 was co-immunoprecipitated from mitochondria of CAL-27-re cells. (D) AGO2 coimmunoprecipitated with biotin-labeled miR-2392 and its negative control in mitochondria of CAL-27 cells. Five percent input and 40% magnetic beads were analyzed by western blot. (E) qPCR was performed to detect enrichment of miR-2392 in the specific regulatory region (4379–4401) of mtDNA, while mutation of miR-2392 decreased the occupancy of this region in CAL-27 cells. (F) miR-2392 and its mutants(3’mut and Mid-mut) but not 5’mut repressed the reporter containing miR-2392 target sites. The mutant miR-2392 target sites in the reporter weaken the effect, which could be restored with the corresponding mutant miR-2392 that reestablished the required base-pairing interactions. (G and H) AGO2 knockdown attenuated the inhibition of miR-2392 on its targeted mitochondrial genes expression in CAL-27 cells. G showing mRNA expression and H showing the change of protein levels. Cells were transfected with AGO2 siRNA, along with miR-2392 mimic. (I) AGO2 knockdown decreased the enrichment of miR-2392 in the specific regulatory region (4379–4401) of mtDNA in CAL-27 cells. (J) AGO2 knockdown increased the corresponding luciferase reporters in CAL-27 cells. (C, F and I) #P<0.01, *P<0.01, **P<0.001, 2-tailed Students t tests; (E, G and J) *P<0.01, **P<0.001, 1-way ANOVA followed by Dunnett’s tests for multiple comparisons.
Figure 5.
Figure 5.. miR-2392 regulates tumor growth in CAL-27 and CAL-27-re cells xenografts in BALB/c-nu mice under cisplatin treatment.
(A) Growth curves for CAL-27 and CAL-27-re tumors treated with saline or cisplatin. BALB/c-nu mice bearing CAL-27 cells with stable expression of miR-2392 or its control (NCm) while CAL-27-re cells with stable expression of miR-2392 sponge or its control (NCs) (n=6 for each group). (B) Tumor weights in each group. (C) Apoptosis was detected via a TUNEL assay. For the TUNEL assay, n=24 slices from 6 xenograft tumors were sampled per group. Bar=20 μm. (D) qRT-PCR detection of ND2, ND4, ND5, CYTB and COX1 mRNA expression per group. (E) Western blotting showed that ND2, ND4, ND5, CYTB, and COX1 were reduced in the stable miR-2392 expression group, while HK2 and PKM2 were upregulated. miR-2392 sponge in CAL-27-re calls had a reverse effect. (A)**P<0.001, 2-way ANOVA followed by Bonferroni’s post-test; (B, D and C) #P<0.05, *P<0.01, **P<0.001, 2-tailed Student’s t tests.
Figure 6.
Figure 6.. Expression of miR-2392, ND4, CYTB and COX1 is correlated with chemosensitivity and TSCC patient survival.
(A) miR-2392, ND4, CYTB and COX1 expression and cell apoptosis were demonstrated in chemosensitive versus resistant TSCC tumors. Left panel: miR-2392 expression was analyzed using in situ hybridization (×200); ND4, CYTB and COX1 expression were analyzed via immunohistochemistry. Apoptosis was detected using a TUNEL assay. Bar=20 μm. (B) Quantification of miR-2392, ND4, CYTB and COX1 expression in chemosensitive versus resistant TSCC tumors. (C) Associations between miR-2392 and ND4, CYTB or COX1 expression in TSCC were analyzed via Spearman order correlation. (D) Kaplan-Meier survival curves for TSCC patients are plotted for miR-2392, ND4, CYTB and COX1 expression, and survival differences were analyzed using a log-rank test. (E) Western blotting showed that ND4, CYTB, and COX1 expression were reduced in primary cultured cells from chemoresistant patients, while HK2 and PKM2 were upregulated. (F) Association of mtRNA expression levels with overall survival in multiple types of human cancer based on TCGA RNA sequencing data. (ACC, adrenocortical carcinoma; KICH, kidney chromophobe; LGG, low grade glioma; LIHC, liver hepatocellular carcinoma; PAAD, pancreatic adenocarcinoma). **P<0.001, *P<0.01, 2-tailed Student’s t tests.
Figure 7.
Figure 7.
Model of how mitomiR miR-2392 determines chemoresistance and metabolic reprogramming by partially regulating transcription of the mitochondrial genome.

Similar articles

Cited by

References

    1. Kroemer G, Pouyssegur J. Tumor cell metabolism: cancer’s Achilles’ heel. Cancer Cell. 2008;13:472–82. - PubMed
    1. Gatenby RA, Gillies RJ. Why do cancers have high aerobic glycolysis? Nat Rev Cancer. 2004;4:891–9. - PubMed
    1. Rodriguez-Enriquez S, Carreno-Fuentes L, Gallardo-Perez JC, Saavedra E, Quezada H, Vega A, et al. Oxidative phosphorylation is impaired by prolonged hypoxia in breast and possibly in cervix carcinoma. Int J Biochem Cell Biol. 2010;42:1744–51. - PubMed
    1. Ma WW, Jacene H, Song D, Vilardell F, Messersmith WA, Laheru D, et al. [18F]fluorodeoxyglucose positron emission tomography correlates with Akt pathway activity but is not predictive of clinical outcome during mTOR inhibitor therapy. J Clin Oncol. 2009;27:2697–704. - PMC - PubMed
    1. Leung EY, Kim JE, Askarian-Amiri M, Joseph WR, McKeage MJ, Baguley BC. Hormone Resistance in Two MCF-7 Breast Cancer Cell Lines is Associated with Reduced mTOR Signaling, Decreased Glycolysis, and Increased Sensitivity to Cytotoxic Drugs. Front Oncol. 2014;4:221. - PMC - PubMed

Publication types

MeSH terms