. 2019 Mar;7(3):476-486.
doi: 10.1158/2326-6066.CIR-18-0182. Epub 2019 Jan 18.

Endoplasmic Reticulum Stress Contributes to Mitochondrial Exhaustion of CD8+ T Cells

Affiliations

Endoplasmic Reticulum Stress Contributes to Mitochondrial Exhaustion of CD8+ T Cells

Katie E Hurst et al. Cancer Immunol Res. 2019 Mar.

Abstract

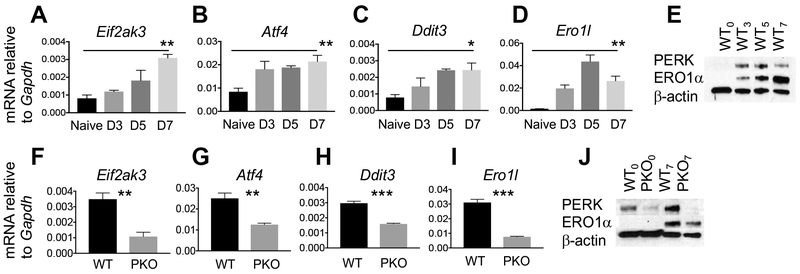
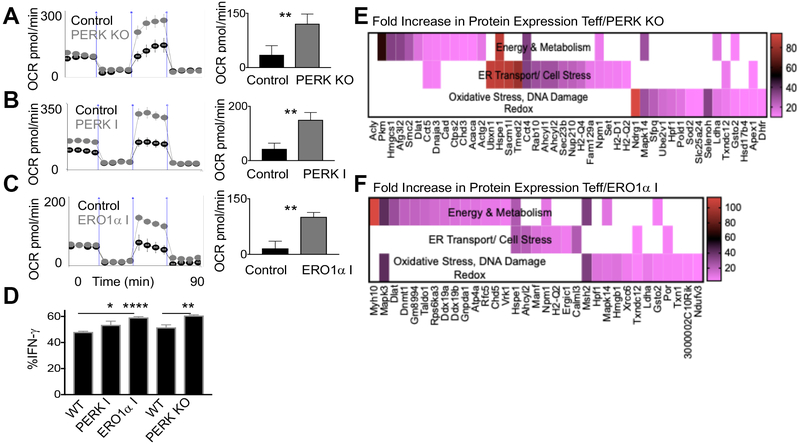
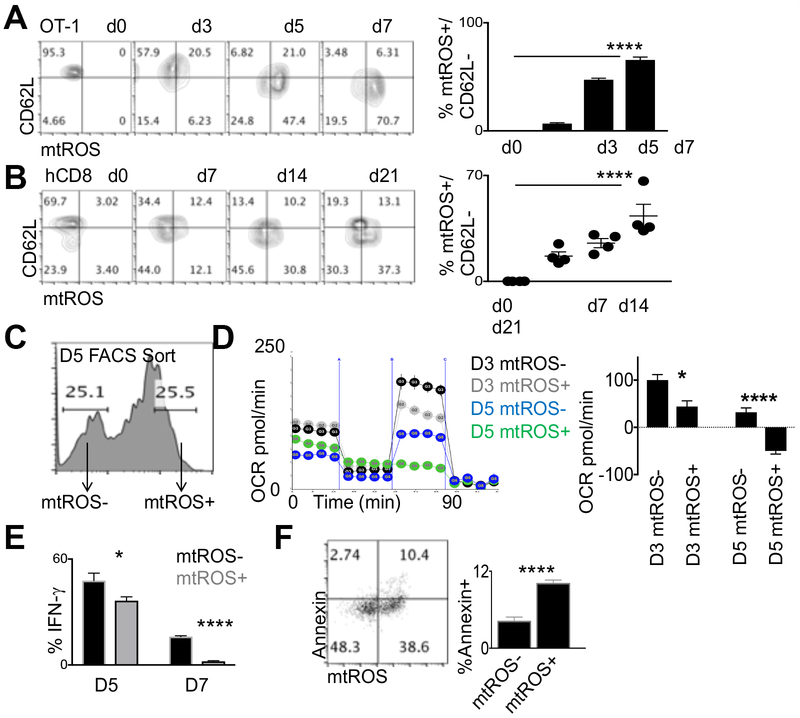
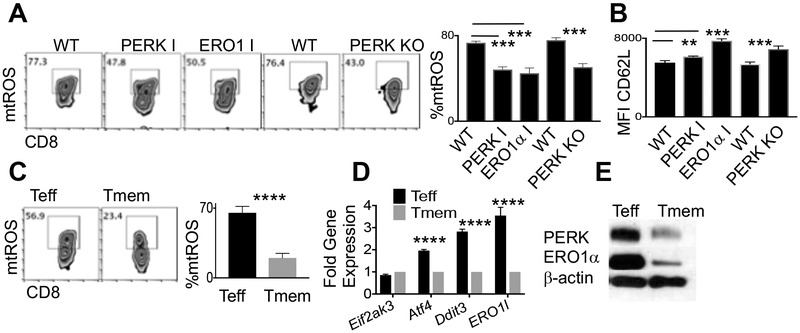
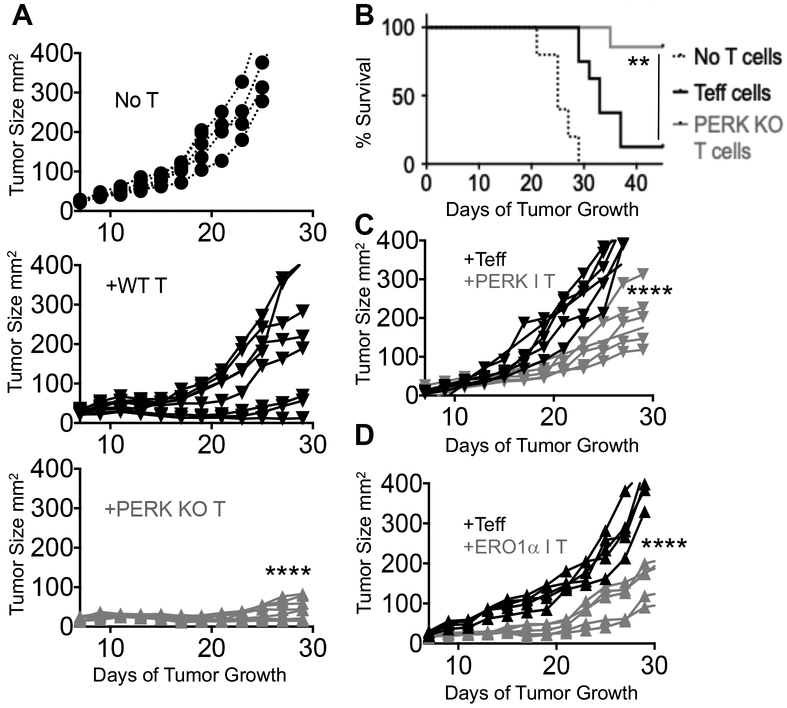
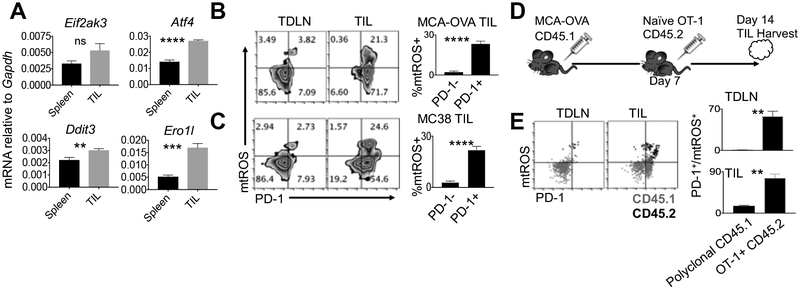
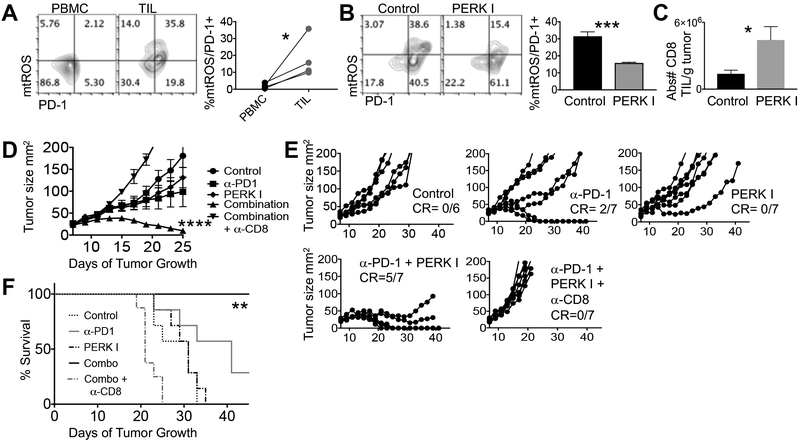
Tumor antigen-specific T cells rapidly lose energy and effector function in tumors. The cellular mechanisms by which energy loss and inhibition of effector function occur in tumor-infiltrating lymphocytes (TILs) are ill-defined, and methods to identify tumor antigen-specific TILs that experience such stress are unknown. Processes upstream of the mitochondria guide cell-intrinsic energy depletion. We hypothesized that a mechanism of T-cell-intrinsic energy consumption was the process of oxidative protein folding and disulfide bond formation that takes place in the endoplasmic reticulum (ER) guided by protein kinase R-like endoplasmic reticulum kinase (PERK) and downstream PERK axis target ER oxidoreductase 1 (ERO1α). To test this hypothesis, we created TCR transgenic mice with a T-cell-specific PERK gene deletion (OT1 + Lckcre+ PERK f/f , PERK KO). We found that PERK KO and T cells that were pharmacologically inhibited by PERK or ERO1α maintained reserve energy and exhibited a protein profile consistent with reduced oxidative stress. These T-cell groups displayed superior tumor control compared with T effectors. We identified a biomarker of ER-induced mitochondrial exhaustion in T cells as mitochondrial reactive oxygen species (mtROS), and found that PD-1+ tumor antigen-specific CD8+ TILs express mtROS. In vivo treatment with a PERK inhibitor abrogated mtROS in PD-1+ CD8+ TILs and bolstered CD8+ TIL viability. Combination therapy enabled 100% survival and 71% tumor clearance in a sarcoma mouse model. Our data identify the ER as a regulator of T-cell energetics and indicate that ER elements are effective targets to improve cancer immunotherapy.


Conflict of interest statement

Conflicts of interest: The authors declare no potential conflicts of interest

Figures

Figure 1.
Figure 1.. PERK contributes to chronic ER stress in C8+ T effector cells.
Naïve WT OT-1+ CD8+ T cells were activated and expanded with cognate peptide and harvested at indicated time points. (A-D) PERK (Eif2ak3), ATF4 (Atf4), CHOP (Ddit3), and ERO1α (Ero1l) gene expression were measured by qPCR and (E) PERK and ERO1α proteins measured by immunoblot (5μg, 2min). Data from 4 biological replicates are quantified and represented as SEM; results from students t test performed for naïve versus day 7 T cells are displayed. Experiments were repeated with four different WT animals and immunoblot is representative. Naïve PERK KO (OT-1xLck-Cre+xPERKf/f) and littermate controls (OT-1xLck-CrexPERKf/f) or 7-day expanded T cells were harvested. (F-I) PERK (Eif2ak3), ATF4 (Atf4), CHOP (Ddit3), and ERO1α (Ero1l) gene expression measured by qPCR and (J) immunblot (5μg, 1min) for PERK and ERO1α proteins. PERK 8min exposure is shown to convey lack of protein expression. Data from three WT and littermate pairs are quantified and represented as SEM, students t test. Experiments repeated twice and immunoblot data are representative of four independent experiments. *p<0.05, **p<0.01, ***p<0.001.
Figure 2.
Figure 2.. PERK axis impacts CD8+ T effector profiles.
Representative oxygen consumption rate (OCR) trace and quantification of spare respiratory capacity (SRC) from day 7 (A) PERK KO or littermate controls or (B) WT and PERK I or (C) WT and ERO1 I-treated OT-1+ CD8+ T cells measured via Seahorse Bioanalysis. Spare respiratory capacity (SRC) calculated as the difference between initial OCR rate and the maximal OCR rates achieved after FCCP uncoupling. Data are quantified and represented as SEM, students t test performed for each condition versus control T cells. Experiments were repeated at least 3 times. (D) IFN-γ production from day 7 WT, PERK I, or ERO1 I-treated OT-1+ T cells and WT (littermate) and PERK KO CD8+ T cells. Data from four biological replicates are quantified and represented as SEM, students t test performed for each condition versus WT cells. Individual experiments were repeated 3 times. * p<0.05, **p<0.01, ****p<0.0001. Gene symbol and expression intensity of proteins identified by LC-MS/MS-based shotgun proteomics extracted from the top 100 proteins with greatest enrichment in WT OT-1+ (T eff) compared to (E) PERK KO or (F) ERO1α I-treated T cells. Biologically functional groups of energy & metabolism, ER transport/ cell stress, oxidative stress/ DNA damage and Redox are shown. Heat maps represent fold increased intensity of proteins from average value of three replicates in each T cell group. Acly (+212.98) in Teff versus PERK KO T cells is represented numerically.
Figure 3.
Figure 3.. Mitochondrial reactive oxygen species signify mitochondrial exhaustion.
Representative FACS plots of (A) Naïve WT OT-1+ CD8+ T cells activated and expanded with cognate peptide or (B) human PBMC expanded in high dose IL-2 (3000U/mL) and CD8+ T cells FACS stained at indicated time points. FACS gates are set from fluorescence minus one controls. Data points represent quantification of five individual mice or human samples and are represented as SEM, students t test performed for each time point versus T0 control. Experiments repeated twice. (C) Representative FACS plot with gating from FACS sorts of mtROS/ CD8+ T cells. Lowest 25% - and highest 25% + mtROS populations were collected and (D) Representative oxygen consumption rate (OCR) trace and quantification of spare respiratory capacity (SRC) from sorted populations at indicated time points measured via Seahorse Bioanalysis. Spare respiratory capacity (SRC) calculated as the difference between initial OCR rate and the maximal OCR rates achieved after FCCP uncoupling. Data are quantified and represented as SEM, students t test performed for each condition versus control T cells. (E) IFN-γ production from sorted subsets at indicated time points. Post-sort purity was >97%. (F) Representative FACS plot and quantification of mtROS-Annexin co-staining on day 7 WT OT-1+ T cells. FACS gates are set from fluorescence minus one controls. Data are quantified and represented as SEM, students t test. Individual experiments repeated three times. * p<0.05, ****p<0.0001.
Figure 4.
Figure 4.. PERK axis drives mitochondrial exhaustion and is impaired in memory T cells.
Representative FACS plots and quantification of day 7 WT, PERK I, ERO1 I-treated and WT (littermate) and PERK KO OT-1+ CD8+ T cells probed for (A) mtROS or (B) CD62L expression. Bar graphs from 4 biological replicates are quantified and represented as SEM, Students t test performed for each condition versus control. FACS gates are set from fluorescence minus one controls. Experiments were repeated at least three times. T effector (Teff) or memory (Tmem) cells were developed and harvested. (C) Representative FACS plot and quantification of mtROS expression (D) quantification of PERK (Eif2ak3), ATF4 (Atf4), CHOP (Ddit3), and ERO1α (Ero1l) gene and (E) immunoblot for PERK and ERO1α proteins. FACS quantification from four biological replicates. Experiment repeated 3 times. Gene expression bar graphs represent average of 3 separate experiments and are shown as SEM, Teff values are expressed relative to respective Tmem values set to 1. Immunoblot is representative data from 3 experiments. **p<0.01, ***p<0.001, ****p<0.0001.
Figure 5.
Figure 5.. Inhibition of PERK axis augments T cell-specific tumor control
(A) Individual graphs of mice bearing 7-day B16F1-OVA tumors left untreated (n=5) or treated intravenously with 5×10⁵ 7-day expanded OT-1+ (Teff) (n=8) or PERK KO (n=7) T cells. Tumor size recorded every other day for 3 weeks. Lines represent individual mice. (B) Survival to 45 days or tumor size of 400mm2 was recorded, Log-rank test, **p<0.01 survival proportions of mice treated with Teff (12%) versus PERK KO T cells (86%) (C) Mice bearing 7-day B16F10 melanomas were treated intravenously with 2×10⁶ 7-day expanded Pmel (Teff) or Pmel T cells developed in the presence of (B) PERK inhibitor (PERK I T) or (D) ERO1α inhibitor (ERO1α I T). Tumor size recorded every other day for 3 weeks. Lines represent individual mice. Linear regression of Teff versus PERK KO or inhibitor-treated T cell groups, n=5-6 mice per group, ****p<0.0001. Experiments repeated twice.
Figure 6.
Figure 6.. Tumor antigen-specific PD-1+ CD8+ TILs experience mitochondrial exhaustion.
CD8+ cells were sorted from spleens and tumors of mice bearing 14-day MCA-205-OVA tumors and qPCR was performed to quantify (A) PERK (Eif2ak3), ATF4 (Atf4), CHOP (Ddit3), and ERO1α (Ero1l) gene expression. Bar graphs represent averages of 4 mice per group and are shown as SEM, experiment repeated twice. Representative FACS plots and quantification of mtROS/PD-1+ CD8+ populations in tumor draining lymph nodes (TDLNs) and tumors (tumor infiltrating lymphocytes (TILs)) harvested from mice bearing 14-day (B) MCA-205-OVA sarcomas or (C) MC38 colon carcinomas. Populations represent gating from CD8+/CD45+ lymphocytes and quadrants are set from PD-1 isotype control expression. Bar graphs represent 4-5 mice per group and are shown as SEM. Individual experiments were repeated 3 times. (D) 1×10⁶ naïve CD45.2 OT-1+ T cells were transferred via tail vein to CD45.1 C57BL/6 mice bearing 7 day established s.c. MCA-205-OVA sarcomas. Tumors were harvested 7 days post transfer. (E) Representative FACS plot overlay and quantification of mtROS/PD-1 co-staining from CD45.1 (gray) or CD45.2 (black) CD8+ cells in TDLNs and tumors. Gates are set from isotype control data. Bar graphs represent 4 mice per group and are shown as SEM. Individual experiments repeated twice. Students t test, **p<0.01, ****p<0.0001.
Figure 7.
Figure 7.. PERK inhibition reduces CD8+ TIL mtROS and augments anti-PD-1 therapy.
(A) Representative FACS plot and quantification of mtROS/PD-1+ CD8+ T cells from PBMC and tumor of three patients with pleomorphic undifferentiated high grade deep (PU HGD) sarcoma. Gates are set from isotype controls. PERK inhibitor (PERK I) or vehicle control was administered for 1 week (days 7-14) to mice bearing MCA-205-OVA sarcomas. (B) Representative FACS plots and quantification of mtROS/PD-1 TILs gated from CD45+/ CD8+ populations. Gates are set from isotype control data. (C) Absolute number of CD45+/PI/ CD8+ TILs calculated per gram of tumor weight. Bar graphs represent 4-5 mice per group and are shown as SEM. Individual experiments repeated twice. Students t test, *p<0.05, ***p<0.001. PERK I or vehicle control was administered beginning after 7 days of tumor growth to mice bearing MCA-205-OVA sarcomas and anti-PD-1 or isotype antibody was administered on day 12 and every four days thereafter. Anti-CD8 was administered every 2-3 days beginning 5 days after tumor inoculation. (D) Composite and (E) individual graphs of tumor growth measured every other day for 40 days with complete response (CR) listed per group, composite data represented as SEM. Linear regression of combination measured against anti-PD-1 therapy, ****p<0.0001. (F) Survival to 41 days or tumor size of 200mm2 was recorded, Log-rank test, **p<0.01 survival proportions of anti-PD-1 therapy (28%) versus combination therapy (100%). Combination experiment repeated twice, anti-CD8 depletion condition performed once.

References

    1. Williams MA, Bevan MJ. Effector and memory CTL differentiation. Annual review of immunology 2007;25:171–92 doi 10.1146/annurev.immunol.25.022106.141548. - DOI - PubMed
    1. Macintyre AN, Rathmell JC. Activated lymphocytes as a metabolic model for carcinogenesis. Cancer & metabolism 2013;1(1):5 doi 10.1186/2049-3002-1-5. - DOI - PMC - PubMed
    1. Buck MD, O’Sullivan D, Pearce EL. T cell metabolism drives immunity. The Journal of experimental medicine 2015;212(9):1345–60 doi 10.1084/jem.20151159. - DOI - PMC - PubMed
    1. Buck MD, O’Sullivan D, Klein Geltink RI, Curtis JD, Chang CH, Sanin DE, et al. Mitochondrial Dynamics Controls T Cell Fate through Metabolic Programming. Cell 2016;166(1):63–76 doi 10.1016/j.cell.2016.05.035. - DOI - PMC - PubMed
    1. Wherry EJ. T cell exhaustion. Nature immunology 2011;12(6):492–9. - PubMed

Publication types

MeSH terms