. 2019 Mar 15;294(11):3837-3852.
doi: 10.1074/jbc.RA118.003890. Epub 2019 Jan 18.

The natural anticancer agent cantharidin alters GPI-anchored protein sorting by targeting Cdc1-mediated remodeling in endoplasmic reticulum

Affiliations

The natural anticancer agent cantharidin alters GPI-anchored protein sorting by targeting Cdc1-mediated remodeling in endoplasmic reticulum

Pushpendra Kumar Sahu et al. J Biol Chem. .

Abstract

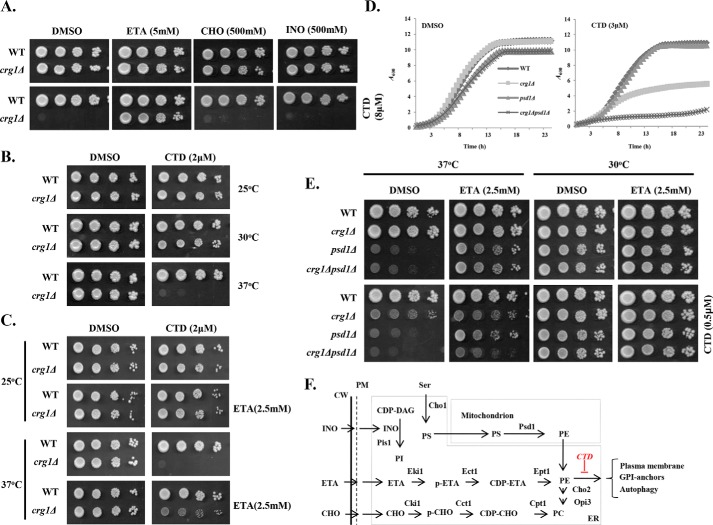
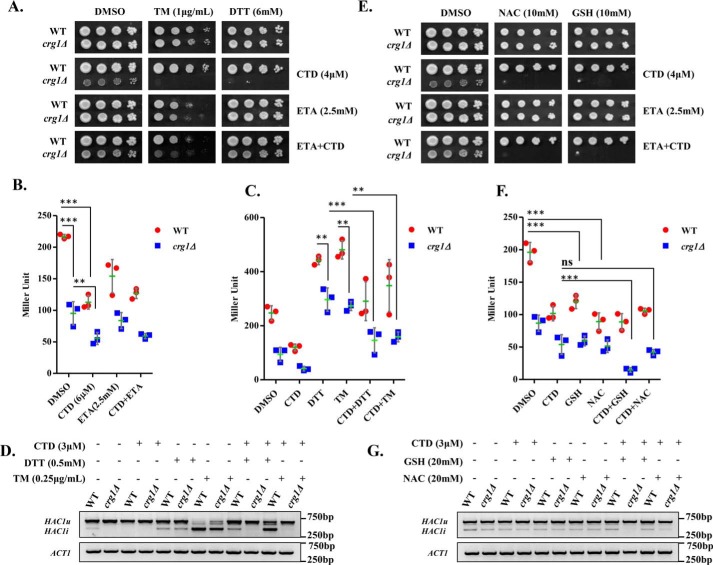
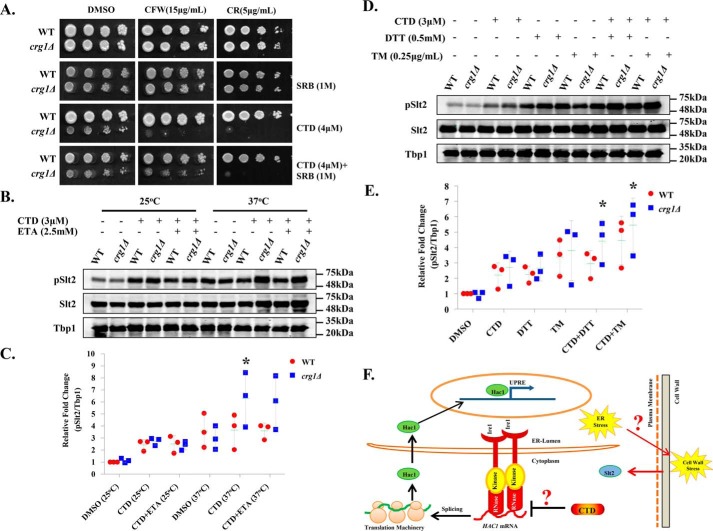
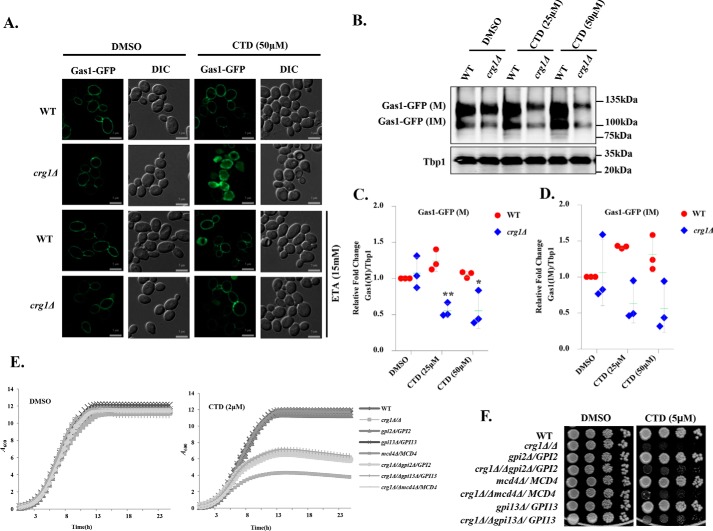
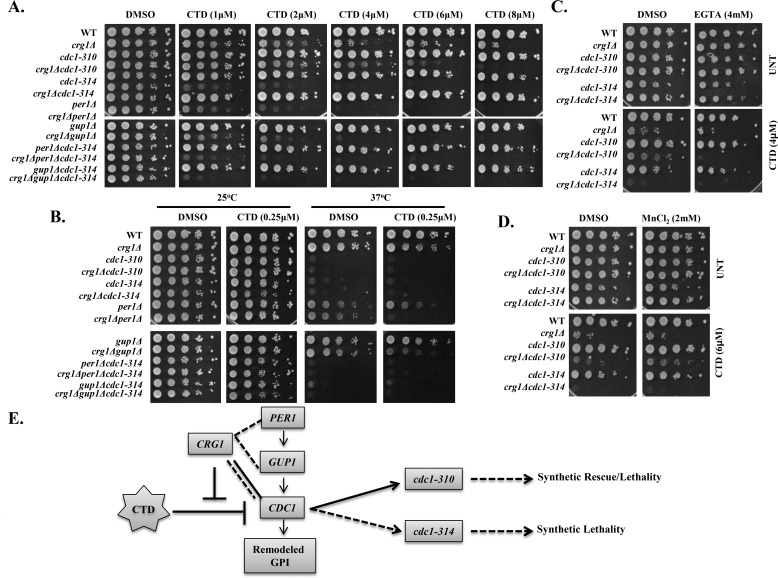
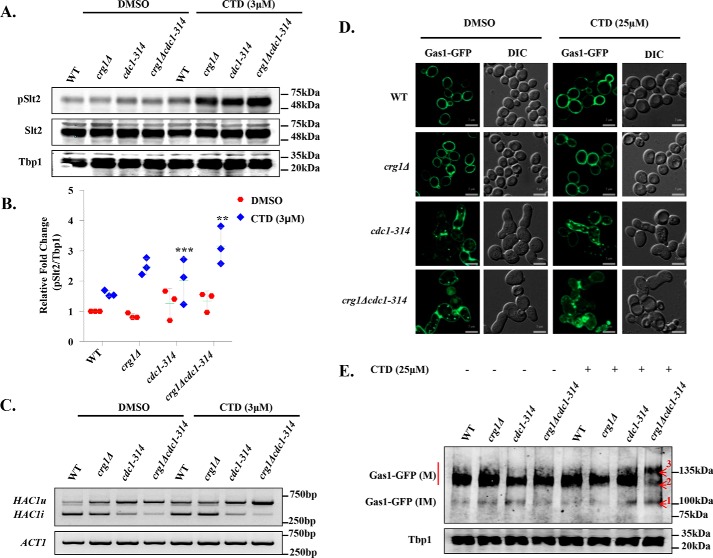
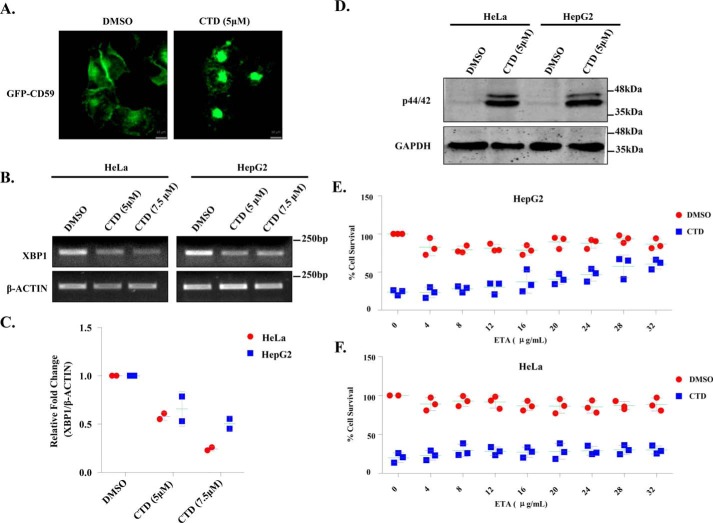
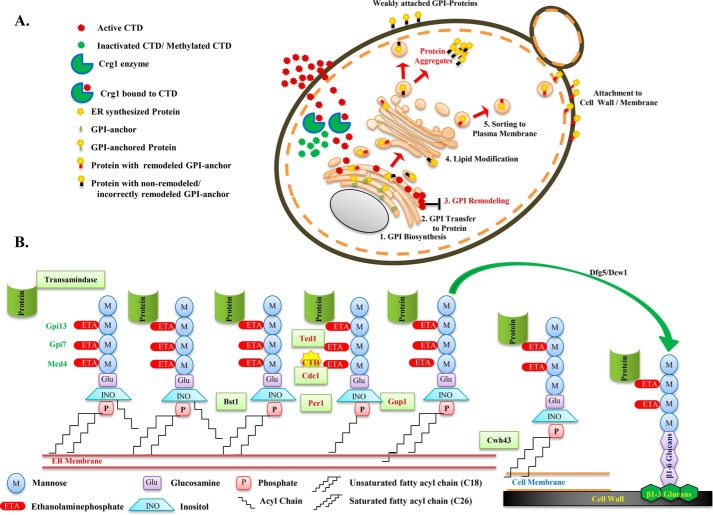
Cantharidin (CTD) is a potent anticancer small molecule produced by several species of blister beetle. It has been a traditional medicine for the management of warts and tumors for many decades. CTD suppresses tumor growth by inducing apoptosis, cell cycle arrest, and DNA damage and inhibits protein phosphatase 2 phosphatase activator (PP2A) and protein phosphatase 1 (PP1). CTD also alters lipid homeostasis, cell wall integrity, endocytosis, adhesion, and invasion in yeast cells. In this study, we identified additional molecular targets of CTD using a Saccharomyces cerevisiae strain that expresses a cantharidin resistance gene (CRG1), encoding a SAM-dependent methyltransferase that methylates and inactivates CTD. We found that CTD specifically affects phosphatidylethanolamine (PE)-associated functions that can be rescued by supplementing the growth media with ethanolamine (ETA). CTD also perturbed endoplasmic reticulum (ER) homeostasis and cell wall integrity by altering the sorting of glycosylphosphatidylinositol (GPI)-anchored proteins. A CTD-dependent genetic interaction profile of CRG1 revealed that the activity of the lipid phosphatase cell division control protein 1 (Cdc1) in GPI-anchor remodeling is the key target of CTD, independently of PP2A and PP1 activities. Moreover, experiments with human cells further suggested that CTD functions through a conserved mechanism in higher eukaryotes. Altogether, we conclude that CTD induces cytotoxicity by targeting Cdc1 activity in GPI-anchor remodeling in the ER.

Keywords: Cdc1; ER homeostasis; ER-Golgi transport; GPI-anchor remodeling; anticancer drug; cantharidin; cell signaling; glycosylphosphatidylinositol (GPI-anchor); lipid metabolism; lipid phosphatase; phospholipid; unfolded protein response (UPR); yeast genetics.


Conflict of interest statement

The authors declare that they have no conflicts of interest with the contents of this article

Figures

Figure 1.
Figure 1.
CTD specifically targets PE in crg1Δ cells. A, B, C, and E, growth sensitivity assays. Equal numbers of cells were serially diluted and spotted on SC agar medium. Images were captured after 72 h of incubation. A, supplementation of ETA rescues crg1Δ mutant from CTD toxicity. The phospholipid precursors ETA, INO, and CHO were added into SC agar medium with or without CTD. WT and crg1Δ cells were spotted and incubated at 30 °C. B, CTD toxicity increases with rising temperature. WT and crg1Δ cells were spotted on SC agar medium containing CTD and incubated at different temperatures (25, 30, and 37 °C). C, ETA supplementation rescues the crg1Δ mutant from CTD toxicity at higher temperature. WT and crg1Δ cells were spotted on SC agar medium containing CTD with and without ETA supplementation and incubated at different temperatures (25, 30, and 37 °C). D and E, CRG1 shows synthetic lethality with PSD1 under CTD stress. D, growth curve assay. Equal numbers of cells of WT, crg1Δ, psd1Δ, and crg1Δpsd1Δ were grown at 30 °C with or without CTD in liquid medium. A600 was measured at the time interval of 30 min using an automated plate reader for 23 h. E, WT, crg1Δ, psd1Δ, and crg1Δpsd1Δ cells were spotted on SC agar medium containing CTD with or without ETA and incubated at two different temperatures (30 and 37 °C). F, phospholipid biosynthesis pathways in yeast (37, 66, 77, 78). INO and Ser in medium are directly utilized to synthesize PI and PS with the help of Pis1 and Cho1, respectively. PE and PC biosynthesis has two pathways. The first pathway is canonical biosynthesis of PE/PC, which takes place in mitochondria and the ER. The first reaction starts in the ER, where Cho2 synthesizes PS from Ser. PS is transported to mitochondria, where Psd1 catalyzes its decarboxylation to synthesize PE. (A similar mechanism also takes place in Golgi and vacuole by Psd2, which contributes a very minor fraction of the net PE content). Next, PE is transported again to the ER, where Cho2 and Opi3 convert it into PC via a sequence of methylation reactions. The second pathway is noncanonical PE or PC synthesis, also known as the Kennedy pathway. In this pathway, externally supplemented precursors (ETA/CHO) are utilized and converted into PE or PC, respectively, via a series of enzymatic reactions.
Figure 2.
Figure 2.
CTD treatment inhibits UPR by alteration of the ER-redox homeostasis. A, UPR inducers (DTT/TM) synergistically enhance CTD toxicity. Equal numbers of serially diluted WT and crg1Δ cells were spotted on CTD-containing SC agar medium with or without DTT/TM in the presence or absence of ETA and incubated at 30 °C for 72 h. B, CTD inhibits UPR. WT and crg1Δ strains transformed with pPW344 (UPRE-LacZ) plasmid were grown in SC-URA medium at 30 °C. Cells were treated with CTD (6 μm) with or without ETA (2.5 mm) at the mid-exponential phase (A600 = 0.8) and incubated for 2 h. A β-gal assay was performed to measure the UPR. The graph shows a scatter plot of each data point of three independent experiments with mean (horizontal green line) ± S.D. (error bars). Statistical analysis was done with GraphPad Prism version 5, applying two-way ANOVA and Bonferroni post hoc test, where p ≤ 0.05 (*), p ≤ 0.01 (**), and p ≤ 0.001 (***). C, CTD inhibits UPR in presence of DTT and TM. WT and crg1Δ strains carrying pPW344 vector were grown until the mid-exponential phase and treated with CTD (3 μm) in combination with DTT (0.5 mm) or TM (0.25 μg/ml) for 2 h. A β-gal assay was performed to measure the UPR. The graph shows a scatter plot of each data point of three independent experiments with mean ± S.D. (error bars). Statistical analysis was done using GraphPad Prism version 5, applying two-way ANOVA and Bonferroni post hoc test, where p ≤ 0.05 (*), p ≤ 0.01 (**), and p ≤ 0.001 (***). D, CTD inhibits HAC1 mRNA splicing. WT and crg1Δ strains were grown in the conditions mentioned above (C), and HAC1 mRNA splicing was measured by RT-PCR. HAC1(u), unspliced HAC1; HAC1(i), spliced HAC1. The figure represents one of the three independently performed experiments. E, GSH or NAC supplementation enhances the CTD cytotoxicity. Equal numbers of WT and crg1Δ cells were serially diluted and spotted on CTD-containing SC agar medium with or without reducing agents (GSH and NAC) in the presence or absence of ETA, incubated at 30 °C for 72 h. F, GSH and NAC supplementation reduces UPR. WT and crg1Δ strains transformed with pPW344 (UPRE-LacZ) were grown in SC-URA medium at 30 °C until mid-exponential phase. The cells were treated with CTD (3 μm) in the presence or absence of GSH (20 mm) or NAC (20 mm) for 2 h and processed for the β-gal assay. The graph shows a scatter plot of each data point of three independent experiments with mean ± S.D. (error bars). Statistical analysis was done using GraphPad Prism version 5, applying two-way ANOVA and Bonferroni post hoc test, where p ≤ 0.05 (*), p ≤ 0.01 (**), and p ≤ 0.001 (***). G, GSH and NAC supplementation enhances the CTD-mediated inhibition of HAC1 splicing. WT and crg1Δ cells were grown in SC medium at 30 °C until mid-exponential phase under the same conditions mentioned above (F), and the HAC1 mRNA splicing was measured by RT-PCR. The figure represents one of the three independently performed experiments.
Figure 3.
Figure 3.
CTD-induced ER stress perturbs the cell wall integrity. A, CTD and cell wall–perturbing agents (CR or CFW) are synergistically lethal to crg1Δ mutant. Equal numbers of WT and crg1Δ cells were serially diluted and spotted on SC agar medium containing CTD with and without CR or CFW. The cells were incubated at 30 °C for 72 h. B–E, Western blot analysis of the Slt2 phosphorylation. Whole-cell lysates were prepared from WT and crg1Δ cells grown in different conditions. Tbp1 was taken as a loading control. B, CTD-induced cell wall damage increases with heat stress. WT and crg1Δ strains were grown at two different temperatures, 24 and 37 °C, until mid-exponential phase (0.8 A600) and then treated with CTD in the presence or absence of ETA for 2 h. The data represent one of the three independently performed experiments. C, densitometry quantification of the three biological repeats of the Western blots shown in B, with the help of ImageJ software. The graph shows a scatter plot of each data point of three independent experiments with mean ± S.D. (error bars). Statistical analysis was done, applying Student's t test, where p ≤ 0.05 (*), p ≤ 0.01 (**), and p ≤ 0.001 (***). D, CTD-induced cell wall damage increases with UPR induction. WT and crg1Δ strains were grown at 24 °C until mid-exponential phase and treated with CTD with or without DTT or TM for 2 h. The figure represents one of the three independently performed experiments. E, densitometry quantification of the three biological repeats of the western blots shown in D, with the help of ImageJ software. The graph shows a scatter plot of each data point of three independent experiments with mean ± S.D. (error bars). Statistical analysis was done, applying Student's t test, where p ≤ 0.05 (*), p ≤ 0.01 (**), and p ≤ 0.001 (***). F, a hypothetical model connecting two majorly affected pathways, UPR and CWI, by CTD. The CTD inhibits HAC1 mRNA splicing and subsequent UPRE activation, which promotes ER stress. Yeast cell wall biosynthesis is an ER-dependent process; the CTD-induced ER stress may alter the cell wall integrity, evident in this study by Slt2 activation. The probable link between ER stress and cell wall damage could be the GPI-anchored protein sorting, and it might be the direct target of CTD.
Figure 4.
Figure 4.
CTD alters GPI-anchored protein sorting. A, CTD treatment induces missorting of Gas1-GFP. WT and crg1Δ cells were transformed with YEp24-GAS1-GFP plasmid. Cells were grown in YPD at 30 °C until mid-exponential phase, treated with CTD with or without ETA, and incubated for 6 h before imaging. Subcellular localization of Gas1-GFP was observed by using a ZEISS-Apotome fluorescence microscope. B, CTD treatment decreases Gas1-GFP expression. WT and crg1Δ strains expressing Gas1-GFP were grown in YPD at 30 °C until mid-exponential phase and then treated with CTD. Cells were harvested after 3 h of incubation to analyze the expression of Gas1-GFP. In this data, the mature form of Gas1-GFP is represented as Gas1-GFP(M), whereas the immature Gas1-GFP is shown is Gas1-GFP(IM). Tbp1 was used as a loading control. The figure represents one of the three independently performed experiments. C and D, densitometry quantification of the three biological repeats of the Western blotting shown in B, with the help of ImageJ software. C, level of Gas1-GFP(M). D, level of Gas1-GFP(IM). The graph shows a scatter plot of each data point of three independent experiments with mean ± S.D. (error bars). Statistical analysis was done, applying Student's t test, where p ≤ 0.05 (*), p ≤ 0.01 (**), and p ≤ 0.001 (***). E and F, GPI biosynthesis genes show synthetic rescue with CRG1 under CTD stress. E, growth curve assay to compare the sensitivity of crg1Δ/Δ, gpi2Δ/GPI2, gpi13Δ/GPI13, mcd4Δ/MCD4, crg1Δ/Δgpi2Δ/GPI2, crg1Δ/Δgpi13Δ/GPI13, and crg1Δ/Δmcd4Δ/MCD4 mutants to CTD. F, growth sensitivity spot assay of WT, crg1Δ/Δ, gpi2Δ/GPI2, gpi13Δ/GPI13, mcd4Δ/MCD4, crg1Δ/Δgpi2Δ/GPI2, crg1Δ/Δgpi13Δ/GPI13, and crg1Δ/Δmcd4Δ/MCD4 mutants. Equal numbers of WT and mutant cells were serially diluted and spotted on the CTD-containing SC agar medium. The spotted cells were incubated at 30 °C for 72 h.
Figure 5.
Figure 5.
CTD targets Cdc1 activity involved in GPI-anchor remodeling. A–D, growth sensitivity assay. Equal numbers of serially diluted cells of WT and the indicated mutants were spotted on SC agar medium with various treatments. Images were captured after 72 h of incubation. A, CRG1 shows synthetic lethality with GPI-anchor–remodeling genes under CTD stress. A spot assay on medium with increasing doses of CTD (1–8 μm) was followed by incubation at 25 °C. B, CRG1 shows synthetic lethality with GPI-anchor–remodeling genes under CTD and heat stress. A spot assay was done on medium containing CTD and incubated at 25 and 37 °C. C, Mn2+ chelation increases CTD toxicity. The yeast strains indicated above were spotted on medium containing CTD with and without EGTA and incubated at 25 °C. D, Mn2+ supplementation decreases CTD toxicity. Yeast strains indicated above were spotted on medium containing CTD and MnCl2 and incubated at 25 °C. E, schematic representation of CTD-dependent genetic interaction of CRG1 with GPI-anchor–remodeling genes; PER1, GUP1, and CDC1.CRG1 show synthetic lethality with PER1, GUP1, and CDC1. cdc1-310 shows dose-dependent interaction with crg1Δ: synthetic rescue at lower dose (2–4 μm) and synthetic lethality at higher dose (6–8 μm).
Figure 6.
Figure 6.
CTD treatment mimics CDC1 mutation (cdc1-314). A, CTD treatment induces Slt2 phosphorylation in crg1Δ and cdc1-314 mutant. Western blot analysis of Slt2 phosphorylation in WT, crg1Δ, cdc1-314, and crg1Δcdc1-314 strains. Cells were grown at 25 °C until mid-exponential phase and then treated with CTD for 2 h. The figure represents one of the three independently performed experiments. B, densitometry quantification of the three biological repeats of the Western blots shown in A, with the help of ImageJ software. The graph shows a scatter plot of each data point of three independent experiments with mean ± S.D. (error bars). Statistical analysis was done, applying Student's t test, where p ≤ 0.05 (*), p ≤ 0.01 (**), and p ≤ 0.001 (***). C, synergistic inhibition of HAC1 mRNA splicing in crg1Δcdc1-314 mutant upon CTD treatment. RT-PCR analysis of HAC1 mRNA in WT, crg1Δ, cdc1-314, and crg1Δcdc1-314 mutants. The cells were grown at 25 °C until mid-exponential phase and then treated with CTD for 2 h. The figure represents one of the three independently performed experiments. D, CTD induces Gas1-GFP missorting. Shown is subcellular localization of Gas1-GFP in WT, crg1Δ, cdc1-314, and crg1Δcdc1-314. Cells were transformed with YEp24-GAS1-GFP and grown in YPD medium with and without CTD treatment for 6 h at 25 °C. E, CTD alters GPI-anchor maturation of Gas1-GFP. Shown is Western blot analysis of Gas1-GFP in crg1Δcdc1-314 mutant. Numbers 1, 2, and 3 in the Gas-GFP bands represent the protein retardation and altered maturation of the GPI-anchor due to CTD treatment. The data represent one of the three independently performed experiments.
Figure 7.
Figure 7.
Conserved mechanism of CTD cytotoxicity in human cancer cells (HeLa and HepG2). A, CTD alters GPI-anchored protein sorting. Microscopic visualization of GFP-CD59, stably expressing in HeLa cells with or without CTD treatment for 12 h. B, CTD treatment down-regulates XBP1 expression. Semiquantitative RT-PCR analysis of XBP1 expression in HeLa and HepG2 cell lines treated with CTD for 48 h is shown. The data represent one of the two independent experiments. C, densitometry quantification of the two biological repeats of the semiquantitative PCR shown in B, with the help of ImageJ software. The graph shows a scatter plot of each data point of three independent experiments with mean ± S.D. (error bars). D, CTD treatment induces p44/42 (Slt2) phosphorylation. Shown is Western blot analysis of p44/42 phosphorylation in HeLa and HepG2 cell lines after 48 h of CTD treatment. The figure represents one of the three independent experiments. E, ETA supplementation rescues HepG2 cells from CTD cytotoxicity. MTT cell survival assay of HepG2 cells treated with CTD, supplemented with increasing concentrations of ETA. F, ETA supplementation does not rescue HeLa cells from CTD cytotoxicity. Shown is an MTT cell survival assay of HeLa cells treated with CTD, supplemented with increasing concentrations of ETA.
Figure 8.
Figure 8.
Schematic model illustrating the molecular targets and mechanism of CTD toxicity in yeast and higher eukaryotes. A, the model describes yeast Crg1 as a key defense molecule, localized in the cytoplasm, which protects the cell from CTD-induced cytotoxicity by methyltransferase activity. Loss of Crg1 enhances the binding of CTD to its molecular targets and perturbs the related biological functions. In the absence of Crg1, CTD enters into the ER and disturbs the ER homeostasis by altering the GSH/GSSG ratio and GPI-anchor remodeling, leading to missorting and aggregation of the proteins in the cytoplasm. B, illustration of the GPI-anchor–remodeling process in budding yeast. The C-terminal end of the protein is transferred to the ethanolamine phosphate of the third mannose of the GPI-anchor, catalyzed by a complex of enzymes, GPI–transamidase. In the subsequent process, Bst1 removes the acyl group from the inositol of GPI, Cdc1 removes ethanolamine phosphate from the first mannose, Per1 removes the unsaturated fatty acid (C18:1) from the sn-2 position of the GPI–lipid, Gup1 adds C26:0 saturated fatty acid at the sn-2 position of the GPI–lipid, and at last Cwh43 replaces the diacyglycerol type lipid with ceramide in GPI. Finally, the GPI-anchor is transferred to the plasma membrane or cell wall by Dfg5 or Dcw1. In this sequence of events, CTD targets Cdc1 activity, resulting in mislocalization and aggregation of GPI-anchored proteins.

Similar articles

Cited by

References

    1. Orlean P., and Menon A. K. (2007) Thematic review series: lipid posttranslational modifications. GPI anchoring of protein in yeast and mammalian cells, or: how we learned to stop worrying and love glycophospholipids. J. Lipid Res. 48, 993–1011 10.1194/jlr.R700002-JLR200 - DOI - PubMed
    1. Fujita M., and Kinoshita T. (2012) GPI-anchor remodeling: potential functions of GPI-anchors in intracellular trafficking and membrane dynamics. Biochim. Biophys. Acta 1821, 1050–1058 10.1016/j.bbalip.2012.01.004 - DOI - PubMed
    1. Losev E., Papanikou E., Rossanese O. W., and Glick B. S. (2008) Cdc1p is an endoplasmic reticulum-localized putative lipid phosphatase that affects Golgi inheritance and actin polarization by activating Ca2+ signaling. Mol. Cell. Biol. 28, 3336–3343 10.1128/MCB.00567-07 - DOI - PMC - PubMed
    1. Vazquez H. M., Vionnet C., Roubaty C., and Conzelmann A. (2014) Cdc1 removes the ethanolamine phosphate of the first mannose of GPI anchors and thereby facilitates the integration of GPI proteins into the yeast cell wall. Mol. Biol. Cell 25, 3375–3388 10.1091/mbc.e14-06-1033 - DOI - PMC - PubMed
    1. Fujita M., Maeda Y., Ra M., Yamaguchi Y., Taguchi R., and Kinoshita T. (2009) GPI glycan remodeling by PGAP5 regulates transport of GPI-anchored proteins from the ER to the Golgi. Cell 139, 352–365 10.1016/j.cell.2009.08.040 - DOI - PubMed

Publication types

MeSH terms

Substances