

Multiomics resolution of molecular events during a day in the life of Chlamydomonas
- PMID: 30659148
- PMCID: PMC6369806
- DOI: 10.1073/pnas.1815238116
Multiomics resolution of molecular events during a day in the life of Chlamydomonas
Abstract
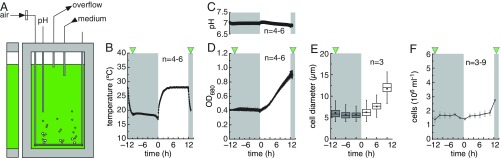
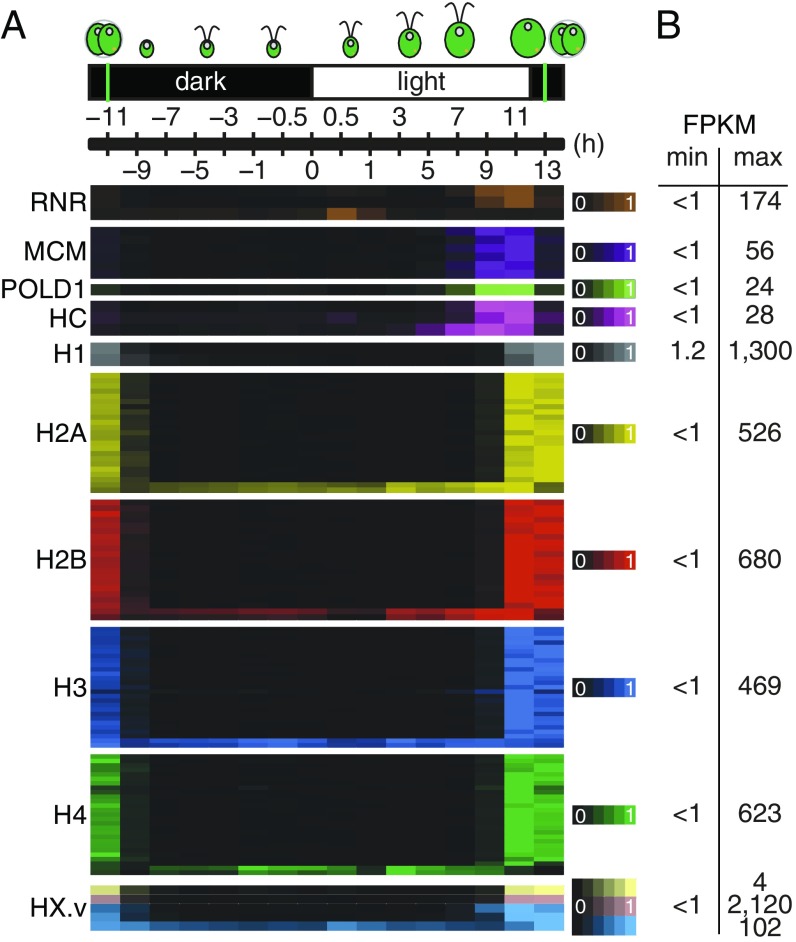
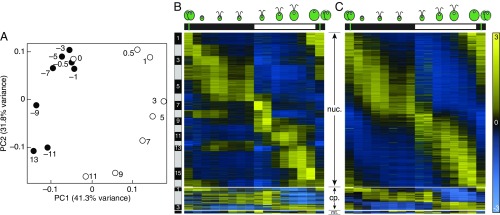
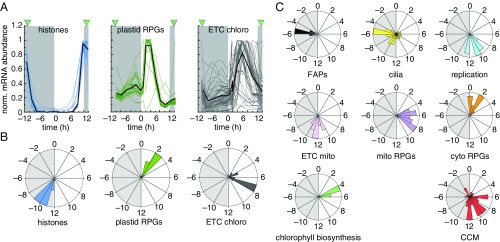
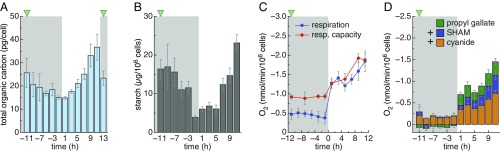
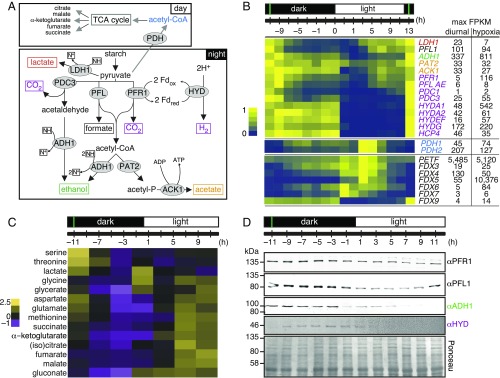
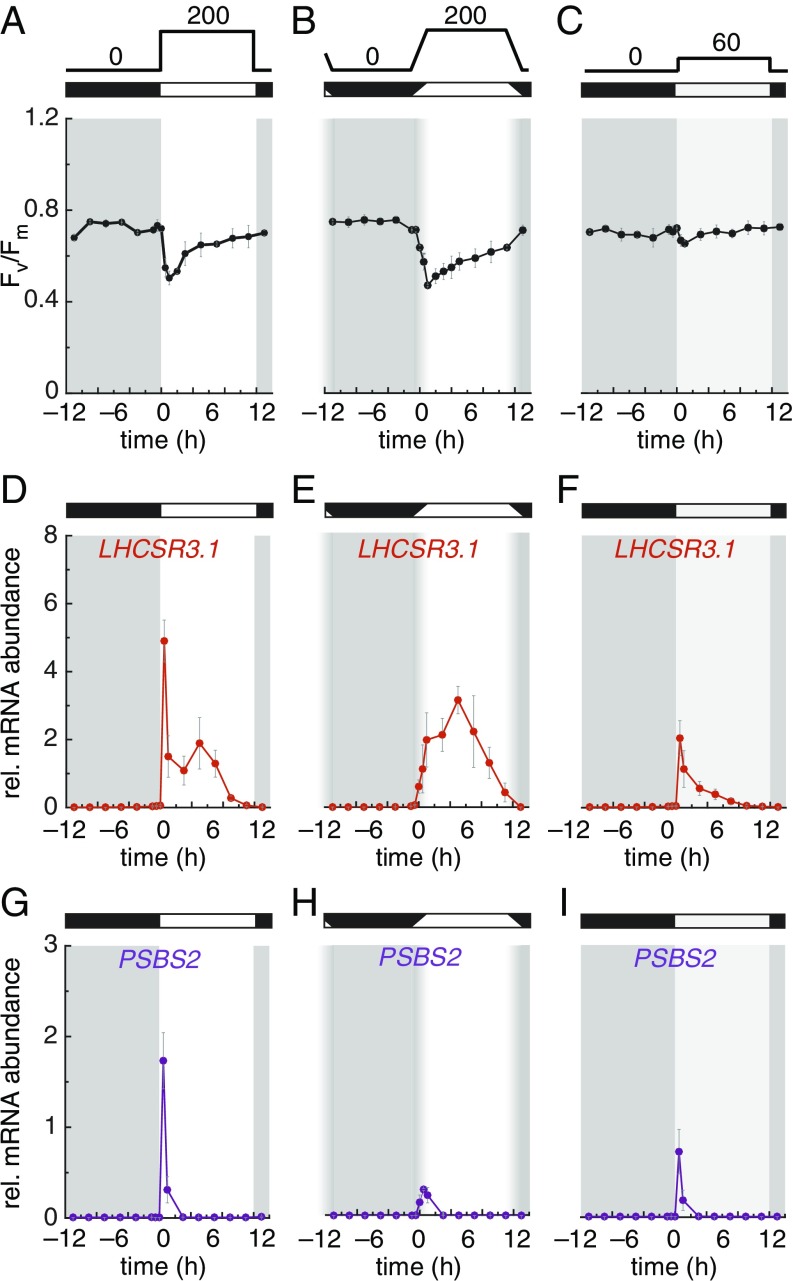
The unicellular green alga Chlamydomonas reinhardtii displays metabolic flexibility in response to a changing environment. We analyzed expression patterns of its three genomes in cells grown under light-dark cycles. Nearly 85% of transcribed genes show differential expression, with different sets of transcripts being up-regulated over the course of the day to coordinate cellular growth before undergoing cell division. Parallel measurements of select metabolites and pigments, physiological parameters, and a subset of proteins allow us to infer metabolic events and to evaluate the impact of the transcriptome on the proteome. Among the findings are the observations that Chlamydomonas exhibits lower respiratory activity at night compared with the day; multiple fermentation pathways, some oxygen-sensitive, are expressed at night in aerated cultures; we propose that the ferredoxin, FDX9, is potentially the electron donor to hydrogenases. The light stress-responsive genes PSBS, LHCSR1, and LHCSR3 show an acute response to lights-on at dawn under abrupt dark-to-light transitions, while LHCSR3 genes also exhibit a later, second burst in expression in the middle of the day dependent on light intensity. Each response to light (acute and sustained) can be selectively activated under specific conditions. Our expression dataset, complemented with coexpression networks and metabolite profiling, should constitute an excellent resource for the algal and plant communities.
Keywords: cell division; chloroplast; histone expression; photobioreactor; systems biology.
Copyright © 2019 the Author(s). Published by PNAS.
Conflict of interest statement
The authors declare no conflict of interest.
Figures
Similar articles
-
Too dim, too bright, and just right: Systems analysis of the Chlamydomonas diurnal program under limiting and excess light.Plant Cell. 2025 Jun 4;37(6):koaf086. doi: 10.1093/plcell/koaf086. Plant Cell. 2025. PMID: 40251989 Free PMC article.
-
The early genetic response to light in the green unicellular alga Chlamydomonas eugametos grown under light/dark cycles involves genes that represent direct responses to light and photosynthesis.Plant Mol Biol. 1992 Feb;18(3):429-45. doi: 10.1007/BF00040659. Plant Mol Biol. 1992. PMID: 1371402
-
Targeted proteomics for Chlamydomonas reinhardtii combined with rapid subcellular protein fractionation, metabolomics and metabolic flux analyses.Mol Biosyst. 2010 Jun;6(6):1018-31. doi: 10.1039/b920913a. Epub 2010 Mar 31. Mol Biosyst. 2010. PMID: 20358043
-
From economy to luxury: Copper homeostasis in Chlamydomonas and other algae.Biochim Biophys Acta Mol Cell Res. 2020 Nov;1867(11):118822. doi: 10.1016/j.bbamcr.2020.118822. Epub 2020 Aug 13. Biochim Biophys Acta Mol Cell Res. 2020. PMID: 32800924 Free PMC article. Review.
-
Between a rock and a hard place: trace element nutrition in Chlamydomonas.Biochim Biophys Acta. 2006 Jul;1763(7):578-94. doi: 10.1016/j.bbamcr.2006.04.007. Epub 2006 Apr 26. Biochim Biophys Acta. 2006. PMID: 16766055 Review.
Cited by
-
Comparative genomics of Chlamydomonas.Plant Cell. 2021 May 31;33(4):1016-1041. doi: 10.1093/plcell/koab026. Plant Cell. 2021. PMID: 33793842 Free PMC article.
-
Modeling the effect of rRNA-mRNA interactions and mRNA folding on mRNA translation in chloroplasts.Comput Struct Biotechnol J. 2022 May 18;20:2521-2538. doi: 10.1016/j.csbj.2022.05.030. eCollection 2022. Comput Struct Biotechnol J. 2022. PMID: 35685358 Free PMC article.
-
Comparative Phenotyping of Two Commonly Used Chlamydomonas reinhardtii Background Strains: CC-1690 (21gr) and CC-5325 (The CLiP Mutant Library Background).Plants (Basel). 2022 Feb 22;11(5):585. doi: 10.3390/plants11050585. Plants (Basel). 2022. PMID: 35270055 Free PMC article.
-
The Effects of De Novo Mutation on Gene Expression and the Consequences for Fitness in Chlamydomonas reinhardtii.Mol Biol Evol. 2024 Mar 1;41(3):msae035. doi: 10.1093/molbev/msae035. Mol Biol Evol. 2024. PMID: 38366781 Free PMC article.
-
Omics Application of Bio-Hydrogen Production Through Green Alga Chlamydomonas reinhardtii.Front Bioeng Biotechnol. 2019 Aug 21;7:201. doi: 10.3389/fbioe.2019.00201. eCollection 2019. Front Bioeng Biotechnol. 2019. PMID: 31497598 Free PMC article. Review.
References
-
- Noordally ZB, Millar AJ. Clocks in algae. Biochemistry. 2015;54:171–183. - PubMed
-
- Harris EC. The Chlamydomonas Sourcebook: Introduction into Chlamydomonas and Its Laboratory Use. Academic; New York: 2008.
-
- Atteia A, van Lis R, Tielens AG, Martin WF. Anaerobic energy metabolism in unicellular photosynthetic eukaryotes. Biochim Biophys Acta. 2013;1827:210–223. - PubMed
Publication types
MeSH terms
Substances
LinkOut - more resources
Full Text Sources
Other Literature Sources
Molecular Biology Databases
