. 2019 Feb 5;116(6):2318-2327.
doi: 10.1073/pnas.1811768116. Epub 2019 Jan 18.

Illuminating spatial A-to-I RNA editing signatures within the Drosophila brain

Affiliations

Illuminating spatial A-to-I RNA editing signatures within the Drosophila brain

Anne L Sapiro et al. Proc Natl Acad Sci U S A. .

Abstract

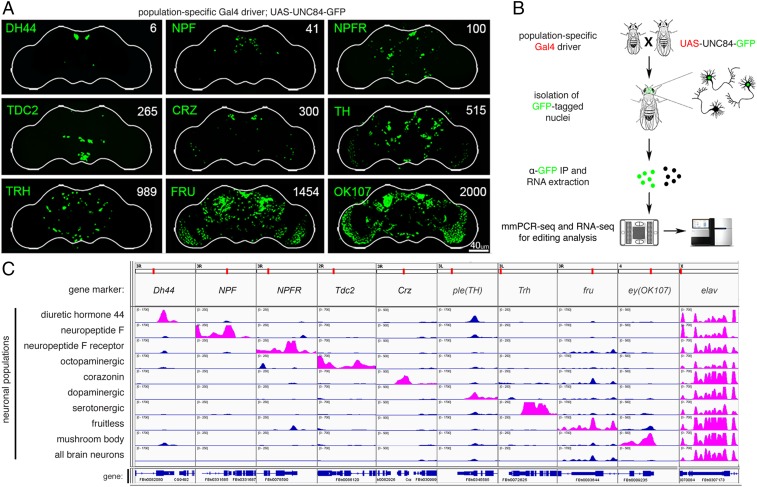
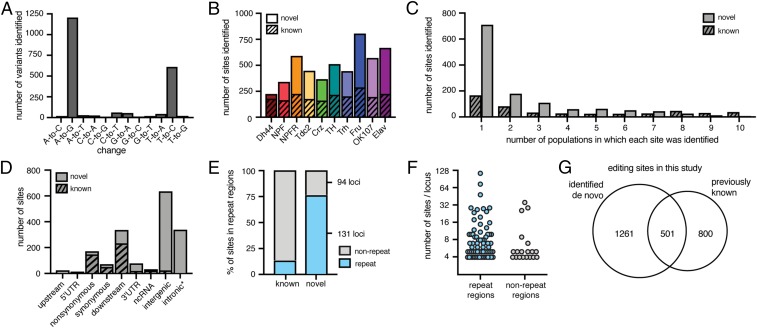
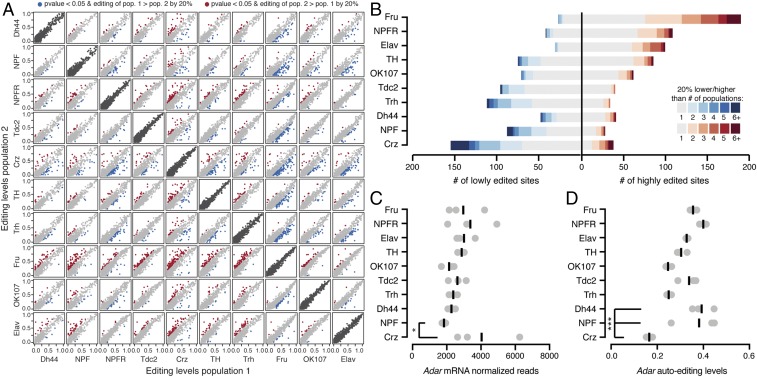
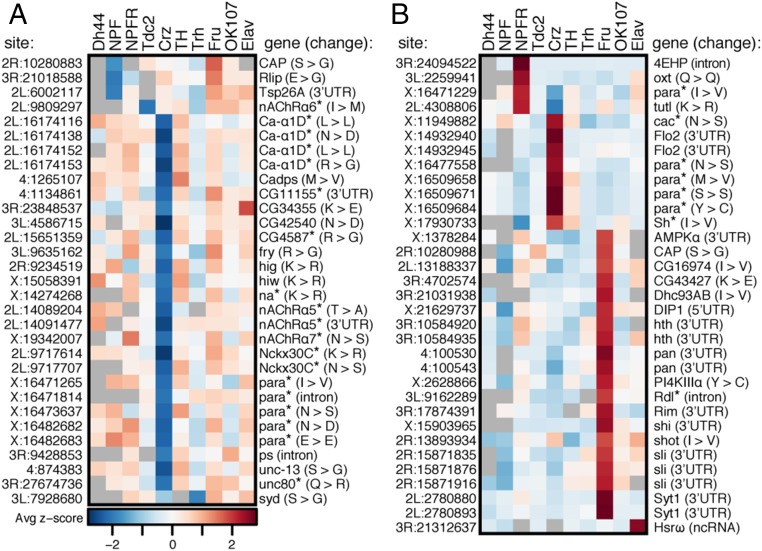
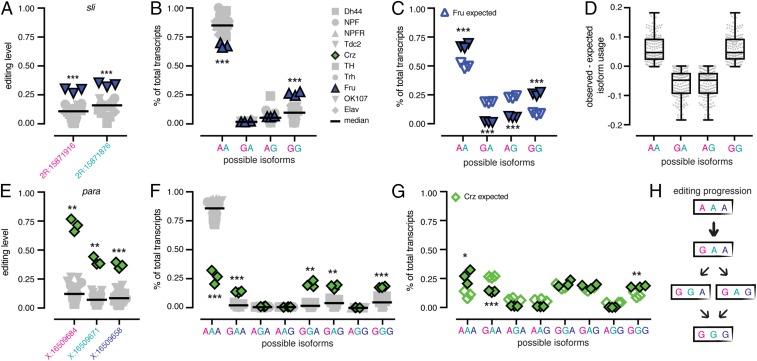
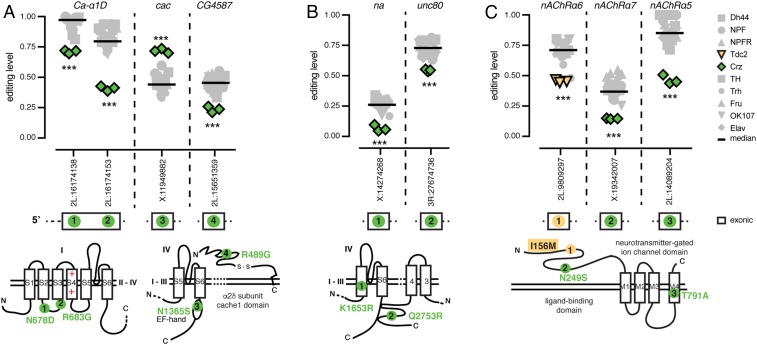
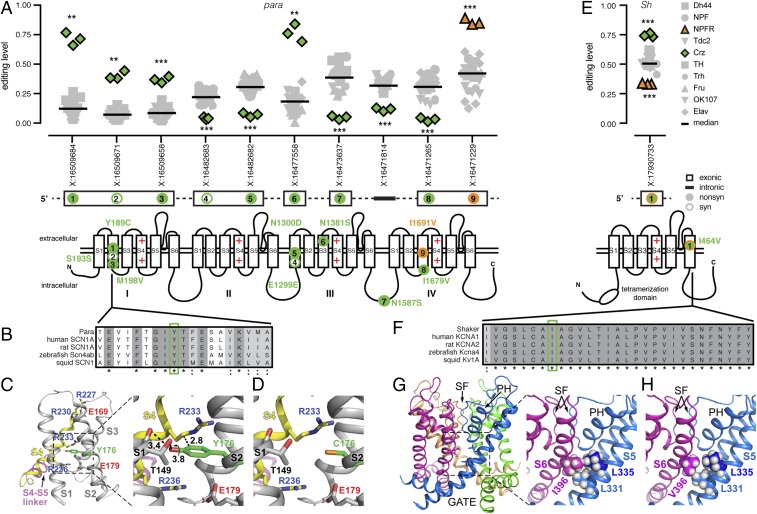
Adenosine-to-inosine (A-to-I) RNA editing, catalyzed by ADAR enzymes, is a ubiquitous mechanism that generates transcriptomic diversity. This process is particularly important for proper neuronal function; however, little is known about how RNA editing is dynamically regulated between the many functionally distinct neuronal populations of the brain. Here, we present a spatial RNA editing map in the Drosophila brain and show that different neuronal populations possess distinct RNA editing signatures. After purifying and sequencing RNA from genetically marked groups of neuronal nuclei, we identified a large number of editing sites and compared editing levels in hundreds of transcripts across nine functionally different neuronal populations. We found distinct editing repertoires for each population, including sites in repeat regions of the transcriptome and differential editing in highly conserved and likely functional regions of transcripts that encode essential neuronal genes. These changes are site-specific and not driven by changes in Adar expression, suggesting a complex, targeted regulation of editing levels in key transcripts. This fine-tuning of the transcriptome between different neurons by RNA editing may account for functional differences between distinct populations in the brain.

Keywords: Drosophila; RNA editing; neurons.


Conflict of interest statement

The authors declare no conflict of interest.

Figures

Fig. 1.
Fig. 1.
Isolation of RNA from distinct neuronal populations. (A) Confocal images of GFP-marked nuclei in fly brains from the nine neuronal populations used in this study. Gal4 drivers are listed on the left of each image, with the number of cells in each neuronal population listed on the right. (Scale bar: 40 µm.) (B) Schematic of workflow for isolating RNA from discrete neuronal populations and RNA editing analysis. (C) Visualization of RNA-seq reads from the nine cell populations and Elav control at marker genes for the 10 groups. Reads of the relevant marker genes for each population listed on the left are shown in pink.
Fig. 2.
Fig. 2.
Identification of RNA editing sites from distinct neuronal populations. (A) The total number of all variants identified de novo. (B) The number of editing sites identified de novo from each population, split into known sites in stripes and novel sites in solids. (C) Histogram of the number populations in which each known site and novel site was identified de novo. (D) The number of known and novel sites found in each annotated location. *353 sites annotated as intronic are found in the Myo81F heterochromatic region of chr3R. (E) The percentage of known and novel sites identified by our pipeline that overlap annotated repeat regions (blue) or do not (gray). (F) The number of novel editing sites found within each locus that contained at least four sites, for loci overlapping repeat regions and nonrepeat regions. y axis is log2 scale. (G) Venn diagram of editing sites identified de novo and known editing sites used in this study.
Fig. 3.
Fig. 3.
RNA editing level differences between neuronal populations. (A) Pairwise comparisons of editing levels from three combined replicates of mmPCR-seq or RNA-seq between 10 populations. Red and blue dots are editing sites that differ by >20% editing between populations with P < 0.05 (Fisher’s exact tests), and gray dots are sites with <20% editing change. Dark gray dots are representative biological replicates of each population. (B) The number of editing sites that are more highly or lowly edited in each population listed on the left compared with all other populations. Shades of blue and red represent the number of populations in which each site differs in pairwise comparisons. (C) Adar mRNA normalized read counts from RNA-seq of each population. Each dot is one replicate with bars representing the mean. *P < 0.05 (Wald test). (D) Editing levels at the Adar auto-editing site at chrX:1781840 in all populations. Each dot is one replicate, with bars representing the mean. ***P < 0.001 (Fisher’s exact test) and editing change >20%.
Fig. 4.
Fig. 4.
Population-specific editing level differences. Average z score of replicate editing levels at sites where one population shows a population-specific decrease in editing (A) or a population-specific increase in editing (B) is shown. *Genes are involved in ion transport.
Fig. 5.
Fig. 5.
Coregulation of proximal editing sites. (A) Editing levels across all replicates of all populations at a cluster of two editing sites in sli with Fru in blue. ***P < 0.001 (Welch’s t tests). Bars represent median of all replicates. (B) The percentage of total transcripts using each possible editing isoform at the two sites in all populations. ***P < 0.001 (Welch’s t tests) and mean difference > 10%. (C) Observed and expected isoform usage in Fru neurons. ***P < 0.001 (Student’s t tests). (D) Tukey’s boxplots of the difference between the observed and expected isoform usage for four isoforms in six clusters of coregulated sites in all populations. (E) Editing levels across all replicates of all populations at a cluster of three editing sites in para, with Crz in green. **P < 0.01; **P < 0.001 (Welch’s t test). (F) The percentage of total transcripts using each possible editing isoform at the three sites in all populations. **P < 0.01; ***P < 0.001 (Welch’s t tests) with mean difference > 10%. (G) The observed and expected isoform usage in Crz neurons. *P < 0.05; **P < 0.01; ***P < 0.001 (Student’s t tests). (H) A model for editing at the cluster of three sites showing editing at the first site is critical for editing at the other sites in the cluster.
Fig. 6.
Fig. 6.
Coregulation of RNA editing in related proteins. (A) RNA editing levels at sites within transcripts encoding calcium-gated ion-channel subunits, Ca-α1D, cac, and CG4587, with Crz in green. (B) RNA editing levels at sites within transcripts encoding sodium leak channel components, na and Unc80. (C) RNA editing levels at sites within transcripts encoding nAChR subunits, nAChRα6 (Tdc2 in yellow), nAChRα5, and nAChRα7. Bars are median editing of all populations. ***P < 0.001 (Welch’s t test). Location of amino acids affected by editing as determined by Uniprot (SI Appendix, Table S1) are marked on protein drawings, as numbered in transcripts above.
Fig. 7.
Fig. 7.
RNA editing in voltage-gated ion channels Para and Sh. (A) RNA editing levels at population-specific editing sites in paralytic. Crz is in green, and NPFR is in orange for significant sites. Bars are median editing levels of all populations. **P < 0.01; ***P < 0.001 (Welch’s t tests). Location of amino acids affected by editing are marked on protein drawings, as numbered in transcripts above. (B) Amino acid conservation within the S2 transmembrane domain of repeat I across voltage-gated sodium channels of five species with Tyr189 highlighted in green. (C) Ribbon diagram of the VSD (side view of S1–S4) of Para mapped onto the 3D structure of the homologous voltage-gated Na+ channel from Periplaneta Americana. Tyr176 (green) is homologous to D. melanogaster Tyr189. (C, Right) Magnification showing the potential interactions (dashed lines) of Tyr176 (in S2) with Thr149 (in S1) and Arg233 (in S4). (D) Same as in C, but reflecting the RNA editing of Tyr176 to Cys. Carbon atoms are gray or yellow. Oxygen, nitrogen, and sulfur atoms are in red, blue, and orange, respectively. Hydrogen atoms were removed for clarity. Numbers near dashed lines show distances in angstroms. (E) RNA editing levels at an editing site with population-specific editing in Shaker. (F) Amino acid conservation within the S6 transmembrane domain across voltage-gated potassium channels of five species with Ile464 highlighted in green. (G) Ribbon diagram of the pore domain of Shaker mapped onto the 3D structure of the R. norvegicus Kv1.2 voltage-gated K+ channel shown from the side, with the four identical subunits colored differently. PH, pore helix; SF, selectivity filter. (G, Right) Magnification showing Ile396 (homologous to Ile464) of the S6 segment and its potential van der Waals interactions with Leu331 and Leu335 of S5 in the adjacent subunit. (H) Same as in G, but reflecting the RNA editing of Ile396 to Val.

References

    1. Li W, et al. Activation of transposable elements during aging and neuronal decline in Drosophila. Nat Neurosci. 2013;16:529–531. - PMC - PubMed
    1. Perrat PN, et al. Transposition-driven genomic heterogeneity in the Drosophila brain. Science. 2013;340:91–95. - PMC - PubMed
    1. Wang Q, Abruzzi KC, Rosbash M, Rio DC. Striking circadian neuron diversity and cycling of Drosophila alternative splicing. eLife. 2018;7:e35618. - PMC - PubMed
    1. Bass BL. RNA editing by adenosine deaminases that act on RNA. Annu Rev Biochem. 2002;71:817–846. - PMC - PubMed
    1. Palladino MJ, Keegan LP, O’Connell MA, Reenan RA. A-to-I pre-mRNA editing in Drosophila is primarily involved in adult nervous system function and integrity. Cell. 2000;102:437–449. - PubMed

Publication types