

Gut bacterial tyrosine decarboxylases restrict levels of levodopa in the treatment of Parkinson's disease
- PMID: 30659181
- PMCID: PMC6338741
- DOI: 10.1038/s41467-019-08294-y
Gut bacterial tyrosine decarboxylases restrict levels of levodopa in the treatment of Parkinson's disease
Abstract
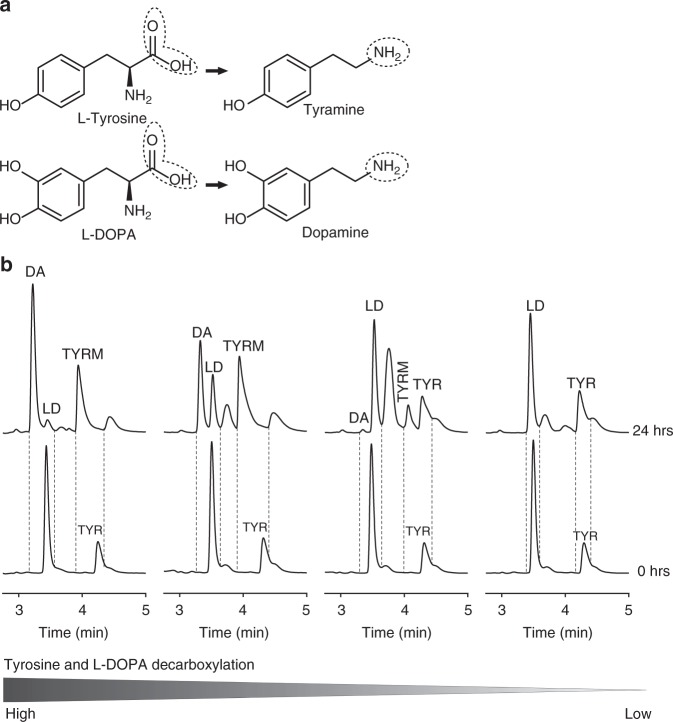
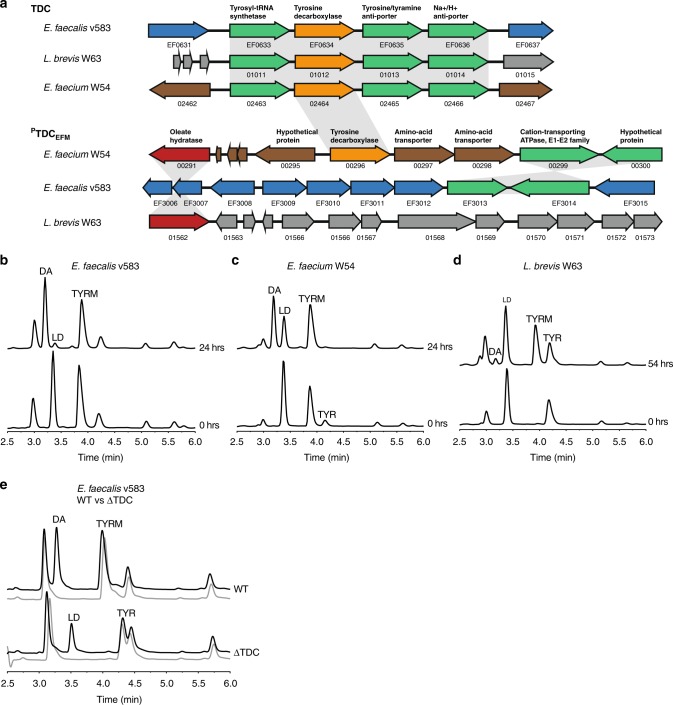
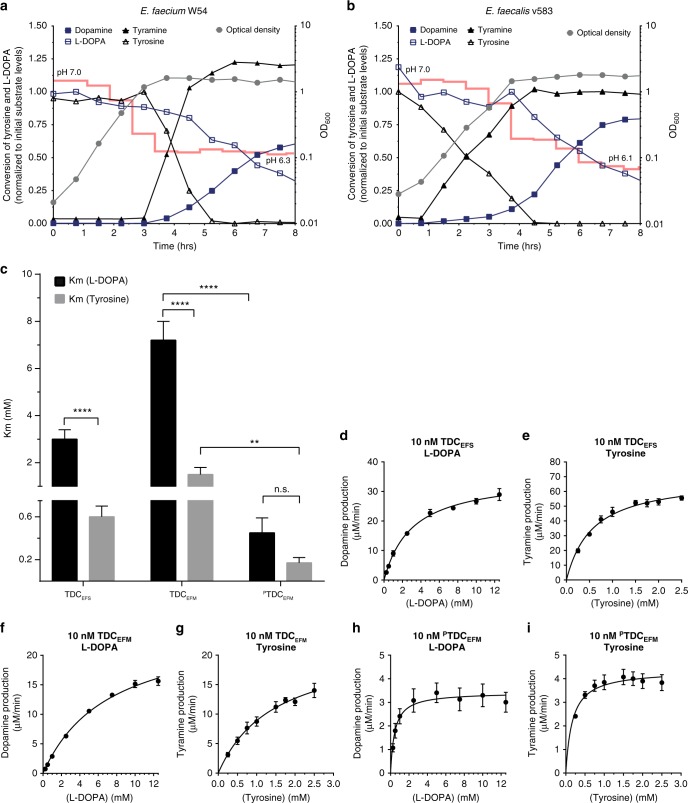
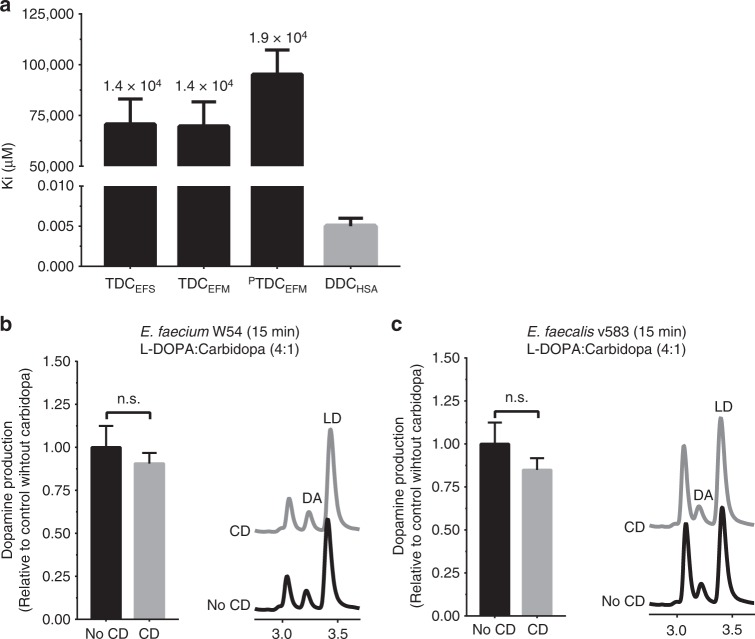
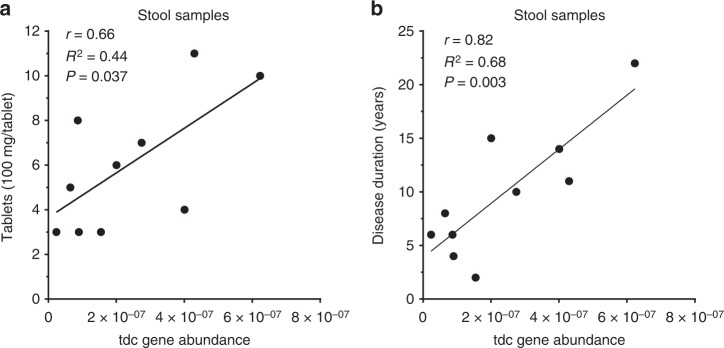
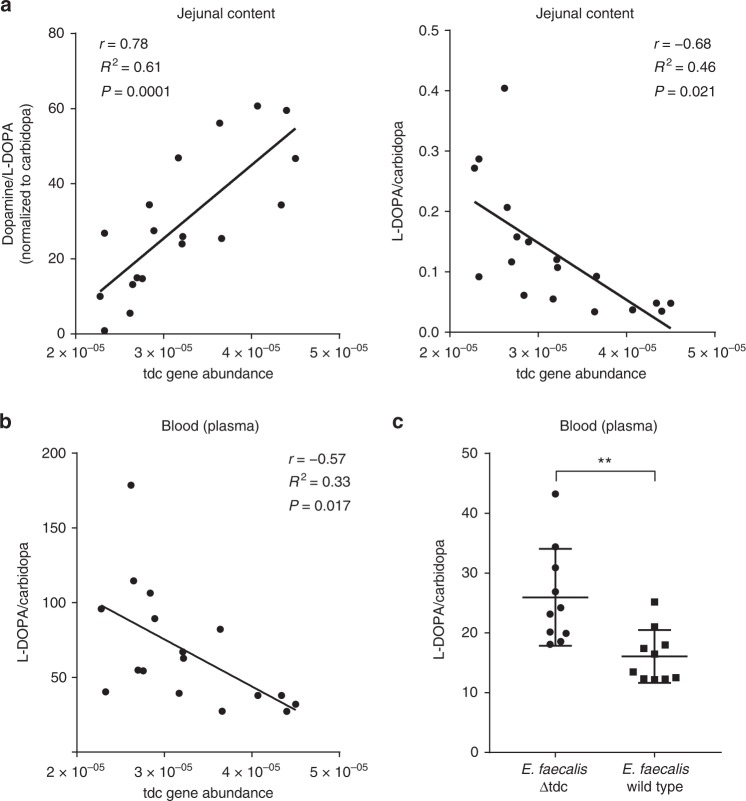
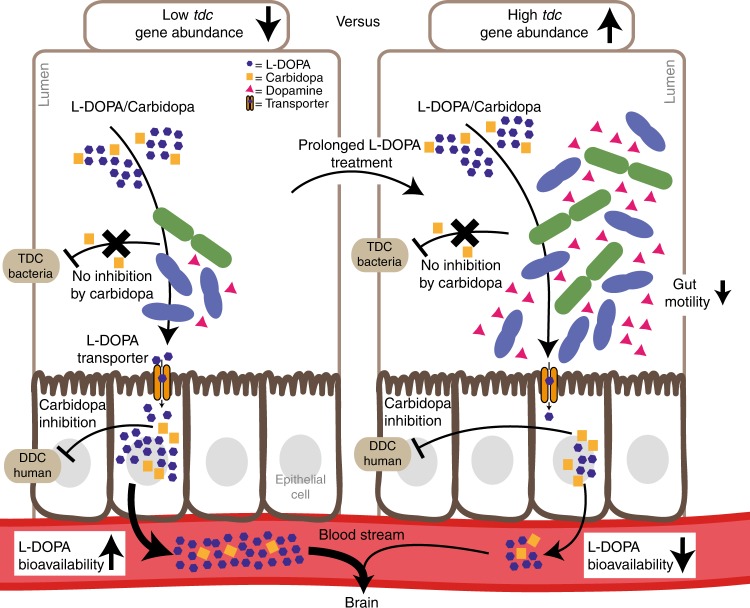
Human gut microbiota senses its environment and responds by releasing metabolites, some of which are key regulators of human health and disease. In this study, we characterize gut-associated bacteria in their ability to decarboxylate levodopa to dopamine via tyrosine decarboxylases. Bacterial tyrosine decarboxylases efficiently convert levodopa to dopamine, even in the presence of tyrosine, a competitive substrate, or inhibitors of human decarboxylase. In situ levels of levodopa are compromised by high abundance of gut bacterial tyrosine decarboxylase in patients with Parkinson's disease. Finally, the higher relative abundance of bacterial tyrosine decarboxylases at the site of levodopa absorption, proximal small intestine, had a significant impact on levels of levodopa in the plasma of rats. Our results highlight the role of microbial metabolism in drug availability, and specifically, that abundance of bacterial tyrosine decarboxylase in the proximal small intestine can explain the increased dosage regimen of levodopa treatment in Parkinson's disease patients.
Conflict of interest statement
The authors declare no competing interests.
Figures
Comment in
-
You shall not pass! Gut bacteria can convert levodopa to dopamine.Mov Disord. 2019 Jul;34(7):986. doi: 10.1002/mds.27737. Epub 2019 Jun 17. Mov Disord. 2019. PMID: 31206796 No abstract available.
-
The gut microbiota: A novel therapeutic target in Parkinson's disease?Parkinsonism Relat Disord. 2019 Sep;66:265-266. doi: 10.1016/j.parkreldis.2019.08.010. Epub 2019 Aug 12. Parkinsonism Relat Disord. 2019. PMID: 31445904 No abstract available.
Similar articles
-
Piperine improves levodopa availability in the 6-OHDA-lesioned rat model of Parkinson's disease by suppressing gut bacterial tyrosine decarboxylase.CNS Neurosci Ther. 2024 Feb;30(2):e14383. doi: 10.1111/cns.14383. Epub 2023 Aug 1. CNS Neurosci Ther. 2024. PMID: 37528534 Free PMC article.
-
Targeting bacterial and human levodopa decarboxylases for improved drug treatment of Parkinson's disease: Discovery and characterization of new inhibitors.Eur J Pharm Sci. 2025 Aug 1;211:107133. doi: 10.1016/j.ejps.2025.107133. Epub 2025 May 20. Eur J Pharm Sci. 2025. PMID: 40403986
-
Parkinson's Disease Medication Alters Small Intestinal Motility and Microbiota Composition in Healthy Rats.mSystems. 2022 Feb 22;7(1):e0119121. doi: 10.1128/msystems.01191-21. Epub 2022 Jan 25. mSystems. 2022. PMID: 35076270 Free PMC article.
-
COMT inhibition: a new treatment strategy for Parkinson's disease.Neurology. 1998 May;50(5 Suppl 5):S3-14. doi: 10.1212/wnl.50.5_suppl_5.s3. Neurology. 1998. PMID: 9591516 Review.
-
Relationship Between Gut Bacteria and Levodopa Metabolism.Curr Neuropharmacol. 2023;21(7):1536-1547. doi: 10.2174/1570159X21666221019115716. Curr Neuropharmacol. 2023. PMID: 36278467 Free PMC article. Review.
Cited by
-
Identification of volatile metabolites produced from levodopa metabolism by different bacteria strains of the gut microbiome.BMC Microbiol. 2024 Jul 13;24(1):260. doi: 10.1186/s12866-024-03373-7. BMC Microbiol. 2024. PMID: 38997651 Free PMC article.
-
Convergent pathways of the gut microbiota-brain axis and neurodegenerative disorders.Gastroenterol Rep (Oxf). 2022 May 16;10:goac017. doi: 10.1093/gastro/goac017. eCollection 2022. Gastroenterol Rep (Oxf). 2022. PMID: 35582476 Free PMC article. Review.
-
The Emerging Scenario of the Gut-Brain Axis: The Therapeutic Actions of the New Actor Kefir against Neurodegenerative Diseases.Antioxidants (Basel). 2021 Nov 20;10(11):1845. doi: 10.3390/antiox10111845. Antioxidants (Basel). 2021. PMID: 34829716 Free PMC article. Review.
-
From-Toilet-to-Freezer: A Review on Requirements for an Automatic Protocol to Collect and Store Human Fecal Samples for Research Purposes.Biomedicines. 2023 Sep 28;11(10):2658. doi: 10.3390/biomedicines11102658. Biomedicines. 2023. PMID: 37893032 Free PMC article. Review.
-
Commensal bacteria promote azathioprine therapy failure in inflammatory bowel disease via decreasing 6-mercaptopurine bioavailability.Cell Rep Med. 2023 Aug 15;4(8):101153. doi: 10.1016/j.xcrm.2023.101153. Cell Rep Med. 2023. PMID: 37586320 Free PMC article.
References
Publication types
MeSH terms
Substances
LinkOut - more resources
Full Text Sources
Other Literature Sources
Medical
Molecular Biology Databases
