. 2019 Jan 18;10(1):331.
doi: 10.1038/s41467-018-08191-w.

Combining LOPIT with differential ultracentrifugation for high-resolution spatial proteomics

Affiliations

Combining LOPIT with differential ultracentrifugation for high-resolution spatial proteomics

Aikaterini Geladaki et al. Nat Commun. .

Abstract

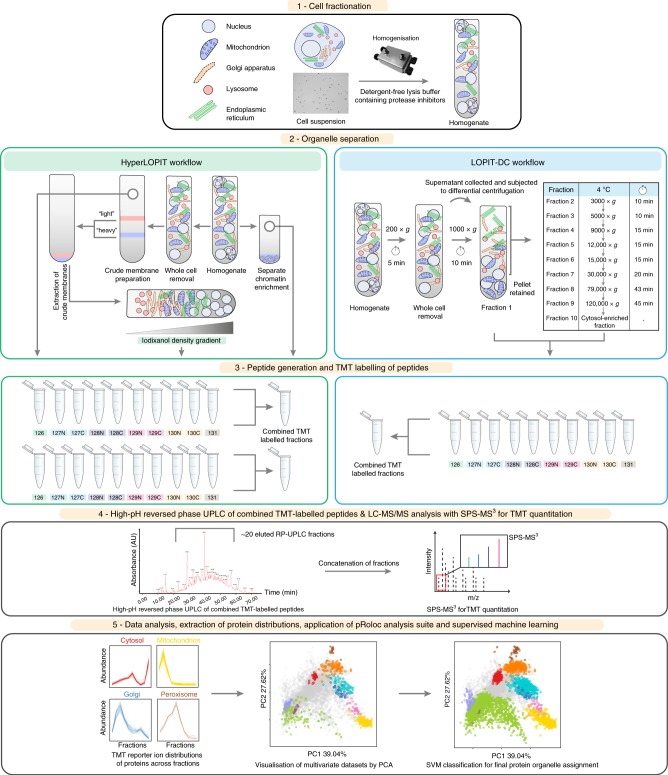
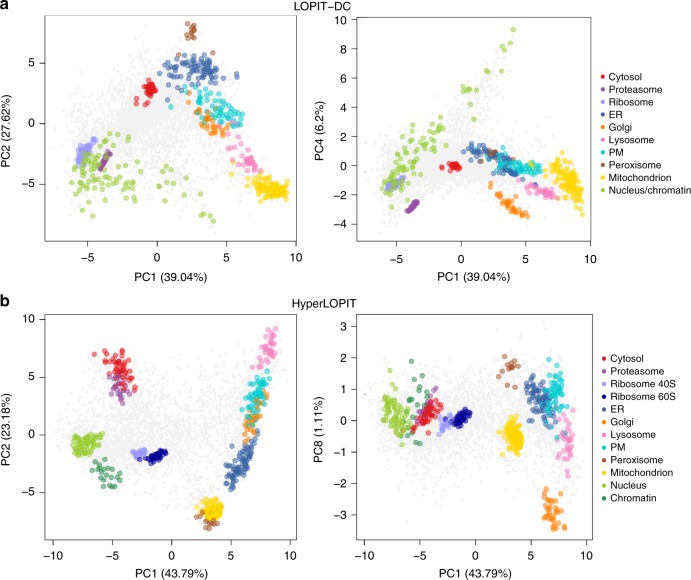
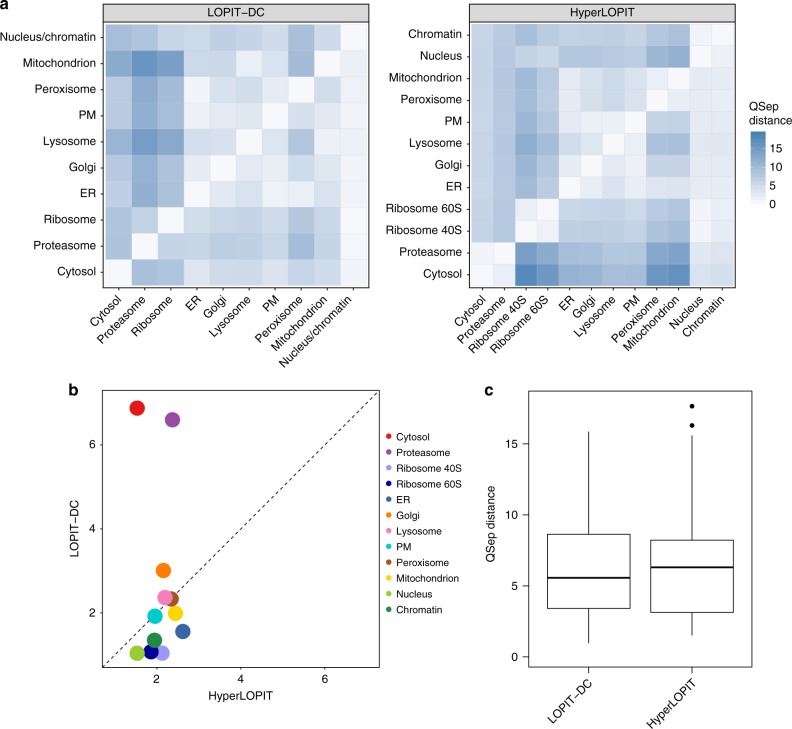
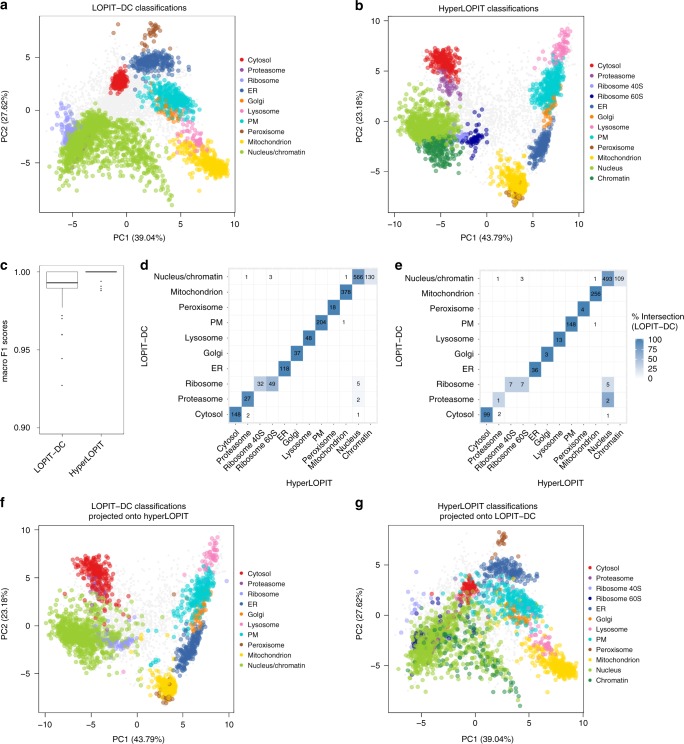
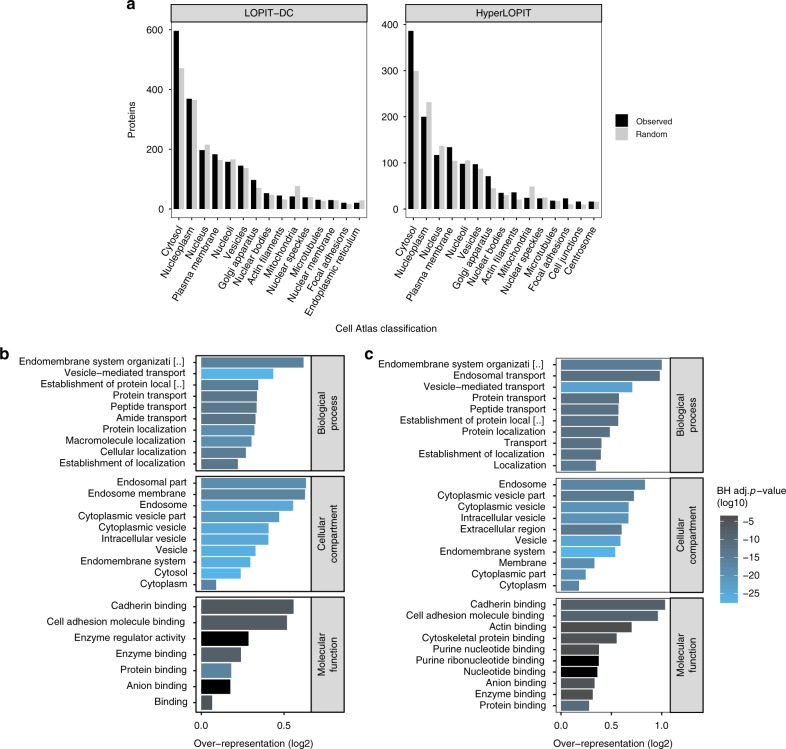
The study of protein localisation has greatly benefited from high-throughput methods utilising cellular fractionation and proteomic profiling. Hyperplexed Localisation of Organelle Proteins by Isotope Tagging (hyperLOPIT) is a well-established method in this area. It achieves high-resolution separation of organelles and subcellular compartments but is relatively time- and resource-intensive. As a simpler alternative, we here develop Localisation of Organelle Proteins by Isotope Tagging after Differential ultraCentrifugation (LOPIT-DC) and compare this method to the density gradient-based hyperLOPIT approach. We confirm that high-resolution maps can be obtained using differential centrifugation down to the suborganellar and protein complex level. HyperLOPIT and LOPIT-DC yield highly similar results, facilitating the identification of isoform-specific localisations and high-confidence localisation assignment for proteins in suborganellar structures, protein complexes and signalling pathways. By combining both approaches, we present a comprehensive high-resolution dataset of human protein localisations and deliver a flexible set of protocols for subcellular proteomics.


Conflict of interest statement

The authors declare no competing interests.

Figures

Fig. 1
Fig. 1
Overview of the hyperLOPIT (left) and LOPIT-DC (right) workflows. LOPIT is a quantitative mass spectrometry-based method used for the separation of organelles and other subcellular compartments. The workflows differ in step 2 (organelle separation): hyperLOPIT is based on equilibrium density gradient ultracentrifugation from a crude membrane preparation, while LOPIT-DC utilises differential ultracentrifugation following removal of unlysed cells. In addition, hyperLOPIT includes a separate chromatin enrichment step. Both workflows take advantage of multiplex TMT-labelling (step 3) to reduce mass spectrometry analysis time and technical variability and SPS-MS3 for accurate quantification (step 4). Data analysis for both workflows is performed using pRoloc (step 5)
Fig. 2
Fig. 2
LOPIT-DC resolves all major subcellular niches. a, b Principal component analysis (PCA) projections for the LOPIT-DC (a) and hyperLOPIT (b) datasets. Subcellular marker proteins are highlighted as indicated and multiple principal components are presented to display resolution of all compartment clusters. Percentage variance explained by component is shown in parentheses
Fig. 3
Fig. 3
LOPIT-DC provides a high-resolution map of protein subcellular localisation. a QSep distances between all pairs of compartments in the LOPIT-DC (left) and hyperLOPIT (right) data. Ten organelle classes were used in the case of the LOPIT-DC data and 12 in the case of the hyperLOPIT dataset. b Comparison between LOPIT datasets of the minimum QSep distances for each of the 12 subcellular compartments. c Overall distribution of QSep distances for the LOPIT-DC and hyperLOPIT data. For each boxplot, the line in the middle of the box is the median value, the vertical size of the box represents the interquartile range (IQR) and the whiskers represent the extremes of the data (defined as those that do not exceed 1.5 × IQR from the middle of the data, and if no points exceed that distance, then the whiskers are simply the minimum and maximum values)
Fig. 4
Fig. 4
LOPIT-DC protein localisation classifications agree with hyperLOPIT. a, b PCA plots displaying SVM classification results after applying a 5% FDR cutoff for the LOPIT-DC (a) and hyperLOPIT (b) datasets. c Optimisation results (macro F1 scores) from SVM classification. For each boxplot, the line in the middle of the box is the median value, the vertical size of the box represents the interquartile range (IQR) and the whiskers represent the extremes of the data (defined as those that do not exceed 1.5 × IQR from the middle of the data, and if no points exceed that distance, then the whiskers are simply the minimum and maximum values). d Overlap between the LOPIT-DC and hyperLOPIT protein subcellular localisation assignments (including markers), where the LOPIT-DC dataset is classified using 10 marker classes and the percentage intersection is calculated relative to the number of proteins classified by compartment in the LOPIT-DC data. e As per d but excluding markers. f, g LOPIT-DC classifications projected onto the hyperLOPIT PCA (f) and vice versa (g). Proteins which were identified by both LOPIT-DC and hyperLOPIT are shown
Fig. 5
Fig. 5
Transfer learning using the hyperLOPIT and LOPIT-DC data as main and auxiliary sources. (left) Optimisation of transfer learning weighting. Numbers in bubbles represent frequencies obtained for each weight over 100 iterations; (right) F1 scores for the LOPIT-DC dataset, hyperLOPIT dataset and the combination of the two. For each boxplot, the line in the middle of the box is the median value, the vertical size of the box represents the interquartile range (IQR) and the whiskers represent the extremes of the data (defined as those that do not exceed 1.5 × IQR from the middle of the data, and if no points exceed that distance, then the whiskers are simply the minimum and maximum values)
Fig. 6
Fig. 6
The LOPIT unclassified proteome reveals proteins with multiple locations. a Cell Atlas database-derived subcellular location for proteins that remained unclassified in the LOPIT-DC and hyperLOPIT data. Grey bars represent the expectation from a random selection of the same number of proteins. Only the top 15 most frequent localisations are shown. b, c GO terms over-represented in the unclassified proteins for LOPIT-DC (b) and hyperLOPIT (c). Only the top 10 most over-represented terms per category are shown. BH adj. p-value = Benjamini-Hochberg adjusted p-value for over-representation
Fig. 7
Fig. 7
Suborganellar structures, complexes and pathways in the LOPIT-DC and hyperLOPIT data. a ER-lumen, ER-membrane and ERGIC/cis-Golgi markers plotted upon the LOPIT-DC and hyperLOPIT datasets with assigned proteins. b COP9 signalosome, snRNPs, ATP synthase, signal peptidase, SUMO-activating enzyme, OST complex and Origin Recognition Complex plotted upon the LOPIT-DC and hyperLOPIT datasets with assigned proteins. c Ten proteins involved in p53 signalling plotted upon the LOPIT-DC and hyperLOPIT datasets with assigned proteins

References

    1. Gauthier DJ, Lazure C. Complementary methods to assist subcellular fractionation in organellar proteomics. Expert. Rev. Proteom. 2008;5:603–617. doi: 10.1586/14789450.5.4.603. - DOI - PubMed
    1. Larance M, Lamond AI. Multidimensional proteomics for cell biology. Nat. Rev. Mol. Cell Biol. 2015;16:269–280. doi: 10.1038/nrm3970. - DOI - PubMed
    1. Sun Z. A genetic screen in zebrafish identifies cilia genes as a principal cause of cystic kidney. Development. 2004;131:4085–4093. doi: 10.1242/dev.01240. - DOI - PubMed
    1. Broadhead R, et al. Flagellar motility is required for the viability of the bloodstream trypanosome. Nature. 2006;440:224–227. doi: 10.1038/nature04541. - DOI - PubMed
    1. Keller LC, Romijn EP, Zamora I, Yates JR, Marshall WF. Proteomic analysis of isolated Chlamydomonas centrioles reveals orthologs of ciliary-disease genes. Curr. Biol. 2005;15:1090–1098. doi: 10.1016/j.cub.2005.05.024. - DOI - PubMed

Publication types