

Gene activated adipose tissue fragments as advanced autologous biomaterials for bone regeneration: osteogenic differentiation within the tissue and implications for clinical translation
- PMID: 30659209
- PMCID: PMC6338750
- DOI: 10.1038/s41598-018-36283-6
Gene activated adipose tissue fragments as advanced autologous biomaterials for bone regeneration: osteogenic differentiation within the tissue and implications for clinical translation
Abstract
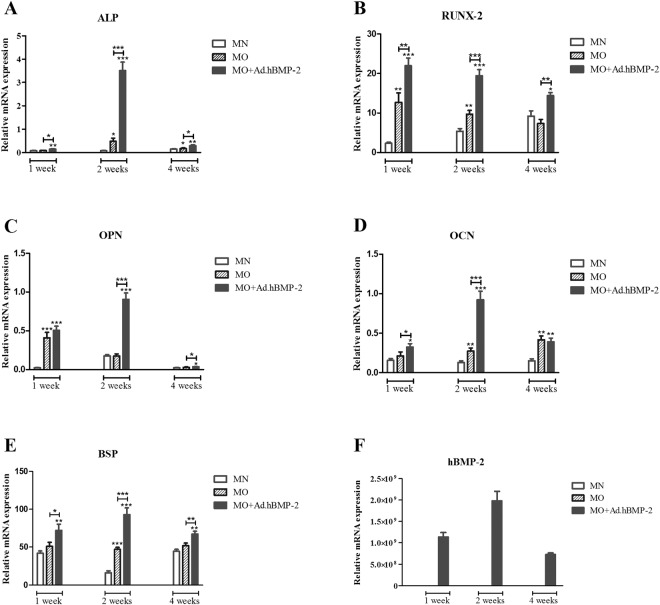
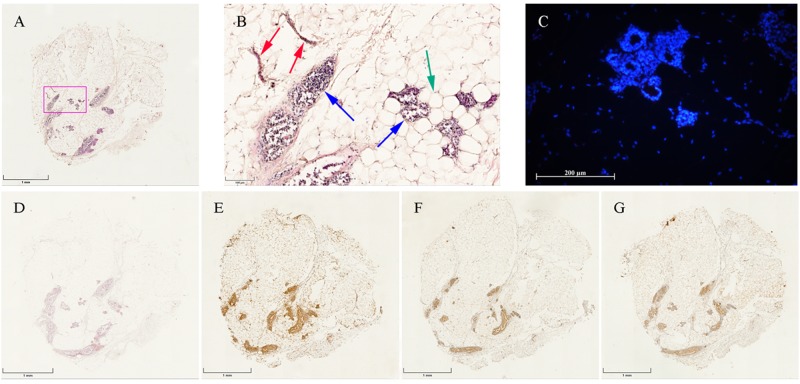
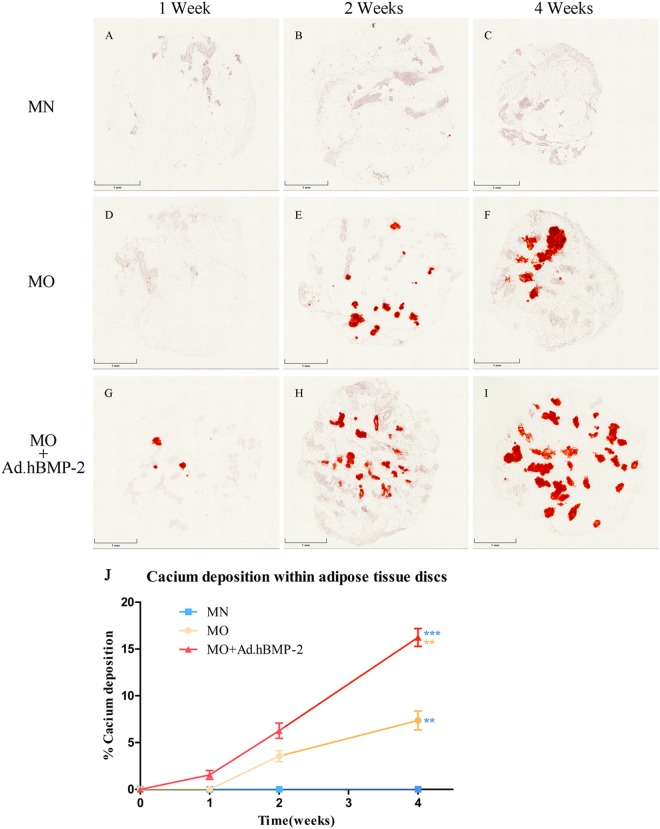
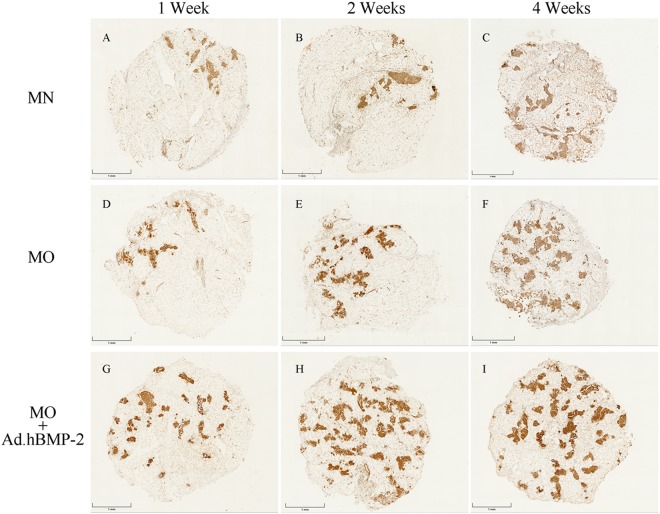
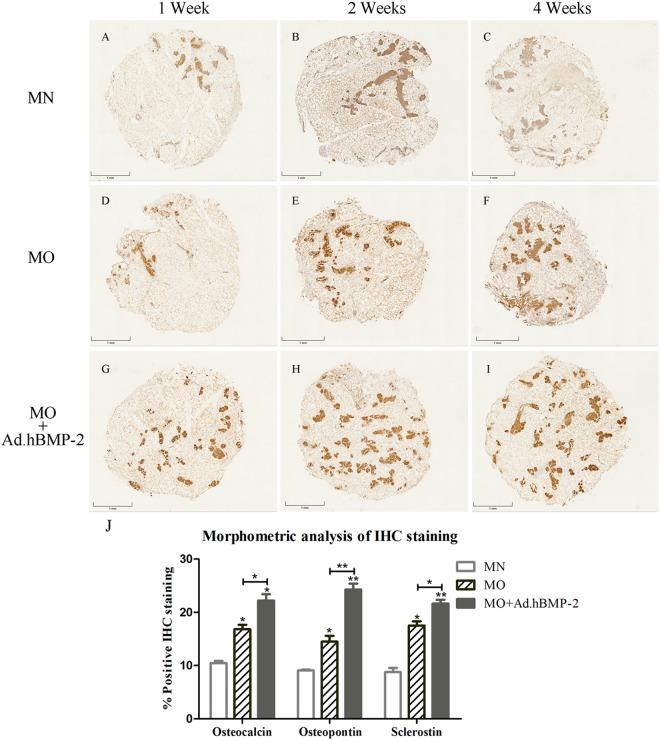
Cost-effective, expedited approaches for bone regeneration are urgently needed in an ageing population. Bone Morphogenetic Proteins (BMPs) stimulate osteogenesis but their efficacy is impeded by their short half-life. Delivery by genetically modified cells can overcome this problem. However, cell isolation and propagation represent significant obstacles for the translation into the clinic. Instead, complete gene activated fragments of adipose tissue hold great potential for bone repair. Here, using an in-vitro culture system, we investigated whether adenoviral transduction with human BMP-2 can promote osteogenic differentiation within adipose tissue fragments. Osteoinduction in adipose tissue fragments was evaluated by quantitative reverse transcriptase polymerase chain reaction, immunohistology and histomorphometry. BMP-2 transduced adipose tissue synthesized BMP-2 protein over 30 days peaking by day six, which significantly promoted osteogenic differentiation as indicated by increased calcium depositions, up-regulation of bone marker genes, and bone-related protein expression. Our results demonstrate that cells within adipose tissue fragments can differentiate osteogenically after BMP-2 transduction of cells on the surface of the adipose tissue. BMP-2 gene activated adipose tissue represents an advanced osteo-regenerative biomaterial that can actively contribute to osteogenesis and potentially enable the development of a novel, cost-effective, one-step surgical approach to bone repair without the need for cell isolation.
Conflict of interest statement
C.T. and M.S. are shareholders of Sirion Biotech GmbH. Sirion Biotech GmbH generated the adenoviral gene transfer vectors used in this study. All other authors declare no conflict of interest.
Figures


Similar articles
-
Bone morphogenetic protein-2 is a stronger inducer of osteogenesis within muscle tissue than heterodimeric bone morphogenetic protein-2/6 and -2/7: Implications for expedited gene-enhanced bone repair.J Gene Med. 2018 Sep;20(9):e3042. doi: 10.1002/jgm.3042. Epub 2018 Jul 24. J Gene Med. 2018. PMID: 29953687
-
Osteoinduction within BMP-2 transduced muscle tissue fragments with and without a fascia layer: implications for bone tissue engineering.Gene Ther. 2019 Feb;26(1-2):16-28. doi: 10.1038/s41434-018-0047-2. Epub 2018 Oct 27. Gene Ther. 2019. PMID: 30368527
-
Gene-activated tissue grafts for sustained bone morphogenetic protein-2 delivery and bone engineering: Is muscle with fascia superior to muscle and fat?J Tissue Eng Regen Med. 2018 Apr;12(4):1002-1011. doi: 10.1002/term.2575. Epub 2017 Nov 22. J Tissue Eng Regen Med. 2018. PMID: 28940796
-
Using genes to facilitate the endogenous repair and regeneration of orthopaedic tissues.Int Orthop. 2014 Sep;38(9):1761-9. doi: 10.1007/s00264-014-2423-x. Epub 2014 Jul 20. Int Orthop. 2014. PMID: 25038968 Free PMC article. Review.
-
An ossifying landscape: materials and growth factor strategies for osteogenic signalling and bone regeneration.Curr Opin Biotechnol. 2022 Feb;73:355-363. doi: 10.1016/j.copbio.2021.10.010. Epub 2021 Nov 1. Curr Opin Biotechnol. 2022. PMID: 34735985 Review.
Cited by
-
Adipose tissue in bone regeneration - stem cell source and beyond.World J Stem Cells. 2022 Jun 26;14(6):372-392. doi: 10.4252/wjsc.v14.i6.372. World J Stem Cells. 2022. PMID: 35949397 Free PMC article. Review.
-
Adipocyte-Based Cell Therapy in Oncology: The Role of Cancer-Associated Adipocytes and Their Reinterpretation as Delivery Platforms.Pharmaceutics. 2020 Apr 28;12(5):402. doi: 10.3390/pharmaceutics12050402. Pharmaceutics. 2020. PMID: 32354024 Free PMC article. Review.
-
Global trends in clinical trials involving engineered biomaterials.Sci Adv. 2024 Jul 19;10(29):eabq0997. doi: 10.1126/sciadv.abq0997. Epub 2024 Jul 17. Sci Adv. 2024. PMID: 39018412 Free PMC article. Review.
-
Osteogenic Differentiation of Human Adipose-Derived Stem Cells Seeded on a Biomimetic Spongiosa-like Scaffold: Bone Morphogenetic Protein-2 Delivery by Overexpressing Fascia.Int J Mol Sci. 2022 Feb 28;23(5):2712. doi: 10.3390/ijms23052712. Int J Mol Sci. 2022. PMID: 35269855 Free PMC article.
-
Impact of High-Altitude Hypoxia on Bone Defect Repair: A Review of Molecular Mechanisms and Therapeutic Implications.Front Med (Lausanne). 2022 May 10;9:842800. doi: 10.3389/fmed.2022.842800. eCollection 2022. Front Med (Lausanne). 2022. PMID: 35620712 Free PMC article. Review.
References
Publication types
MeSH terms
Substances
LinkOut - more resources
Full Text Sources
Medical
