. 2019 Jan 18;9(1):226.
doi: 10.1038/s41598-018-36194-6.

Arx Expression Suppresses Ventralization of the Developing Dorsal Forebrain

Affiliations

Arx Expression Suppresses Ventralization of the Developing Dorsal Forebrain

Youngshin Lim et al. Sci Rep. .

Abstract

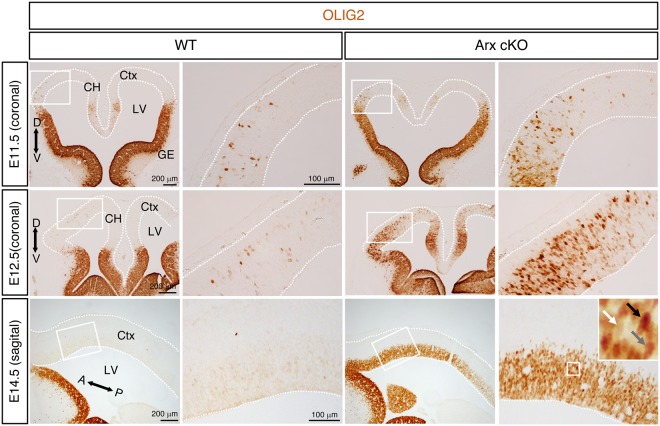
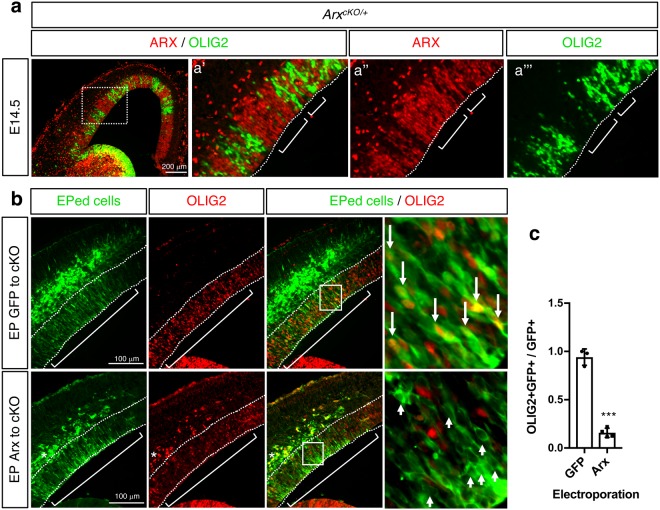
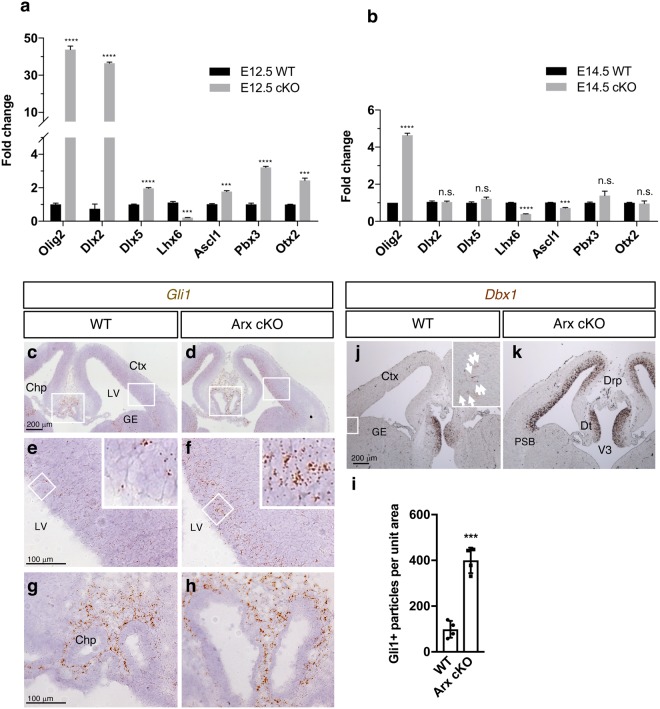
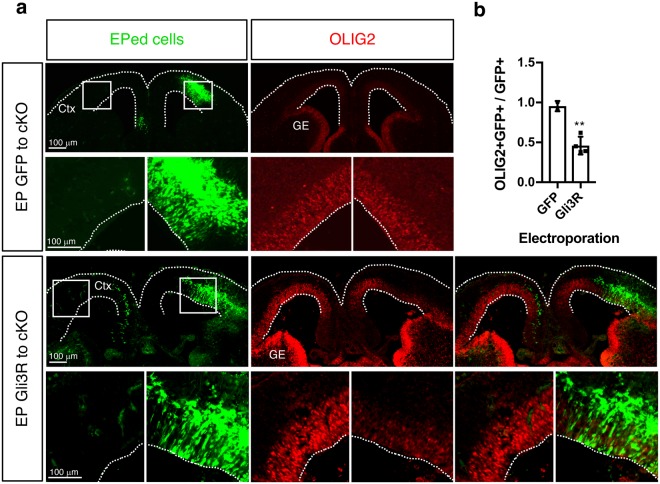
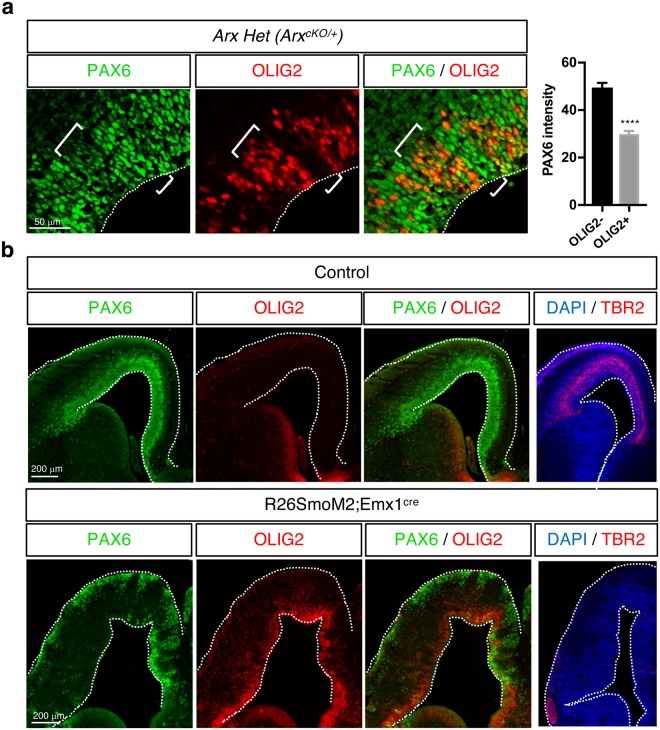
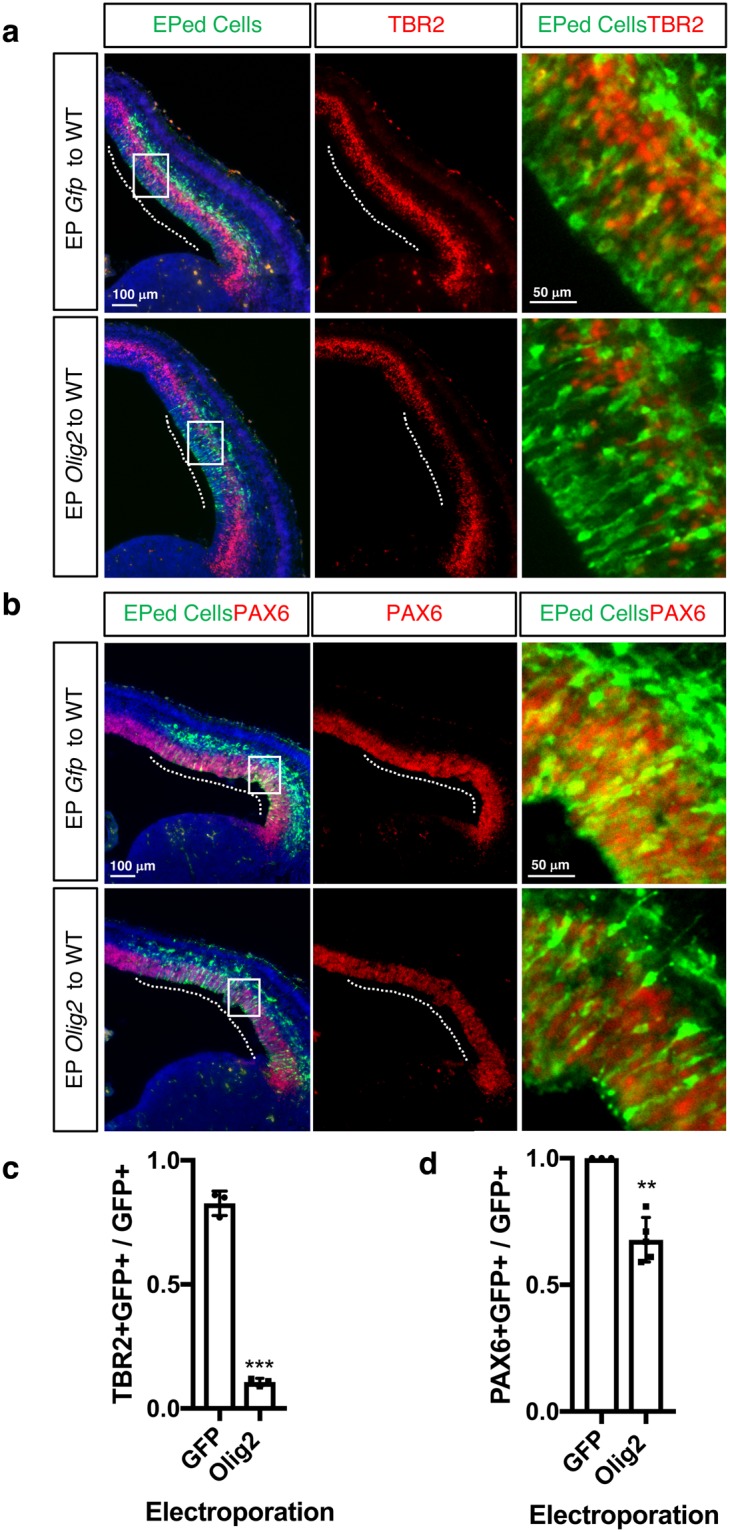
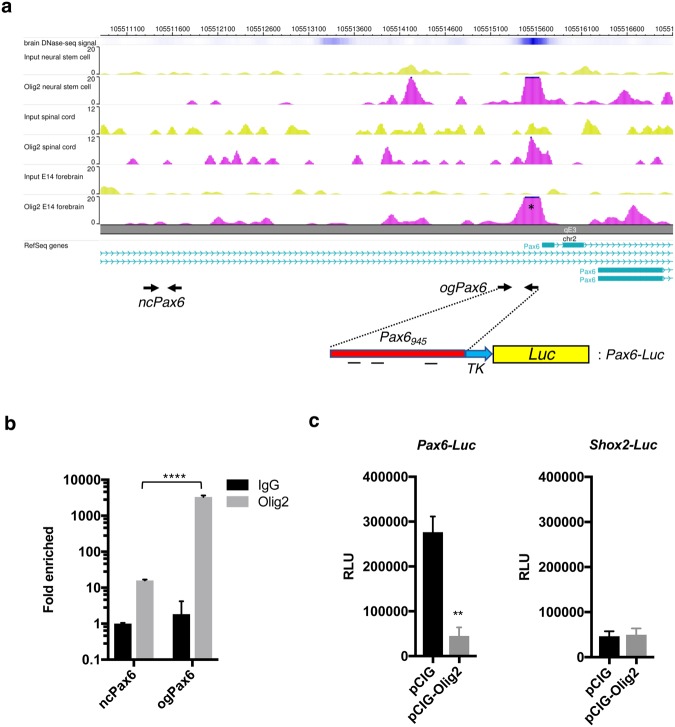
Early brain development requires a tight orchestration between neural tube patterning and growth. How pattern formation and brain growth are coordinated is incompletely understood. Previously we showed that aristaless-related homeobox (ARX), a paired-like transcription factor, regulates cortical progenitor pool expansion by repressing an inhibitor of cell cycle progression. Here we show that ARX participates in establishing dorsoventral identity in the mouse forebrain. In Arx mutant mice, ventral genes, including Olig2, are ectopically expressed dorsally. Furthermore, Gli1 is upregulated, suggesting an ectopic activation of SHH signaling. We show that the ectopic Olig2 expression can be repressed by blocking SHH signaling, implicating a role for SHH signaling in Olig2 induction. We further demonstrate that the ectopic Olig2 accounts for the reduced Pax6 and Tbr2 expression, both dorsal specific genes essential for cortical progenitor cell proliferation. These data suggest a link between the control of dorsoventral identity of progenitor cells and the control of their proliferation. In summary, our data demonstrate that ARX functions in a gene regulatory network integrating normal forebrain patterning and growth, providing important insight into how mutations in ARX can disrupt multiple aspects of brain development and thus generate a wide spectrum of neurodevelopmental phenotypes observed in human patients.


Conflict of interest statement

The authors declare no competing interests.

Figures

Figure 1
Figure 1
Olig2 is ectopically expressed in Arx-deficient cortical epithelium. Representative images of embryonic neocortex of the Arx+/y (WT) and ArxcKO/y (Arx cKO) mice at E11.5, E12.5 (coronal sections) and E14.5 (sagittal sections) immunolabeled with OLIG2 antibody. White boxed areas in the left panels are displayed as magnified images in the right panels. Dotted lines mark the boundaries of the neural tube. A-P and D-V indicate anterior-posterior and dorsal-ventral axes, respectively. Three arrows in the inset (magnified image of the boxed area) of the right-bottom panel indicate cells with variable levels of OLIG2 expression (white, low; gray, intermediate; black, high). CH, cortical hem; Ctx, neocortex; GE, ganglionic eminence.
Figure 2
Figure 2
ARX represses OLIG2 expression. (a) Representative images of embryonic neocortex (E14.5) of the ArxcKO/+ female (Arx Het) double immunolabeled with OLIG2 and ARX antibodies (a’a”’: magnified images of the boxed area in left panel). ARX+ cells are OLIG2−, and OLIG2+ cells are Arx−. Dotted lines mark the ventricular surface. Longer brackets indicate example areas with high number of ARX+ cells, while shorter brackets denote areas with high number of OLIG2+ cells. (b) Representative images of the immunofluorescent labeling (GFP and OLIG2) of the ArxcKO/y cortex electroporated with either pCIG (encoding GFP only) or pCIG-Arx (encoding ARX-IRES-GFP) (EP at E13.5 and harvested at E14.5). GFP antibody was used to label electroporated (EPed) cells (green, cytoplasmic staining pattern). Right most images are magnified images of the boxed areas. Long arrows indicate examples of GFP electroporated cells expressing OLIG2 and short arrows indicate examples of ARX electroporated cells not expressing OLIG2. (c) Quantification of results in B. The ratio of OLIG2+ GFP+ cells over GFP+ cells was plotted for both GFP (pCIG) and Arx (pCIP-Arx) electroporated samples. Error bars: mean ± s.d (n = 3 for GFP EP and n = 4 for Arx EP; ***P = 0.0008; unpaired t-test).
Figure 3
Figure 3
Dorsal forebrain is partially ventralized in Arx cKO mice. (a) Real-time quantitative PCR (qPCR) results for ventral forebrain markers in the embryonic cortices of E12.5 (a) and E14.5 (b) WT and ArxcKO/y mice. Error bars: mean ± s.e.m (n = 3 per sample from two litters; ****P < 0.0001; ***P < 0.0005; *P = 0.0268; n.s., not significant; unpaired t-test). (ch) Representative images of RNA in situ hybridization of Gli1 (downstream target of SHH signaling) in WT (c,e,g) and ArxcKO/y (d,f,h) embryonic brain (E13.5). (e,f) are magnified images of the smaller boxes in (c,d), while (g,h) are magnified images of the bigger boxes in (c,d). (i) Quantification of Gli1 RNA in situ hybridization. Error bars: mean ± s.d (n = 4 sections for each genotype; ***P = 0.0002; unpaired t-test). (jk), Representative images of RNA in situ hybridization of Dbx1(marker for pallial-subpallial boundary, PSB) in WT (j) or ArxcKO/y (k) embryonic brain (E13.5). White arrows in j indicate Dbx1 positive cells in PSB. Insets in (e,f,j) are magnified images of the boxed areas. Ctx, neocortex; Drp, diencephalic roof plate; DT, dorsal thalamus; GE, ganglionic eminence; PSB, pallial-subpallial boundary; V3, third ventricle.
Figure 4
Figure 4
GLI3R can repress Olig2 induction in ArxcKO/y cortex. (a) Representative images of the E14.5 ArxcKO/y cortex electroporated with a control GFP (pCIG)or Gli3R expression construct (pCIG-Gli3R) at E12.5 and double immunolabeled with GFP (green, EPed cells) and OLIG2 (red). The lower panels are magnified images of the boxed areas in the upper panels. Dotted lines mark the outlines of the sections. (b) Quantification of results in (a). The ratio of OLIG2+ GFP+ cells over GFP+ cells was plotted for both GFP and Gli3R electroporated samples. Error bars: mean ± s.d (n = 4 sections from two embryos per genotype; **P = 0.0034; unpaired t-test). CTX, embryonic neocortex; GE, ganglionic eminence.
Figure 5
Figure 5
OLIG2 expressing cells have lower level of PAX6 and TBR2. (a) Representative images of PAX6 and OLIG2 double immunolabeling of Arx Het (ArxcKO/+) forebrain (E14.5). Longer brackets indicate areas with low PAX6 and high ARX, while shorter brackets mark areas with high PAX6 and no ARX. The quantification of PAX6 intensity in OLIG2+ or OLIG2- cells is shown in the graph. Error bars: mean ± s.e.m (n = 59 cells for WT; n = 153 cells for ArxcKO/+; ****P < 0.0001; unpaired t-test). (b) Representative images of PAX6 and OLIG2 double immunolabeling, or TBR2 immunolabeling of control or R26SmoM2; Emx1cre embryonic cortex (E14.5).
Figure 6
Figure 6
Forced expression of Olig2 represses Pax6 and Tbr2 expression. (a,b) Representative images of the immunofluorescent labeling of the WT embryonic cortex electroporated with a control GFP (pCIG) or Olig2 expression construct (pCIG-Olig2) (E13.5 → E14.5). Antibodies against GFP (green) and TBR2 (red) (a) or PAX6 (red) (b) were used. The number of PAX6+ and TBR2+ cells are reduced in the Olig2 electroporated cortices compared to the control. (c,d) Quantification of results in a (c) and b (d). The ratio of TBR2+ GFP+ or PAX6+ GFP+ cells over GFP+ cells was plotted for GFP or Olig2 electroporated brains. Error bars: mean ± s.d (For Tbr2, n = 3 for each sample; ***P = 0.0007; For Pax6, n = 3 for GFP; n = 5 for Olig2; **P = 0.0012; unpaired t-test).
Figure 7
Figure 7
OLIG2 directly represses Pax6 transcription. (a) OLIG2-ChIP-seq assay identified putative OLIG2 binding region (pink, marked with *) in Pax6 genomic sequence upstream to transcription start site. Arrows labeled as ncPax6 and ogPax6 indicate the locations of two primer pairs, ncPax6 (negative control primers away from OLIG2 binding region) and ogPax6 (experimental primers from OLIG2 binding region), respectively, used for OLIG2-ChIP-qPCR in b. The schematic diagram below the arrow depicts Pax6-Luc reporter construct used in c. Within the 945 bp Pax6 genomic sequence (red, Pax6945), there are three putative consensus bHLH TF binding sites. (b) ChIP-qPCR results using two different proteins, IgG and OLIG2, for ChIP experiment, and two different primer sets, ncPax6 and ogPax6, for subsequent qPCR. Error bars: mean ± s.d (n = 3; ****P < 0.0001; unpaired t-test). IgG and ncPax6 were used for negative control. (c) Quantification of reporter gene assays testing the effects of OLIG2 (pCIG-Olig2) and GFP (pCIG, control) on Pax6-Luc and Shox2a-Luc (control) reporter constructs. Error bars: mean ± s.d (n = 3; **P = 0.0027; unpaired t-test).

Similar articles

Cited by

References

    1. Greig LC, Woodworth MB, Galazo MJ, Padmanabhan H, Macklis JD. Molecular logic of neocortical projection neuron specification, development and diversity. Nat. Rev. Neurosci. 2013;14:755–769. doi: 10.1038/nrn3586. - DOI - PMC - PubMed
    1. Han W, Šestan N. Cortical projection neurons: sprung from the same root. Neuron. 2013;80:1103–1105. doi: 10.1016/j.neuron.2013.11.016. - DOI - PMC - PubMed
    1. Xu Q, et al. Origins of cortical interneuron subtypes. J Neurosci. 2004;24:2612–2622. doi: 10.1523/JNEUROSCI.5667-03.2004. - DOI - PMC - PubMed
    1. Marín O, Müller U. Lineage origins of GABAergic versus glutamatergic neurons in the neocortex. Current Opinion in Neurobiology. 2014;26:132–141. doi: 10.1016/j.conb.2014.01.015. - DOI - PMC - PubMed
    1. Martynoga B, Drechsel D, Guillemot F. Molecular control of neurogenesis: a view from the mammalian cerebral cortex. Cold Spring Harbor Perspectives in Biology. 2012;4:a008359–a008359. doi: 10.1101/cshperspect.a008359. - DOI - PMC - PubMed

Publication types

MeSH terms