Common neural processes during action-stopping and infrequent stimulus detection: The frontocentral P3 as an index of generic motor inhibition
- PMID: 30659867
- PMCID: PMC6640083
- DOI: 10.1016/j.ijpsycho.2019.01.004
Common neural processes during action-stopping and infrequent stimulus detection: The frontocentral P3 as an index of generic motor inhibition
Abstract
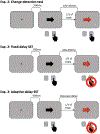
The stop-signal task (SST) is used to study action-stopping in the laboratory. In SSTs, the P3 event-related potential following stop-signals is considered to be a neural index of motor inhibition. However, a similar P3 deflection is often observed following infrequent events in non-inhibition tasks. Moreover, within SSTs, stop-signals are indeed infrequent events, presenting a systematic confound that hampers the interpretation of the stop-signal P3 (and other candidate neural indices of motor inhibition). Therefore, we performed two studies to test whether the stop-signal P3 is uniquely related to motor inhibition or reflects infrequency detection. In Study 1, participants completed the SST and a visually identical change-detection task requiring the detection of a task-relevant, frequent signal (but not motor inhibition). We observed a P3 associated with motor inhibition in the SST, but no such positivity in the change-detection task. In Study 2, we modified the change-detection task. Some task-relevant events were now infrequent, matching the frequency of stop-signals in the SST. These events indeed evoked a P3, though of smaller amplitude than the P3 in the SST. Independent component analysis suggested that stop-signal P3 and infrequency-P3 ERPs were non-independent and shared a common neural generator. Further analyses suggested that this common neural process likely reflects motor inhibition in both tasks: infrequent events in the change-detection task lead to a non-instructed, incidental slowing of motor responding, the degree of which was strongly correlated with P3 amplitude. These results have wide-reaching implications for the interpretation of neural signals in both stop-signal and infrequency/oddball-tasks.
Keywords: Action-stopping; Event-related potentials; Frontocentral P3; Infrequency detection; Motor inhibition.
Copyright © 2019 Elsevier B.V. All rights reserved.
Figures


Similar articles
-
Leveling the Field for a Fairer Race between Going and Stopping: Neural Evidence for the Race Model of Motor Inhibition from a New Version of the Stop Signal Task.J Cogn Neurosci. 2020 Apr;32(4):590-602. doi: 10.1162/jocn_a_01503. Epub 2019 Nov 19. J Cogn Neurosci. 2020. PMID: 31742470 Free PMC article.
-
Common and Unique Inhibitory Control Signatures of Action-Stopping and Attentional Capture Suggest That Actions Are Stopped in Two Stages.J Neurosci. 2021 Oct 20;41(42):8826-8838. doi: 10.1523/JNEUROSCI.1105-21.2021. Epub 2021 Sep 7. J Neurosci. 2021. PMID: 34493541 Free PMC article.
-
Paired-pulse TMS and scalp EEG reveal systematic relationship between inhibitory GABAa signaling in M1 and fronto-central cortical activity during action stopping.J Neurophysiol. 2021 Feb 1;125(2):648-660. doi: 10.1152/jn.00571.2020. Epub 2021 Jan 13. J Neurophysiol. 2021. PMID: 33439759 Free PMC article.
-
Does the stop-signal P3 reflect inhibitory control?Cortex. 2025 Feb;183:232-250. doi: 10.1016/j.cortex.2024.12.005. Epub 2024 Dec 21. Cortex. 2025. PMID: 39754857 Review.
-
Specific proactive and generic reactive inhibition.Neurosci Biobehav Rev. 2015 Sep;56:115-26. doi: 10.1016/j.neubiorev.2015.06.011. Epub 2015 Jun 23. Neurosci Biobehav Rev. 2015. PMID: 26116545 Review.
Cited by
-
Leveling the Field for a Fairer Race between Going and Stopping: Neural Evidence for the Race Model of Motor Inhibition from a New Version of the Stop Signal Task.J Cogn Neurosci. 2020 Apr;32(4):590-602. doi: 10.1162/jocn_a_01503. Epub 2019 Nov 19. J Cogn Neurosci. 2020. PMID: 31742470 Free PMC article.
-
Common and unique neurophysiological signatures for the stopping and revising of actions reveal the temporal dynamics of inhibitory control.bioRxiv [Preprint]. 2024 Jun 22:2024.06.18.597172. doi: 10.1101/2024.06.18.597172. bioRxiv. 2024. Update in: J Neurosci. 2025 Mar 26;45(13):e1537242025. doi: 10.1523/JNEUROSCI.1537-24.2025. PMID: 38948849 Free PMC article. Updated. Preprint.
-
Atypical response inhibition and error processing in 22q11.2 Deletion Syndrome and schizophrenia: Towards neuromarkers of disease progression and risk.Neuroimage Clin. 2020;27:102351. doi: 10.1016/j.nicl.2020.102351. Epub 2020 Jul 17. Neuroimage Clin. 2020. PMID: 32731196 Free PMC article.
-
Enhanced response inhibition and reduced midfrontal theta activity in experienced Vipassana meditators.Sci Rep. 2019 Sep 13;9(1):13215. doi: 10.1038/s41598-019-49714-9. Sci Rep. 2019. PMID: 31519984 Free PMC article.
-
Response inhibition alterations in migraine: evidence from event-related potentials and evoked oscillations.J Headache Pain. 2020 Oct 2;21(1):119. doi: 10.1186/s10194-020-01187-2. J Headache Pain. 2020. PMID: 33008328 Free PMC article.
References
-
- Alegre M, Lopez-Azcarate J, Obeso I, Wilkinson L, Rodriguez-Oroz MC, Valencia M, … & Obeso JA (2013). The subthalamic nucleus is involved in successful inhibition in the stop-signal task: A local field potential study in Parkinson’s disease. Experimental Neurology, 239, 1–12. - PubMed
-
- Band GP, van der Molen MW, & Logan GD (2003). Horse-race model simulations of the stop-signal procedure. Acta Psychologica, 112(2), 105–142. - PubMed
-
- Bari A, & Robbins TW (2013). Inhibition and impulsivity: Behavioral and neural basis of response control. Progress in neurobiology, 108, 44–79. - PubMed
-
- Bekker EM, Overtoom CC, Kenemans JL, Kooij JJ, De Noord I, Buitelaar JEEA, & Verbaten MN (2005). Stopping and changing in adults with ADHD. Psychological medicine, 35(6), 807–816. - PubMed
Publication types
MeSH terms
Grants and funding
LinkOut - more resources
Full Text Sources

