. 2019 Sep;12(9):1783-1793.
doi: 10.1016/j.jcmg.2018.10.028. Epub 2019 Jan 16.

Acute Microvascular Impairment Post-Reperfused STEMI Is Reversible and Has Additional Clinical Predictive Value: A CMR OxAMI Study

Affiliations

Acute Microvascular Impairment Post-Reperfused STEMI Is Reversible and Has Additional Clinical Predictive Value: A CMR OxAMI Study

Alessandra Borlotti et al. JACC Cardiovasc Imaging. 2019 Sep.

Abstract

Objectives: This study sought to investigate the clinical utility and the predictive relevance of absolute rest myocardial blood flow (MBF) by cardiac magnetic resonance (CMR) in acute myocardial infarction.

Background: Microvascular obstruction (MVO) remains one of the worst prognostic factors in patients with reperfused ST-segment elevation myocardial infarction (STEMI). Clinical trials have focused on cardioprotective strategies to maintain microvascular functionality, but there is a need for a noninvasive test to determine their efficacy.

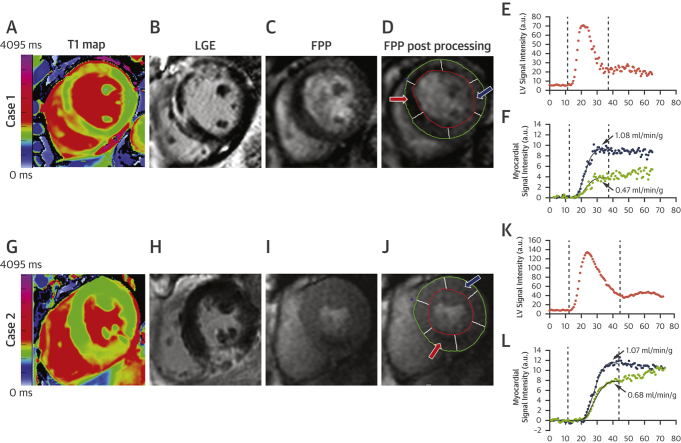
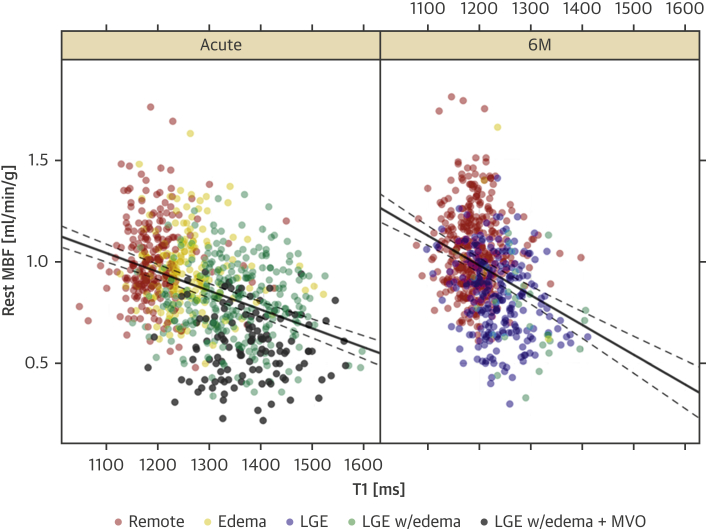
Methods: A total of 64 STEMI patients post-primary percutaneous coronary intervention underwent 3-T CMR scans acutely and at 6 months (6M). The protocol included cine function, T2-weighted edema imaging, pre-contrast T1 mapping, rest first-pass perfusion, and late gadolinium enhancement imaging. Segmental MBF, corrected for rate pressure product (MBFcor), was quantified in remote, edematous, and infarcted myocardium.

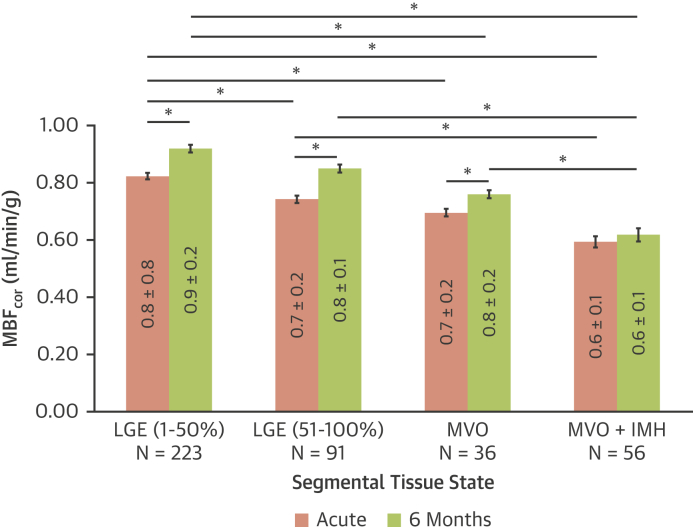
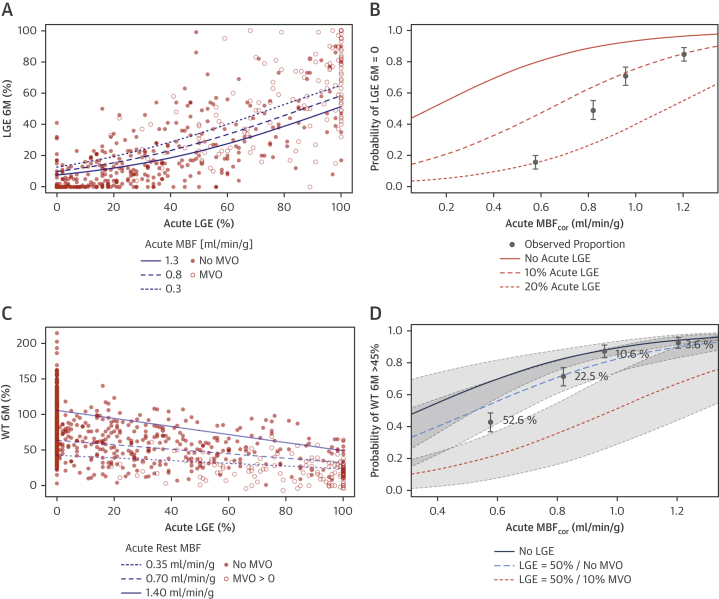
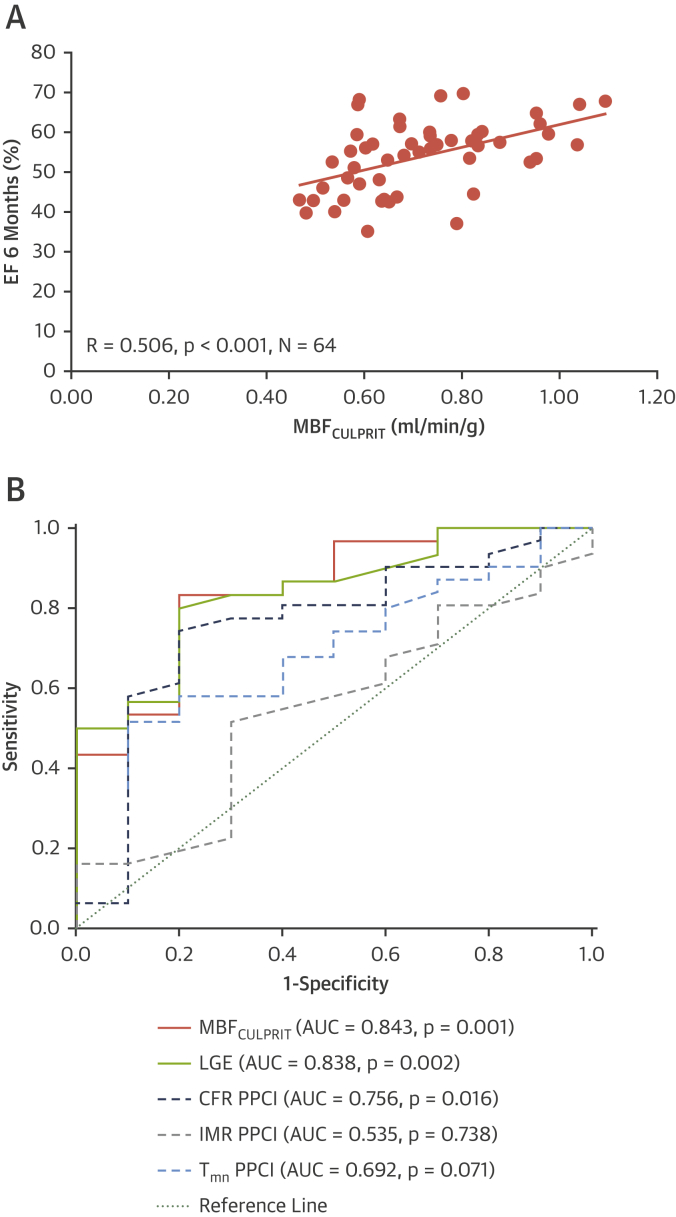
Results: Acute MBFcor was significantly reduced in infarcted myocardium compared with remote MBF (MBFinfarct 0.76 ± 0.20 ml/min/g vs. MBFremote 1.02 ± 0.21 ml/min/g, p < 0.001), but it significantly increased at 6M (MBFinfarct 0.76 ± 0.20 ml/min/g acute vs. 0.85 ± 0.22 ml/min/g at 6M, p < 0.001). On a segmental basis, acute MBFcor had incremental prognostic value for infarct size at 6M (odds of no LGE at 6M increased by 1.4:1 [p < 0.001] for each 0.1 ml/min/g increase of acute MBFcor) and functional recovery (odds of wall thickening >45% at 6M increased by 1.38:1 [p < 0.001] for each 0.1 ml/min/g increase of acute MBFcor). In subjects with coronary flow reserve >2 or index of myocardial resistance <40, acute MBF was associated with long-term functional recovery and was an independent predictor of infarct size reduction.

Conclusions: Acute MBF by CMR could represent a novel quantitative imaging biomarker of microvascular reversibility, and it could be used to identify patients who may benefit from more intensive or novel therapies.

Keywords: acute myocardial infarction; magnetic resonance; myocardial blood flow.


Figures

None
Graphical abstract
Figure 1
Figure 1
Perfusion Quantification for Assessment of Resting Segmental MBF (A to F) Case #1, anterior infarct with microvascular obstruction (MVO); (G to L) Case #2, inferior infarct with no microvascular obstruction. T1 maps and late gadolinium enhancement (LGE) images show the infarcted regions (A and B, anterior with microvascular obstruction; G and H, inferior) with hypoperfusion in the corresponding myocardium on first-pass perfusion (FPP) images (C and I). From segmental quantification (D and J), the myocardial tissue curves for myocardial blood flow (MBF) (F and L) demonstrated a reduced myocardial blood flow in the infarcted region (red arrow, red curve) compared with the remote myocardium (blue arrow, blue curve). (E and K) The arterial input function calculated in the blood pool. a.u. = arbitrary units; LV = left ventricular.
Figure 2
Figure 2
MBFcor Changes Over 6M in Acutely Infarcted Myocardium Myocardial blood flow corrected (MBFcor) improves significantly at 6 months (6M) in all segments, with the exception of segments with an acute presentation with microvascular obstruction (MVO) and intramyocardial hemorrhage (IMH). Bars are SEM. Mean values in the bars are reported with SD. ∗p < 0.001. LGE = late gadolinium enhancement.
Figure 3
Figure 3
Relationship Between MBFcor and Native T1 Over 6M The lines show the prediction from a linear mixed effects model for myocardial blood flow corrected (MBFcor), with native T1 and time point (with interaction term included) as predictors. The model included a random intercept by patient. The dashed lines show the 95th percentile ranges for the predictions from the linear mixed effects model. If regression coefficients for the effect of native T1 on myocardial blood flow are estimated for each tissue state, the association between myocardial blood flow and native T1 is significant only in the acute phase for late gadolinium enhancement with edema, and at 6 months (6M) for edema, late gadolinium enhancement (LGE), and late gadolinium enhancement with edema. MVO = microvascular obstruction.
Figure 4
Figure 4
Predictive Value of MBFcor for Final IS and 6M Functional Recovery (A) The lines show the predictions for acute myocardial blood flow corrected (MBFcor) equal to 0.3, 0.8, and 1.3 ml/min/g. (B) The observed proportions of segments with no 6-month (6M) late gadolinium enhancement (LGE) are shown by quartile of acute myocardial blood flow corrected, with 95% confidence intervals. The lines show the prediction for no 6-month late gadolinium enhancement as a function of acute myocardial blood flow corrected and acute late gadolinium enhancement of 0%, 10%, and 20%. (C) The continuous lines show prediction for acute myocardial blood flow corrected equal to 0.35, 0.70, and 1.40 ml/min/g. (D) The observed proportions of segments with wall thickening (WT) <45% are shown by quartile of acute myocardial blood flow corrected, with 95% confidence intervals. The lines show the predictions for wall thickening <45% as a function of acute myocardial blood flow corrected, and 0% and 50% late gadolinium enhancement, and with and without microvascular obstruction in the case of 50% acute late gadolinium enhancement. IS = infarct size.
Figure 5
Figure 5
Relationship Between Acute MBFCULPRIT and EF 6M (A) Per patient analysis. (B) Receiver-operating characteristic curves showing the diagnostic performance of acute average myocardial blood flow in the culprit territory (MBFCULPRIT) and late gadolinium enhancement (LGE), index of microvascular resistance (IMR), coronary flow reserve (CFR), and transit time at rest (Tmn) in predicting left ventricular (LV) dysfunction (ejection fraction [EF] <50%) at 6 months (6M) in patients with index of microvascular resistance <40 or coronary flow reserve >2 at the time of primary percutaneous coronary intervention. AUC = area under the curve; PPCI = primary percutaneous coronary intervention.

Comment in

References

    1. de Waha S., Patel M.R., Granger C.B. Relationship between microvascular obstruction and adverse events following primary primary percutaneous coronary intervention for ST-segment elevation myocardial infarction: an individual patient data pooled analysis from seven randomized trials. Eur Heart J. 2017;38:3502–3510. - PubMed
    1. Symons R., Pontone G., Schwitter J. Long-term incremental prognostic value of cardiovascular magnetic resonance after ST-segment elevation myocardial infarction. A study of the Collaborative Registry on CMR in STEMI. J Am Coll Cardiol Img. 2018;11:813–825. - PubMed
    1. Schwartz Longacre L., Kloner R.A., Arai A.E. New horizons in cardioprotection: recommendations from the 2010 National Heart, Lung, and Blood Institute Workshop. Circulation. 2011;124:1172–1179. - PMC - PubMed
    1. Fearon W.F., Low A.F., Yong A.S. Prognostic value of the Index of Microcirculatory Resistance measured after primary percutaneous coronary intervention. Circulation. 2013;127:2436–2441. - PMC - PubMed
    1. Carrick D., Haig C., Ahmed N. Comparative prognostic utility of indexes of microvascular function alone or in combination in patients with an acute ST-segment-elevation myocardial infarction. Circulation. 2016;134:1833–1847. - PMC - PubMed

Publication types

MeSH terms