

White Matter Connectome Edge Density in Children with Autism Spectrum Disorders: Potential Imaging Biomarkers Using Machine-Learning Models
- PMID: 30661372
- PMCID: PMC6444925
- DOI: 10.1089/brain.2018.0658
White Matter Connectome Edge Density in Children with Autism Spectrum Disorders: Potential Imaging Biomarkers Using Machine-Learning Models
Abstract
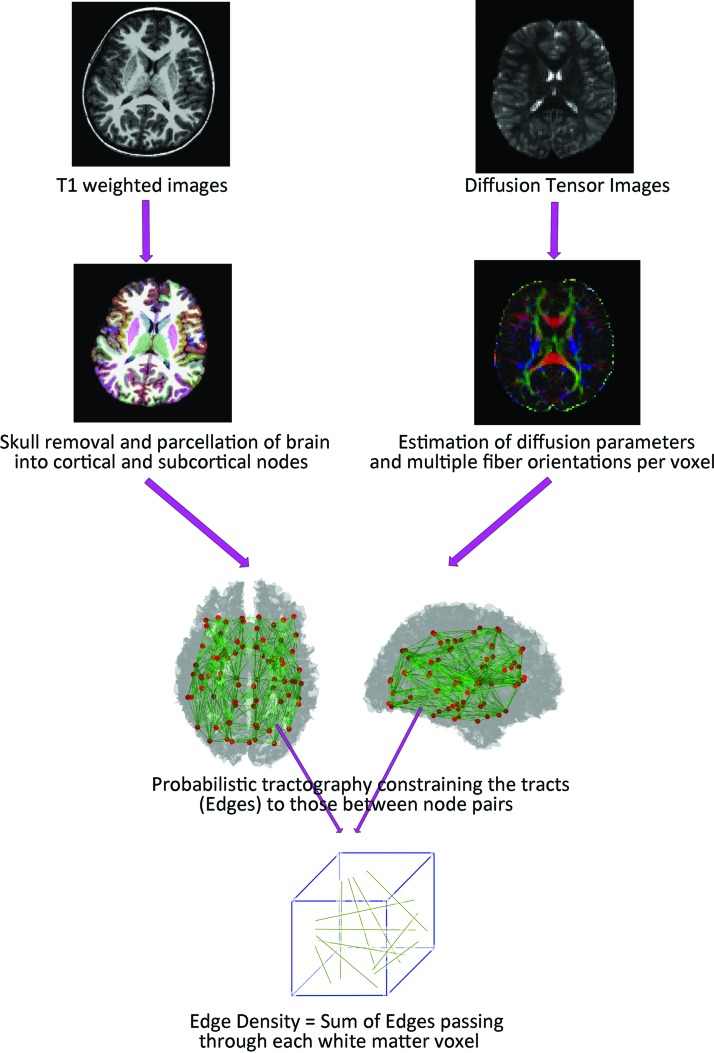
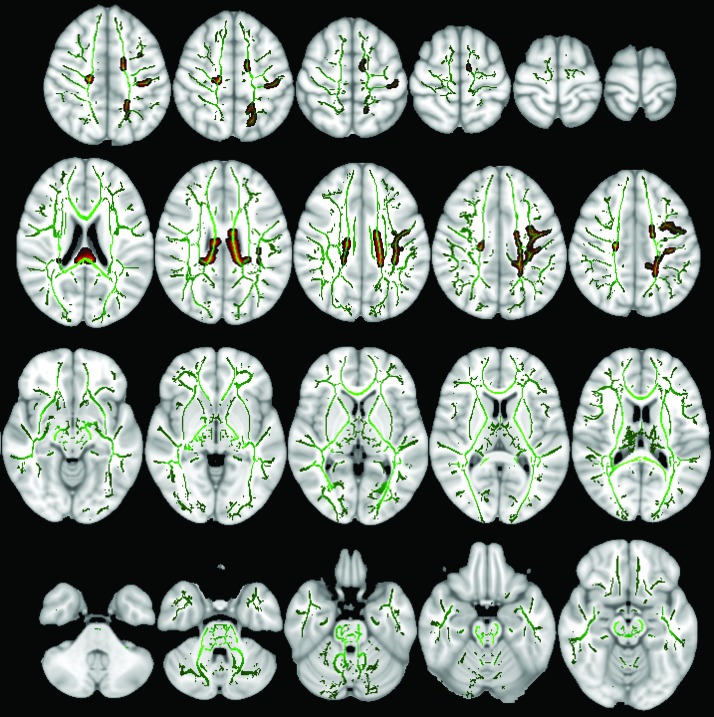
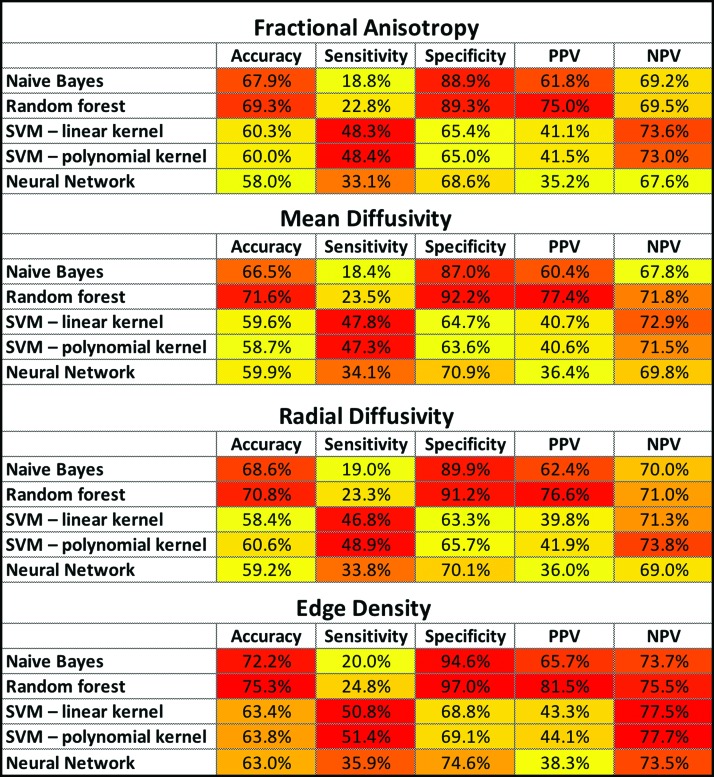
Prior neuroimaging studies have reported white matter network underconnectivity as a potential mechanism for autism spectrum disorder (ASD). In this study, we examined the structural connectome of children with ASD using edge density imaging (EDI), and then applied machine-learning algorithms to identify children with ASD based on tract-based connectivity metrics. Boys aged 8-12 years were included: 14 with ASD and 33 typically developing children. The edge density (ED) maps were computed from probabilistic streamline tractography applied to high angular resolution diffusion imaging. Tract-based spatial statistics was used for voxel-wise comparison and coregistration of ED maps in addition to conventional diffusion tensor imaging (DTI) metrics of fractional anisotropy (FA), mean diffusivity (MD), and radial diffusivity (RD). Tract-based average DTI/connectome metrics were calculated and used as input for different machine-learning models: naïve Bayes, random forest, support vector machines (SVMs), and neural networks. For these models, cross-validation was performed with stratified random sampling ( × 1,000 permutations). The average accuracy among validation samples was calculated. In voxel-wise analysis, the body and splenium of corpus callosum, bilateral superior and posterior corona radiata, and left superior longitudinal fasciculus showed significantly lower ED in children with ASD; whereas, we could not find significant difference in FA, MD, and RD maps between the two study groups. Overall, machine-learning models using tract-based ED metrics had better performance in identification of children with ASD compared with those using FA, MD, and RD. The EDI-based random forest models had greater average accuracy (75.3%), specificity (97.0%), and positive predictive value (81.5%), whereas EDI-based polynomial SVM had greater sensitivity (51.4%) and negative predictive values (77.7%). In conclusion, we found reduced density of connectome edges in the posterior white matter tracts of children with ASD, and demonstrated the feasibility of connectome-based machine-learning algorithms in identification of children with ASD.
Keywords: autism; diffusion tensor imaging; edge density imaging; machine learning.
Conflict of interest statement
No competing financial interests exist.
Figures
References
-
- Akshoomoff N, Lord C, Lincoln AJ, Courchesne RY, Carper RA, Townsend J, Courchesne E. 2004. Outcome classification of preschool children with autism spectrum disorders using MRI brain measures. J Am Acad Child Adolesc Psychiatry 43:349–357 - PubMed
-
- American Psychiatric Association. 2000. Diagnostic and Statistical Manual of Mental Disorders, 5th ed. Arlington, VA: American Psychiatric Publishing
-
- Blanken LME, Muetzel RL, Jaddoe VWV, Verhulst FC, van der Lugt A, Tiemeier H, White T. 2017. White matter microstructure in children with autistic traits. Psychiatry Res Neuroimaging 263:127–134 - PubMed
-
- Blumberg SJ, Bramlett MD, Kogan MD, Schieve LA, Jones JR, Lu MC. 2013. Changes in prevalence of parent-reported autism spectrum disorder in school-aged U.S. children: 2007 to 2011–2012. Natl Health Stat Report 1–11, 1 p following 11 - PubMed
