. 2019 Jun;15(6):976-997.
doi: 10.1080/15548627.2019.1569925. Epub 2019 Feb 1.

Redundancy of human ATG4 protease isoforms in autophagy and LC3/GABARAP processing revealed in cells

Affiliations

Redundancy of human ATG4 protease isoforms in autophagy and LC3/GABARAP processing revealed in cells

Alexander Agrotis et al. Autophagy. 2019 Jun.

Abstract

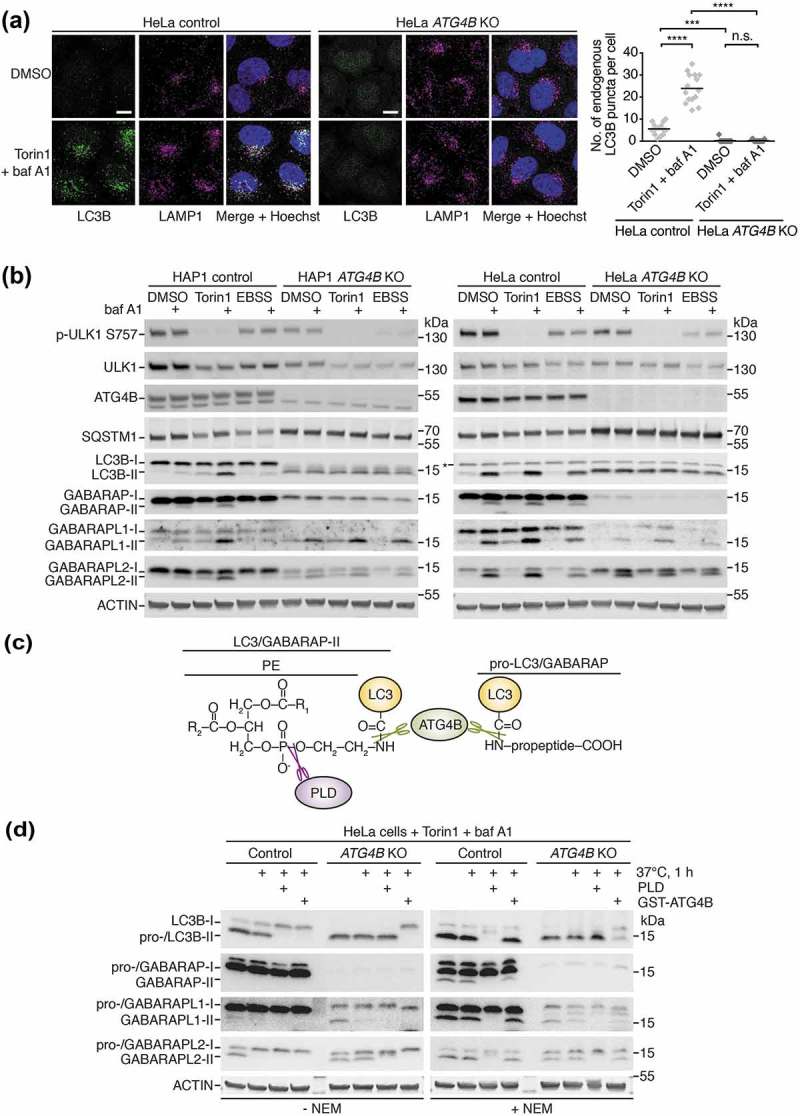
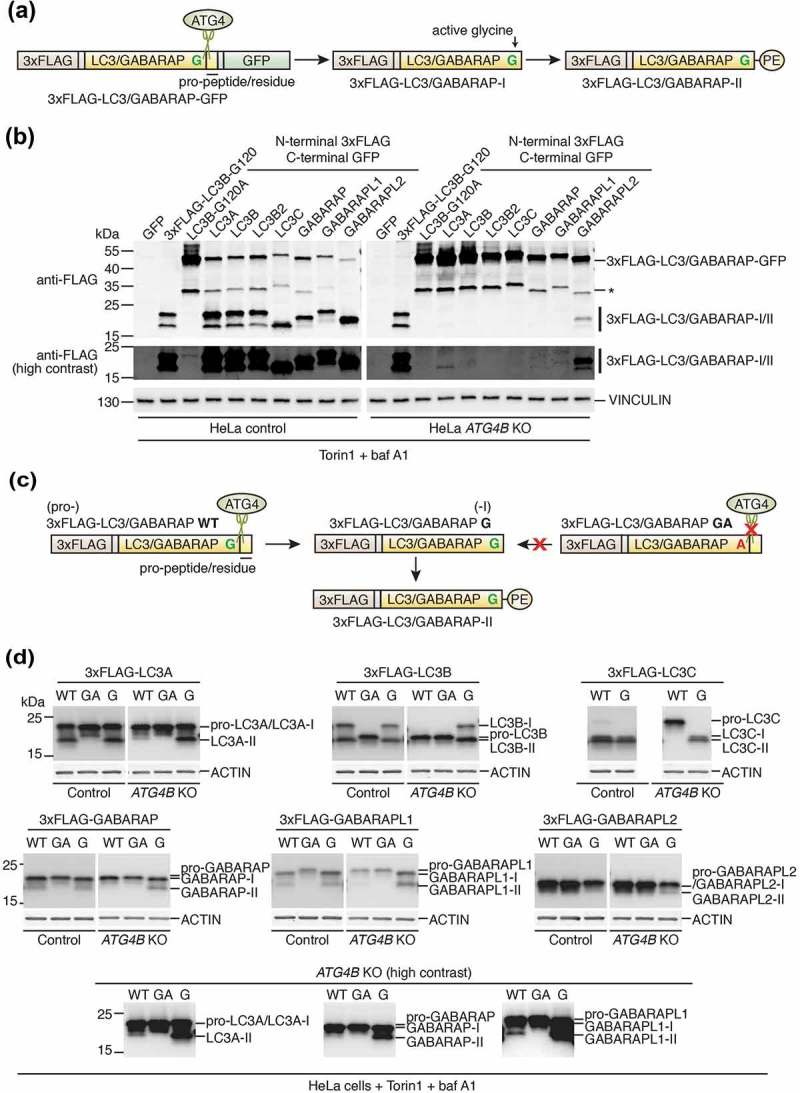
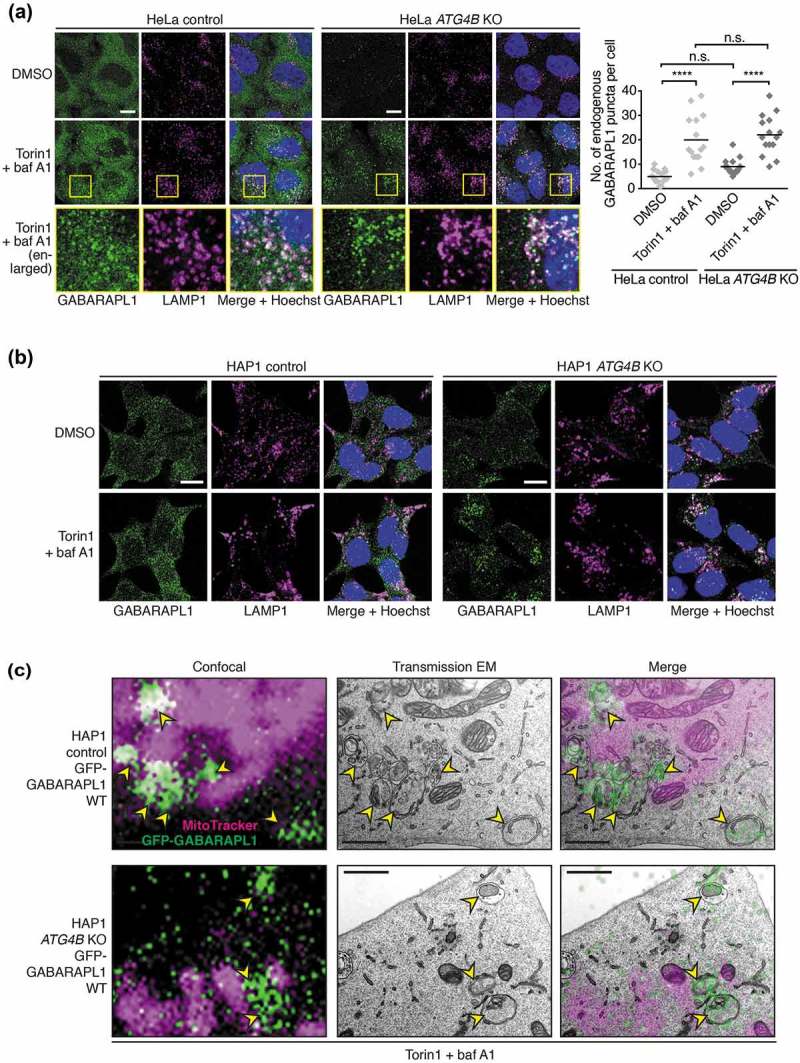
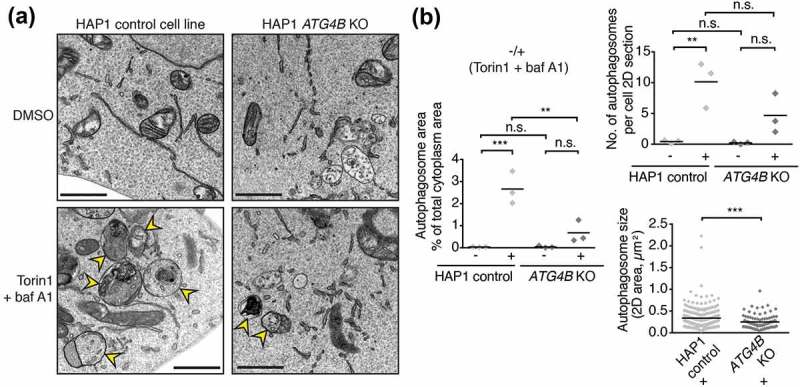
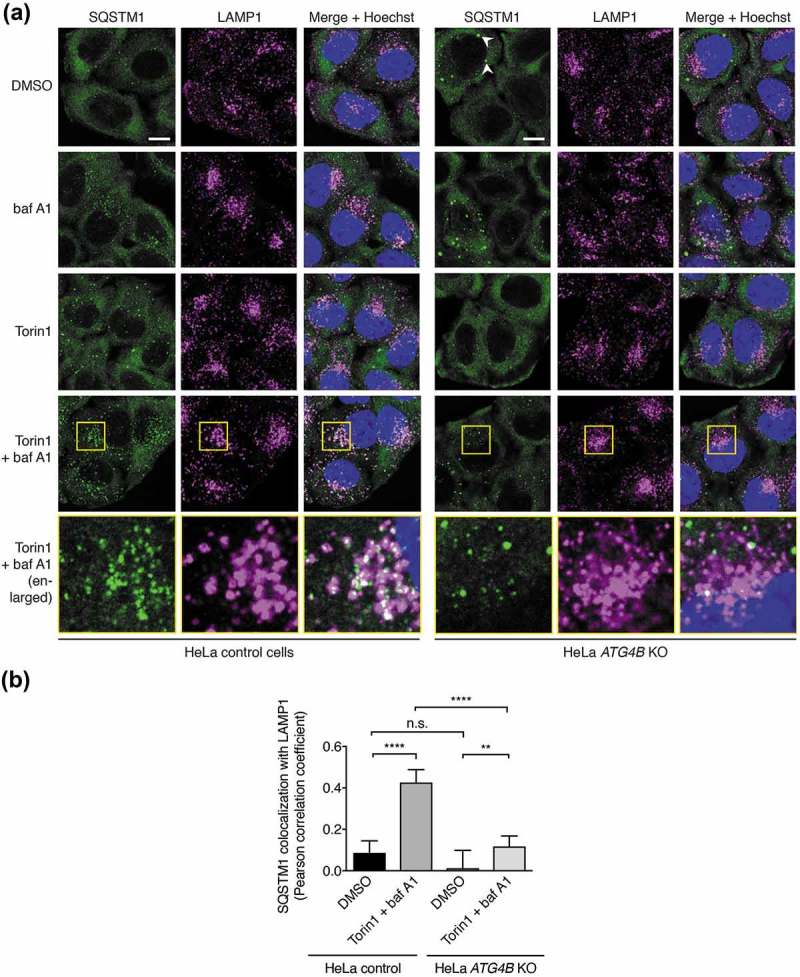
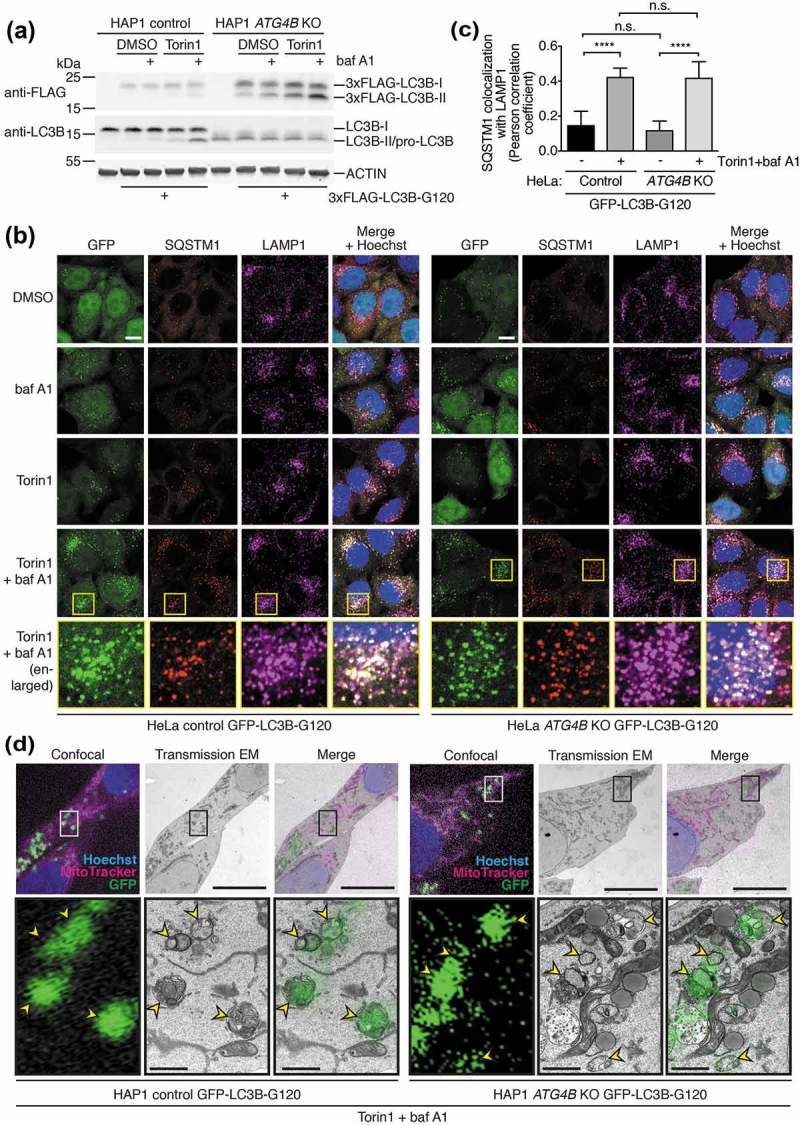
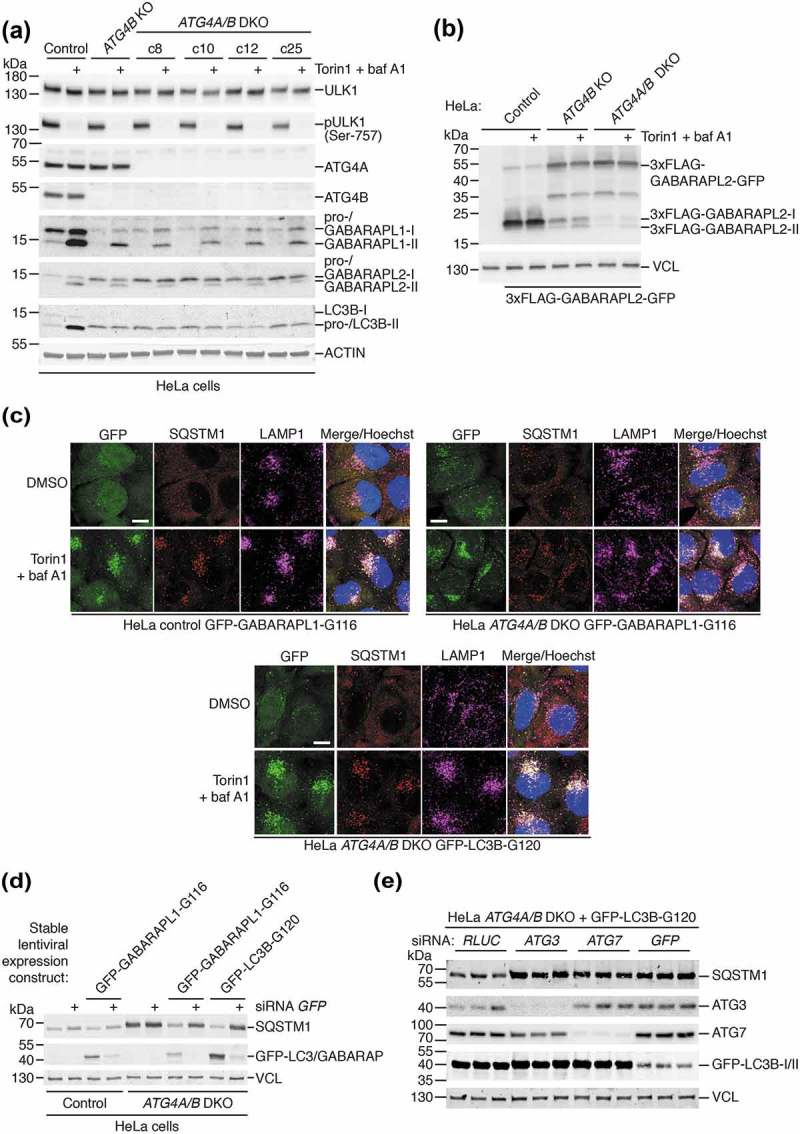
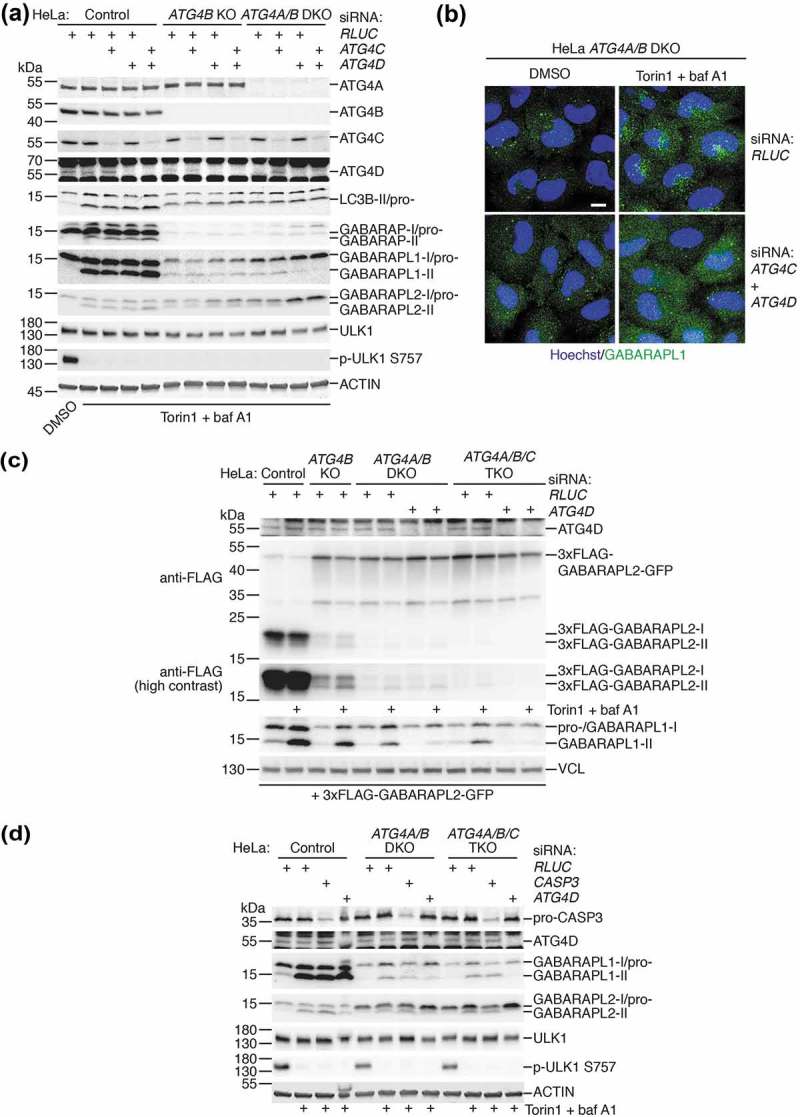
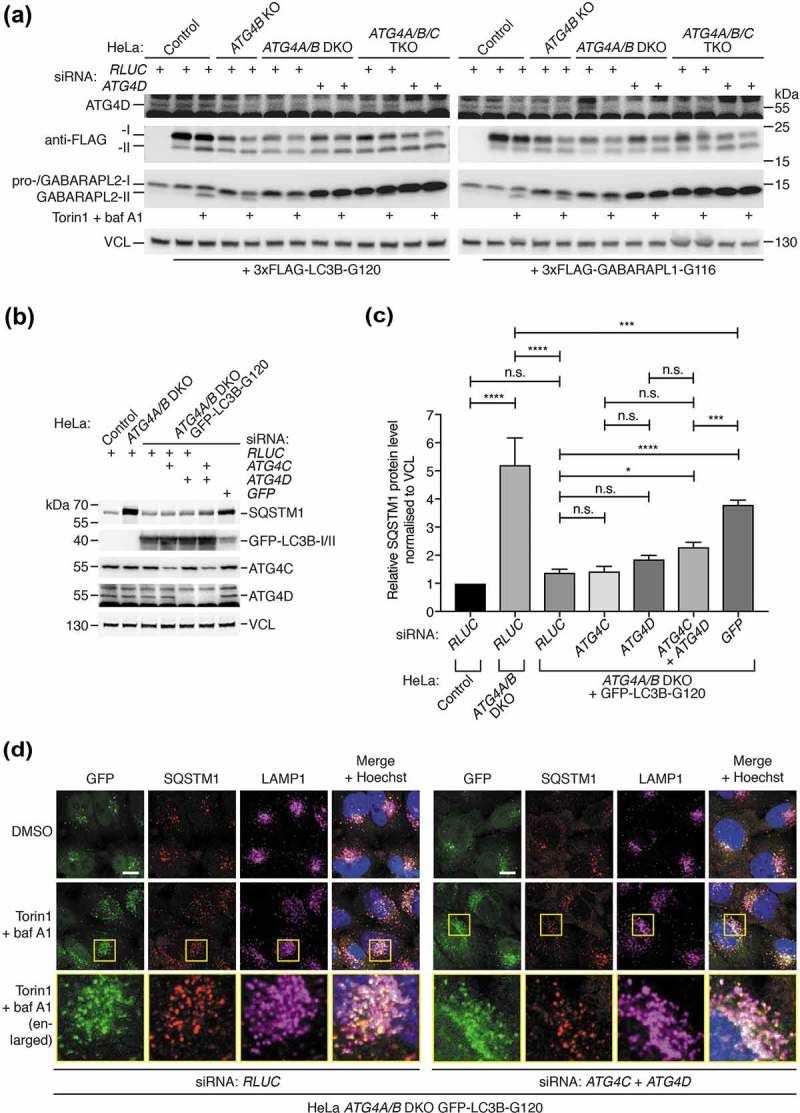
Macroautophagy/autophagy is a cellular degradation pathway that delivers cytoplasmic material to lysosomes via double-membrane organelles called autophagosomes. Lipidation of ubiquitin-like LC3/GABARAP proteins on the autophagosome membrane is important for autophagy. The cysteine protease ATG4 executes 2 LC3/GABARAP processing events: priming of newly synthesized pro-LC3/GABARAP to enable subsequent lipidation, and delipidation/deconjugation of lipidated LC3/GABARAP (the exact purpose of which is unclear in mammals). Four ATG4 isoforms (ATG4A to ATG4D) exist in mammals; however, the functional redundancy of these proteins in cells is poorly understood. Here we show that human HAP1 and HeLa cells lacking ATG4B exhibit a severe but incomplete defect in LC3/GABARAP processing and autophagy. By further genetic depletion of ATG4 isoforms using CRISPR-Cas9 and siRNA we uncover that ATG4A, ATG4C and ATGD all contribute to residual priming activity, which is sufficient to enable lipidation of endogenous GABARAPL1 on autophagic structures. We also demonstrate that expressing high levels of pre-primed LC3B in ATG4-deficient cells can rescue a defect in autophagic degradation of the cargo receptor SQSTM1/p62, suggesting that delipidation by human ATG4 is not essential for autophagosome formation and fusion with lysosomes. Overall, our study provides a comprehensive characterization of ATG4 isoform function during autophagy in human cells. Abbreviations: Atg: autophagy-related; baf A1: bafilomycin A1; CASP3: caspase 3; CLEM: correlative light and electron microscopy; CMV: cytomegalovirus; CRISPR: clustered regularly interspaced short palindromic repeats; DKO: double knockout; EGFP: enhanced green fluorescent protein; GABARAP: GABA type A receptor-associated protein; GABARAPL1: GABA type A receptor-associated protein like 1; GABARAPL2: GABA type A receptor-associated protein like 2; GFP: green fluorescent protein; HB: homogenization buffer; KO: knockout; LAMP1: lysosomal associated membrane protein 1; LIR: LC3 interacting region; MAP1LC3/LC3: microtubule-associated protein 1 light chain 3; MFN2: mitofusin 2; N.A.: numerical aperture; NEM: N-ethylmaleimide; PDHA1: pyruvate dehydrogenase E1 alpha 1 subunit; PLD: phospholipase D; PE: phosphatidylethanolamine; RLUC: Renilla luciferase; SQSTM1: sequestosome 1; TEM: transmission electron microscopy; TKO: triple knockout; ULK1: unc-51 like autophagy activating kinase 1; VCL: vinculin; WT: wild-type.

Keywords: Atg8; CLEM; CRISPR; GABARAPL2; delipidation; knockout.


Figures

Figure 1.
Figure 1.
ATG4B is required for LC3B lipidation but not GABARAP isoform lipidation. (a) Localization of endogenous LC3B and LAMP1 in HeLa control and ATG4B KO cells treated for 3 h with DMSO or 250 nM Torin1 + 10 nM bafilomycin A1 (baf A1) revealed by immunocytochemistry. Scale bar: 10 µm. Quantification of LC3B puncta per cell shown on right hand side. n = 15 randomly-selected cells per condition. **** P ≤ 0.0001, *** P ≤ 0.001, n.s. (not significant) P > 0.05 (Sidak’s multiple comparison test). (b) Western blotting of lysates from HAP1 and HeLa control and ATG4B KO cells treated for 3 h with either 250 nM Torin1 or EBSS in the presence or absence of 10 nM baf A1. Lysis was performed in the presence of 20 mM NEM (N-ethylmaleimide) since this was required to stabilize lipidated GABARAP and GABARAPL1 (see also Figure S1E). Background band detected by LC3B antibody is indicated with an asterisk (see also Figure S1B). (c) Diagram showing bonds present at the C terminus of pro- and lipidated (PE-conjugated) LC3/GABARAP that can be cleaved by ATG4B or PLD in vitro (not to scale). This principle provides the basis for distinguishing between the pro-LC3/GABARAP and lipidated LC3/GABARAP by western blot. (d) PLD bandshift assay performed on HeLa control or ATG4B KO cells treated for 3 h with 250 nM Torin1 + 10 nM baf A1 and lysed in PLD assay buffer with or without 20 mM NEM. Lysates were subject to in vitro treatment with purified PLD or GST-ATG4B prior to western blotting.
Figure 2.
Figure 2.
Loss of ATG4B leads to a severe but incomplete defect in LC3/GABARAP priming. (a) Schematic of N-terminal 3xFLAG C-terminal GFP double-tagged LC3/GABARAP constructs used in Figure 2(b) (not to scale). Cleavage site targeted by ATG4 in cells is indicated, resulting in formation of primed/activated 3xFLAG-LC3/GABARAP-I. The primed form can then undergo lipidation in cells to form 3xFLAG-LC3/GABARAP-II. (b) Western blotting of lysates from HeLa control and ATG4B KO cells transiently transfected with the indicated 3xFLAG-LC3/GABARAP-GFP, positive (3xFLAG-LC3B-G120) and negative (3xFLAG-LC3B-G120A-GFP) control constructs. At 24 h post-transfection, cells were treated for 3 h with 250 nM Torin1 + 10 nM baf A1 prior to lysis. Specific cleaved and lipidated products arising from ATG4 activity are indicated as 3xFLAG-LC3/GABARAP-I/II. The band marked with an asterisk corresponds to a non-specific cleavage product. (c) Schematic of N-terminal 3xFLAG-tagged LC3/GABARAP constructs used in Figure 2(d) (not to scale). Cleavage site in wild-type (WT) constructs targeted by ATG4 in cells is indicated, resulting in formation of primed 3xFLAG-LC3/GABARAP-I. To bypass cleavage, 3xFLAG-LC3/GABARAP G constructs were expressed that lack the C-terminal pro-peptide/residue. The primed form can then undergo lipidation in cells to form 3xFLAG-LC3/GABARAP-II. Mutation of the active glycine residue to alanine in 3xFLAG-LC3/GABARAP GA blocks priming, therefore this construct corresponds to the pro- form of the protein and cannot undergo conversion to 3xFLAG-LC3/GABARAP-I or further conversion to 3xFLAG-LC3/GABARAP-II. (d) Western blotting of lysates from HeLa control and ATG4B KO cells transiently transfected with indicated 3xFLAG-LC3/GABARAP wild-type (WT), primed (G) and uncleavable (GA) constructs. At 24 h post-transfection, cells were treated for 3 h with 250 nM Torin1 + 10 nM baf A1 prior to lysis. Anti-FLAG antibody was used to detect the expressed constructs. Presented as a comparison between control and ATG4B KO cells for each individual LC3/GABARAP, see also Figure S2 for original blots.
Figure 3.
Figure 3.
GABARAPL1 can localize to autophagic structures in the absence of ATG4B. (a) Immunocytochemistry of endogenous GABARAPL1 and LAMP1 in HeLa control or ATG4B KO cells, treated with DMSO or 250 nM Torin1 + 10 nM baf A1 for 3 h prior to fixation. Yellow boxes show region-of-interest in the Torin1 + baf A1 treated condition that is enlarged in the panels below. Scale bar: 10 µm. Quantification of GABARAPL1 puncta per cell shown on right hand side. n = 15 randomly-selected cells per condition. **** P ≤ 0.0001, n.s. (not significant) P > 0.05 (Sidak’s multiple comparison test). (b) Immunocytochemistry as described in Figure 3(a), for HAP1 control and ATG4B KO cells. (c) CLEM of GFP-GABARAPL1 WT stably expressed in in HAP1 control and ATG4B KO cells treated for 3 h with 250 nM Torin1 + 10 nM baf A1 prior to fixation. Yellow arrowheads indicate GFP-positive autophagic structures. Confocal microscopy image corresponds to a single confocal slice. Scale bar: 1 µm.
Figure 4.
Figure 4.
Autophagosome formation defect in cells lacking ATG4B. (a) Representative transmission electron microscopy (TEM) images of areas of cytoplasm in HAP1 control and ATG4B KO cells treated for 3 h with DMSO or 250 nM Torin1 + 10 nM baf A1 prior to fixation and sample processing. Yellow arrowheads indicate autophagic structures. Scale bar: 1 µm. (b) Quantitative TEM analysis of average cytoplasm area occupied by autophagic structures and average number of autophagic structures per cell from experiments represented in Figure 4(a). Data points show mean from each experiment (n = 3 independent experiments). In each experiment 8 randomly selected cell profiles were assessed per condition. *** P ≤ 0.001, ** P ≤ 0.01, n.s. (not significant) P > 0.05 (Sidak’s multiple comparison test). For quantification of autophagosome size in terms of 2D area, data points represent individual autophagic structures measured from Torin1- and baf A1-treated conditions pooled from 3 experiments (control n = 259, ATG4B KO n = 98). *** P ≤ 0.001, ** P ≤ 0.01 (Unpaired two-tailed t-test).
Figure 5.
Figure 5.
Impaired autophagic delivery of SQSTM1 to lysosomes in cells lacking ATG4B. (a) Immunocytochemistry of endogenous SQSTM1 and LAMP1 in control and ATG4B KO HeLa cells. Cells were treated for 3 h with DMSO or 250 nM Torin1 + 10 nM baf A1 prior to fixation and staining. White arrowheads indicate examples of large SQSTM1 bodies in ATG4B KO cells that likely correspond to protein aggregates. Yellow boxes show region-of-interest in the Torin1 + baf A1 treated condition that is enlarged in the panels below. Scale bar: 10 µm. (b) Assessment of colocalization between endogenous SQSTM1 and LAMP1 in HeLa control and ATG4B KO cells using single-plane confocal images as represented in Figure 5(a). Bars indicate mean and error bars show standard deviation (n = 10 randomly-selected cells per condition). **** P ≤ 0.0001, ** P ≤ 0.01, n.s. (not significant) P > 0.05 (Sidak’s multiple comparison test).
Figure 6.
Figure 6.
Pre-primed LC3B is lipidated, localizes to autophagosomes, and can restore endogenous SQSTM1 turnover when expressed at high levels in ATG4B KO cells. (a) HAP1 control and ATG4B KO cells transfected with 3xFLAG-LC3B-G120 using PEI were treated with combinations of DMSO or 250 nM Torin1 with or without 10 nM baf A1 for 3 h prior to lysis and western blot analysis. (b) Immunocytochemistry of endogenous SQSTM1 and LAMP1 in HeLa control and ATG4B KO cells stably expressing GFP-LC3B-G120 under control of the CMV promoter. Cells were treated for 3 h with combinations of DMSO or 250 nM Torin1 with or without 10 nM baf A1 for 3 h prior to fixation and staining. Yellow boxes show region-of-interest in the Torin1 + baf A1 treated condition that is enlarged in the panels below. Scale bar: 10 µm. (c) Assessment of colocalization between endogenous SQSTM1 and LAMP1 in HeLa control and ATG4B KO cells stably expressing CMV promoter-driven GFP-LC3B-G120 using single-plane confocal images as represented in Figure 6(b). Bars indicate mean and error bars show standard deviation (n = 10 randomly-selected cells per condition). **** P ≤ 0.0001, n.s. (not significant) P > 0.05 (Sidak’s multiple comparison test). (d) CLEM of CMV-driven GFP-LC3B-G120 stably expressed in HAP1 control and ATG4B KO cells. Cells were treated for 3 h with 250 nM Torin1 + 10 nM baf A1 prior to fixation. Upper panels show low magnification images with a boxed region-of-interest (ROI); scale bar: 10 µm. Lower panels show enlarged ROI, with yellow arrowheads indicating GFP-positive autophagic structures; scale bar: 1 µm. Confocal microscopy image corresponds to a single confocal slice.
Figure 7.
Figure 7.
Additional loss of ATG4A in ATG4B KO cells only partially further reduces GABARAP subfamily priming and does not prevent rescue of autophagy by pre-primed LC3/GABARAP. (a) HeLa control, ATG4B KO and different ATG4A/B double knockout (DKO) clones were treated for 3 h with DMSO or 250 nM Torin1 + 10 nM baf A1 prior to lysis and western blot analysis. See also Figure S6A for analysis of the same clones by immunocytochemistry of endogenous GABARAPL1. (b) HeLa control, ATG4B KO and ATG4A/B DKO (c25) were transiently transfected with 3xFLAG-GABARAPL2-GFP. After 24 h, cells were treated for 3 h with DMSO or 250 nM Torin1 + 10 nM baf A1 prior to lysis and western blotting. 3xFLAG-GABARAPL2-GFP was detected using anti-FLAG antibody. (c) HeLa cells stably transduced with GFP-GABARAPL1-G116 (Control and ATG4A/B DKO c25) and GFP-LC3B-G120 (ATG4A/B DKO c25) were treated for 3 h with DMSO or 250 nM Torin1 + 10 nM baf A1 prior to fixation and immunocytochemistry to reveal endogenous SQSTM1 and LAMP1 localization. Scale bar: 10 µm. See also Figure S6B for immunocytochemistry of untransduced cells. (d) Untransduced and stably-transduced HeLa control and ATG4A/B DKO (c25) cells were assessed for SQSTM1 protein level by western blotting, 48 h after transfection with siRNA targeting RLUC as a negative control (lanes without +), or EGFP (lanes with +). GFP-LC3B-G120 and GFP-GABARAPL1-G116 were detected using anti-GFP antibody. (e) HeLa ATG4A/B DKO (c25) cells stably expressing GFP-LC3B-G120 were transfected with siRNA targeting RLUC (negative control), ATG3, ATG7 or GFP (positive control). After 48 h, cells were lysed and subject to western blot analysis to assess SQSTM1 protein level. GFP-LC3B-G120 was detected using anti-GFP antibody.
Figure 8.
Figure 8.
All ATG4 isoforms contribute to GABARAPL1 and GABARAPL2 priming and lipidation independently of CASP3 expression. (a) HeLa control, ATG4B KO and ATG4A/B DKO (c25) cells transfected with siRNA targeting ATG4C, ATG4D or RLUC (negative control) were treated for 3 h with DMSO or 250 nM Torin1 + 10 nM baf A1 prior to lysis and western blot analysis. (b) Immunocytochemistry of endogenous GABARAPL1 (in green, with Hoechst staining shown in blue) in HeLa ATG4A/B DKO (c25) cells treated for 3 h with DMSO or 250 nM Torin1 + 10 nM baf A1, after transfection with siRNA against RLUC (negative control) or ATG4C + ATG4D. Scale bar: 10 µm. (c) HeLa control, ATG4B KO, ATG4A/B DKO (c25) and ATG4A/B/C triple knockout (TKO, c22) cells were transfected with siRNA against either RLUC or ATG4D prior to transfection with 3xFLAG-GABARAPL2-GFP. Cells were treated for 3 h with DMSO or 250 nM Torin1 + 10 nM baf A1 prior to lysis and western blot analysis. See also Figures S9A-C for additional characterization of HeLa ATG4/A/B/C TKO cells. (d) Western blotting of HeLa control, ATG4A/B DKO (c25) and ATG4A/B/C TKO (c22) cell lysates following siRNA knockdown of CASP3 or ATG4D. Cells were treated for 3 h with DMSO or 250 nM Torin1 + 10 nM baf A1 prior to lysis.
Figure 9.
Figure 9.
Delipidation by ATG4 isoforms is not essential for autophagy of SQSTM1 upon high expression of pre-primed LC3B. (a) HeLa control, ATG4B KO, ATG4A/B DKO (c25) and ATG4A/B/C triple knockout (TKO, c22) were transfected with siRNA against either RLUC or ATG4D prior to transfection with 3xFLAG-LC3B-G120 or 3xFLAG-GABARAPL1-G116. Cells were treated for 3 h with DMSO or 250 nM Torin1 + 10 nM baf A1 prior to lysis and western blot analysis. Anti-FLAG antibody was used to assess the lipidation status of 3xFLAG-LC3B-G120 and 3xFLAG-GABARAPL1-G116. (b) HeLa control, ATG4A/B DKO (c25) and ATG4A/B DKO (c25) cells stably expressing GFP-LC3B-G120 were transfected with combinations of siRNA targeting RLUC (negative control) ATG4C, ATG4D or GFP (positive control) prior to lysis and western blot analysis to assess the impact of knockdown on basal SQSTM1 protein level. (c) Quantification of SQSTM1 protein level normalized to VCL protein level from knockdown experiments represented in Figure 9(b). Bars indicate mean and error bars show standard deviation (n = 4 independent experiments). **** P ≤ 0.0001, *** P ≤ 0.001, * P ≤ 0.05, n.s. P > 0.05 (Sidak’s multiple comparison test). (d) Immunocytochemistry of endogenous SQSTM1 and LAMP1 in HeLa ATG4A/B DKO (c25) cells stably expressing GFP-LC3B-G120 and transfected with siRNA targeting RLUC or ATG4C + ATG4D. Cells were treated for 3 h with DMSO or 250 nM Torin1 + 10 nM baf A1 for 3 h prior to fixation and staining. Yellow boxes show region-of-interest in the Torin1 + baf A1-treated condition that is enlarged in the panels below. Scale bar: 10 µm.

References

    1. Bento CF, Renna M, Ghislat G, et al. Mammalian autophagy: how does it work? Annu. Rev Biochem. 2016;85:685–713. - PubMed
    1. Galluzzi L, Baehrecke EH, Ballabio A, et al. Molecular definitions of autophagy and related processes. Embo J. 2017;36:1811–1836. - PMC - PubMed
    1. Harding TM, Morano KA, Scott SV, et al. Isolation and characterization of yeast mutants in the cytoplasm to vacuole protein targeting pathway. J Cell Biol. 1995;131:591–602. - PMC - PubMed
    1. Tsukada M, Ohsumi Y.. Isolation and characterization of autophagy-defective mutants of Saccharomyces cerevisiae. FEBS Lett. 1993;333:169–174. - PubMed
    1. Ichimura Y, Kirisako T, Takao T, et al. A ubiquitin-like system mediates protein lipidation. Nature. 2000;408:488–492. - PubMed

Publication types

MeSH terms