Observational Study
. 2019 Mar 15;124(6):904-919.
doi: 10.1161/CIRCRESAHA.118.313911.

Discovery of Distinct Immune Phenotypes Using Machine Learning in Pulmonary Arterial Hypertension

Affiliations
Observational Study

Discovery of Distinct Immune Phenotypes Using Machine Learning in Pulmonary Arterial Hypertension

Andrew J Sweatt et al. Circ Res. .

Abstract

Rationale: Accumulating evidence implicates inflammation in pulmonary arterial hypertension (PAH) and therapies targeting immunity are under investigation, although it remains unknown if distinct immune phenotypes exist.

Objective: Identify PAH immune phenotypes based on unsupervised analysis of blood proteomic profiles.

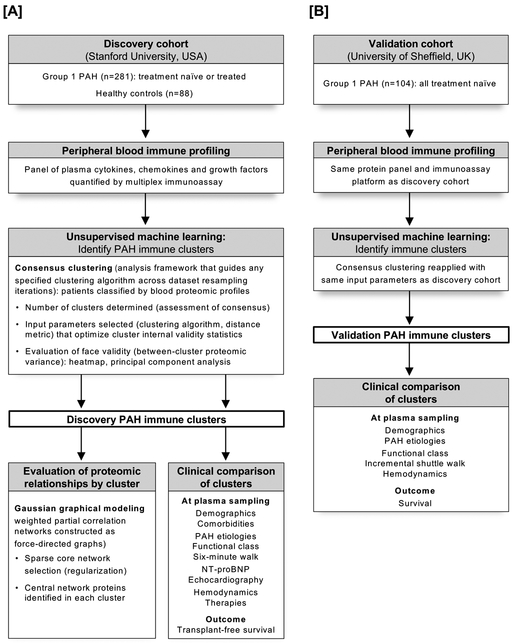
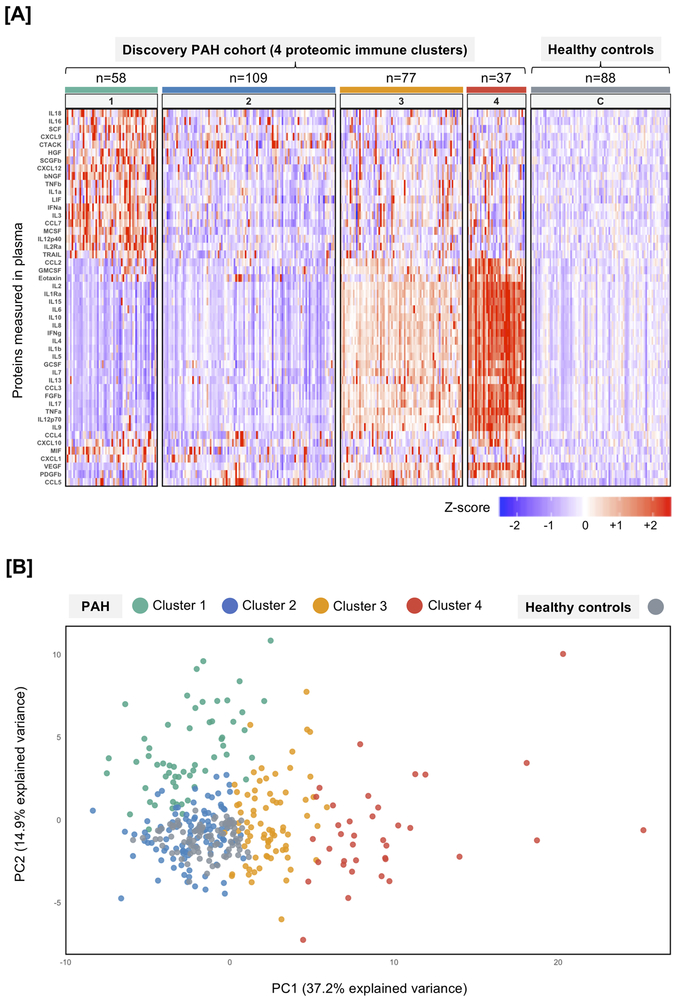
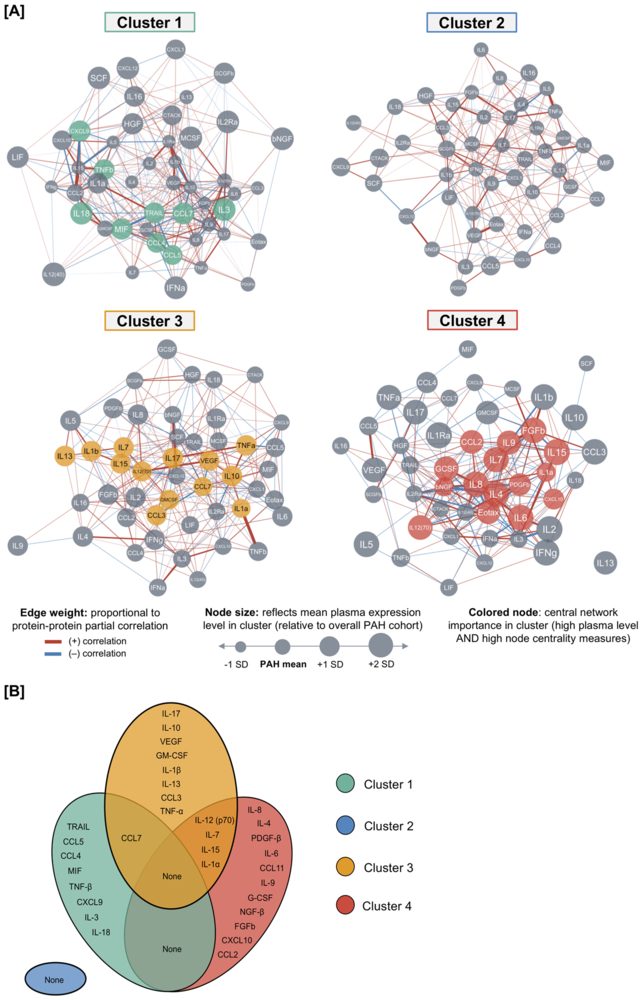
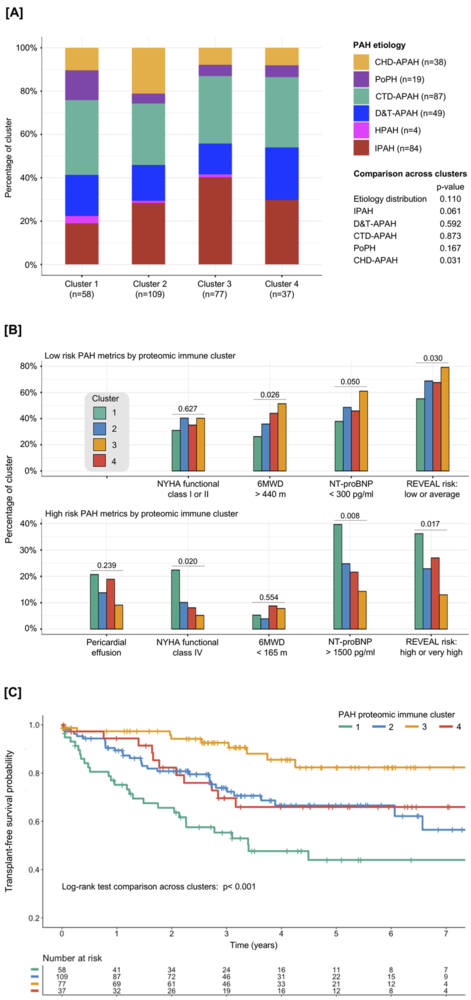
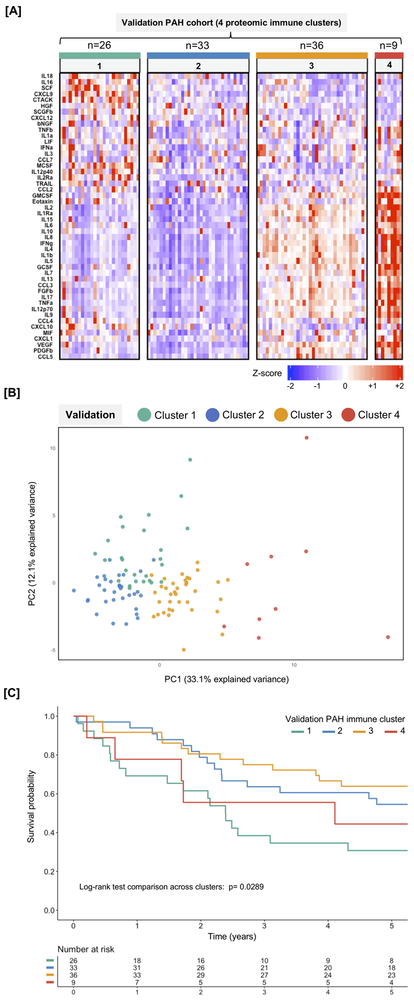
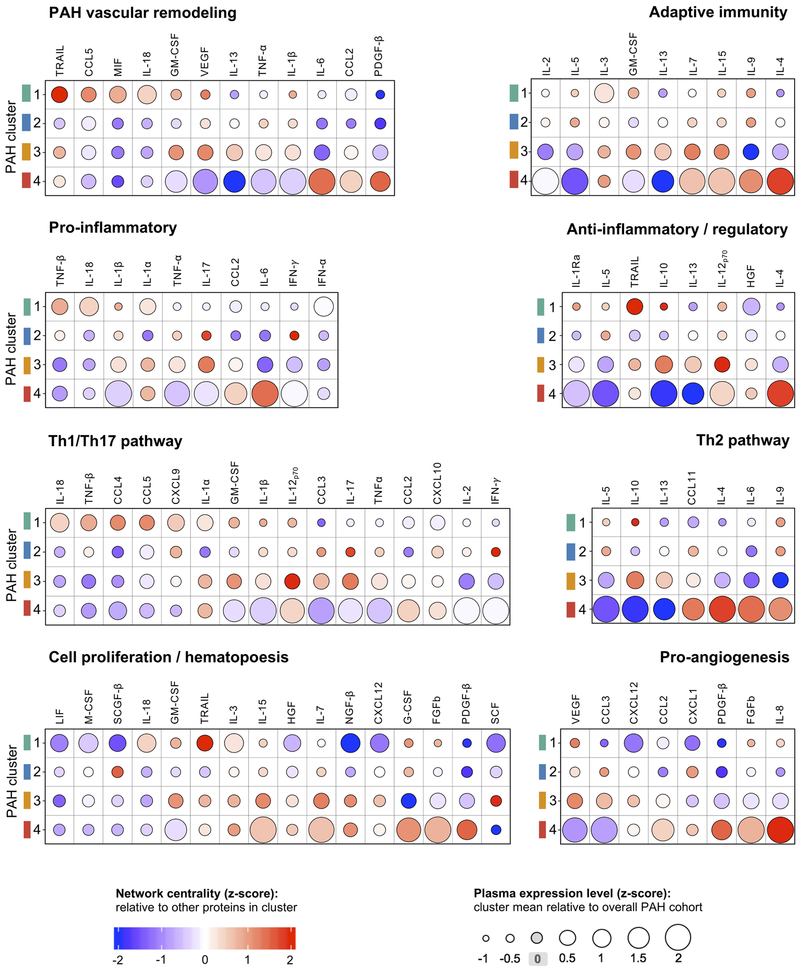
Methods and results: In a prospective observational study of group 1 PAH patients evaluated at Stanford University (discovery cohort; n=281) and University of Sheffield (validation cohort; n=104) between 2008 and 2014, we measured a circulating proteomic panel of 48 cytokines, chemokines, and factors using multiplex immunoassay. Unsupervised machine learning (consensus clustering) was applied in both cohorts independently to classify patients into proteomic immune clusters, without guidance from clinical features. To identify central proteins in each cluster, we performed partial correlation network analysis. Clinical characteristics and outcomes were subsequently compared across clusters. Four PAH clusters with distinct proteomic immune profiles were identified in the discovery cohort. Cluster 2 (n=109) had low cytokine levels similar to controls. Other clusters had unique sets of upregulated proteins central to immune networks-cluster 1 (n=58; TRAIL [tumor necrosis factor-related apoptosis-inducing ligand], CCL5 [C-C motif chemokine ligand 5], CCL7, CCL4, MIF [macrophage migration inhibitory factor]), cluster 3 (n=77; IL [interleukin]-12, IL-17, IL-10, IL-7, VEGF [vascular endothelial growth factor]), and cluster 4 (n=37; IL-8, IL-4, PDGF-β [platelet-derived growth factor beta], IL-6, CCL11). Demographics, PAH clinical subtypes, comorbidities, and medications were similar across clusters. Noninvasive and hemodynamic surrogates of clinical risk identified cluster 1 as high-risk and cluster 3 as low-risk groups. Five-year transplant-free survival rates were unfavorable for cluster 1 (47.6%; 95% CI, 35.4%-64.1%) and favorable for cluster 3 (82.4%; 95% CI, 72.0%-94.3%; across-cluster P<0.001). Findings were replicated in the validation cohort, where machine learning classified 4 immune clusters with comparable proteomic, clinical, and prognostic features.

Conclusions: Blood cytokine profiles distinguish PAH immune phenotypes with differing clinical risk that are independent of World Health Organization group 1 subtypes. These phenotypes could inform mechanistic studies of disease pathobiology and provide a framework to examine patient responses to emerging therapies targeting immunity.

Keywords: classification; cytokine; inflammation; interleukin; phenotype; pulmonary hypertension.


Figures

Figure 1.
Figure 1.. Immune phenotyping overview. [A] Discovery cohort.
A plasma panel of immune-relevant proteins was measured using multiplex immunoassay in a Stanford University cohort of PAH patients (n=281) and healthy controls (n=88). Unsupervised machine learning (consensus clustering) was applied to classify PAH clusters with distinct proteomic immune profiles. For each PAH cluster, a partial correlation network was then constructed and analyzed (Gaussian graphical modeling) to examine proteomic relationships and identify central proteins. Clinical features and outcomes were thereafter compared across clusters. [B] Validation cohort. The proteomic panel was also measured in a University of Sheffield PAH cohort (n=104). The same unsupervised consensus clustering method was reapplied, to determine if the approach identified immune clusters with proteomic and clinical features similar to those revealed during the discovery stage.
Figure 2.
Figure 2.. Discovery cohort: [A] Heatmap of standardized patient-level proteomic measurements by PAH cluster.
Heatmap columns represent individual patients (grouped according to the clusters discovered by unsupervised consensus clustering), and each row is an assayed protein. Measured protein median fluorescence intensity (MFI) is displayed as a color-coded z-score (standard deviations above or below cohort mean). Healthy control proteomic measurements are shown in the far-right panel. Heatmap rows are ordered based on hierarchal clustering of proteins (dendogram not shown), solely for the purpose of visualization. [B] Principal component analysis of cluster proteomic profiles relative to controls. In a scatter plot of the first two principal components (PC1 vs PC2), the multivariable proteomic profile of each PAH patient is reduced to a single dot and colored according to consensus cluster assignment. Healthy controls are also shown as a reference.
Figure 3.
Figure 3.. Discovery cohort: protein-protein network analysis by cluster. [A] Sparse core networks.
For each cluster, an undirected weighted partial correlation network is constructed as a force-directed graph. Network nodes represent individual proteins, and node size reflects the detected plasma level in respective clusters. Edges connect node pairs, and edge weights are proportional to protein-protein partial correlations (red=positive, blue=negative). These sparse core networks reflect graphical LASSO regularization (less significant edges removed from saturated networks displayed in Online Figure III). [B] Central proteins in cluster networks. A Venn diagram highlights proteins with centrality in each cluster network. In quantitative network analysis, these proteins were upregulated (mean cluster plasma level greater than overall PAH cohort) and had network centrality (at least two of three centrality indices [strength, closeness, and betweenness] exceeded mean of all network nodes) (data shown in Online Figure IV).
Figure 4.
Figure 4.. Discovery cohort: clinical comparison of clusters. [A] PAH etiology.
Stacked bars display the distribution of underlying PAH etiologies within each machine learned proteomic patient cluster. [B] Non-invasive clinical risk surrogates. For multiple well-established risk markers, bar plots indicate the percentage of patients in each cluster with high-risk status (top panel) and low-risk status (bottom panel) at the time of proteomic sampling. [C] Transplant-free survival analysis. Kaplan-Meier estimates of transplant-free survival from the time of plasma sampling are displayed for each cluster and compared by log-rank test. Survival curve cross-tags indicate censoring, and the number of patients remaining at risk over time is shown.
Figure 5.
Figure 5.. Validation cohort: [A]. Heatmap of patient-level proteomic measurements by cluster.
Individual patients (columns) are grouped by immune cluster, and measured proteins (rows) are in the same order as that displayed for the discovery cohort (see Figure 2A). The heatmap shows standardized protein MFI measurements as color-coded z-scores. [B]. Principal component analysis of proteomic profiles by cluster. In a scatter plot of the first two principal components (PC1 vs PC2), the multivariable proteomic data for each patient is represented by a single point and colored by immune cluster assignment. [C]. Survival analysis. Kaplan-Meier estimates of cluster survival are shown from the time of proteomic sampling and compared by log-rank test. No censoring occurred, as five-year survival data was available for all patients.
Figure 6.
Figure 6.. Proteomic network signal for molecular functions and pathways by PAH cluster.
For protein sets that relate to certain biological functions and pathways, plasma expression levels and network centrality measures are compared graphically across PAH clusters (centrality measures derive from the network analysis executed in Online Figures III-IV). Each figure panel denotes a set of functionally-related proteins, where rows correspond to the PAH clusters. For each protein, displayed circle size is proportional to the mean plasma expression level in a given cluster (z-score relative to overall cohort mean). Circle color represents quantified network centrality for the protein node (mean z-score of strength, closeness, and betweenness relative to other network nodes in the cluster).

Comment in

References

    1. Simonneau G, Gatzoulis MA, Adatia I, Celermajer D, Denton C, Ghofrani A, Gomez Sanchez MA, Krishna Kumar R, Landzberg M, Machado RF, Olschewski H, Robbins IM and Souza R. Updated clinical classification of pulmonary hypertension. J Am Coll Cardiol 2013;62:D34–41. - PubMed
    1. Barnes JW and Dweik RA. Pulmonary Hypertension and Precision Medicine through the “Omics” Looking Glass. Am J Respir Crit Care Med 2017;195:1558–1560. - PMC - PubMed
    1. Dweik RA, Rounds S, Erzurum SC et al. and Phenotypes ATSCoPH. An official American Thoracic Society Statement: pulmonary hypertension phenotypes. Am J Respir Crit Care Med 2014;189:345–55. - PMC - PubMed
    1. Robbins IM, Moore TM, Blaisdell CJ and Abman SH. National Heart, Lung, and Blood Institute Workshop: improving outcomes for pulmonary vascular disease. Circulation. 2012;125:2165–70. - PMC - PubMed
    1. Newman JH, Rich S, Abman SH et al. Enhancing Insights into Pulmonary Vascular Disease through a Precision Medicine Approach. A Joint NHLBI- Cardiovascular Medical Research and Education Fund Workshop Report. Am J Respir Crit Care Med 2017;195:1661–1670. - PMC - PubMed

Publication types