. 2019 Feb 7;176(4):729-742.e18.
doi: 10.1016/j.cell.2018.12.009. Epub 2019 Jan 17.

Human Semaphorin 3 Variants Link Melanocortin Circuit Development and Energy Balance

Affiliations

Human Semaphorin 3 Variants Link Melanocortin Circuit Development and Energy Balance

Agatha A van der Klaauw et al. Cell. .

Abstract

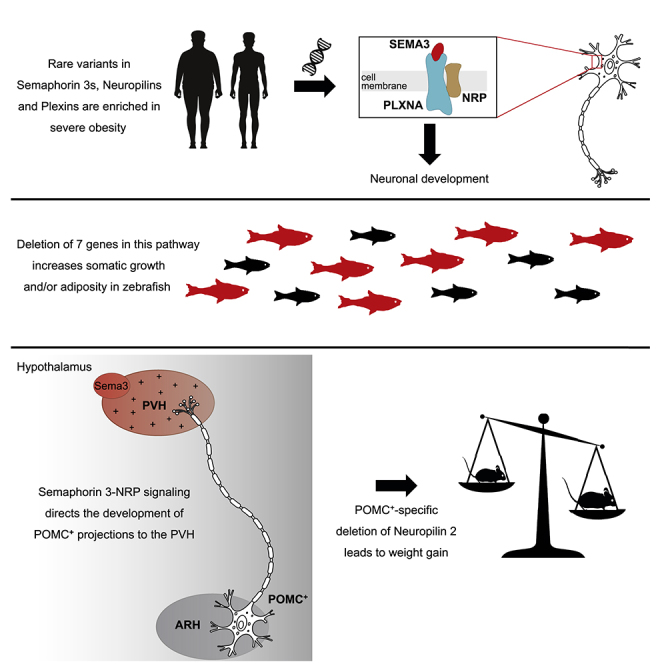
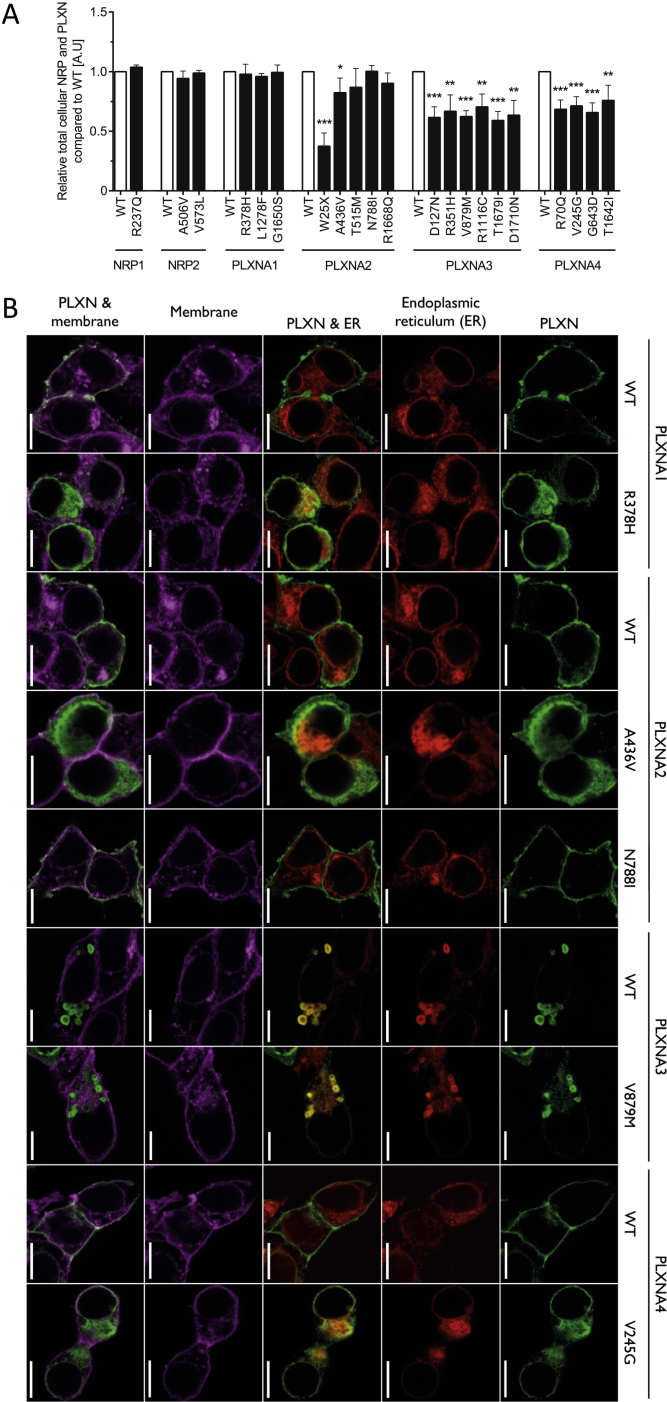
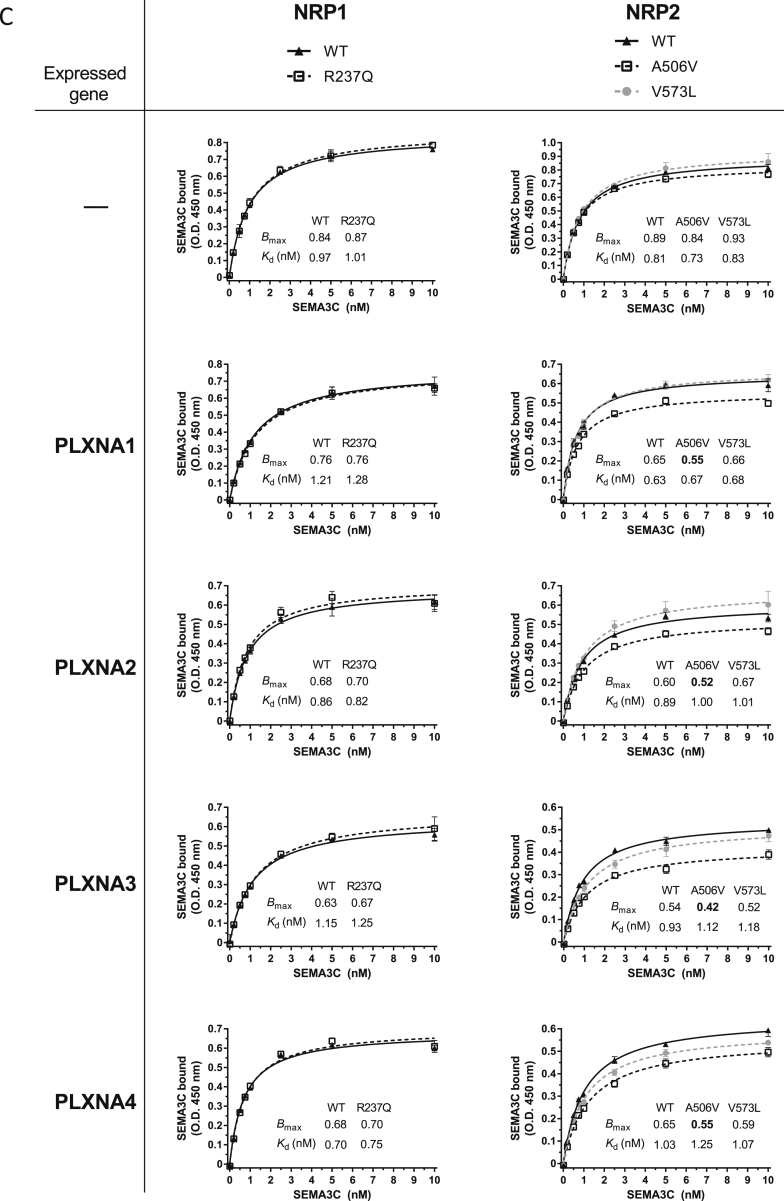
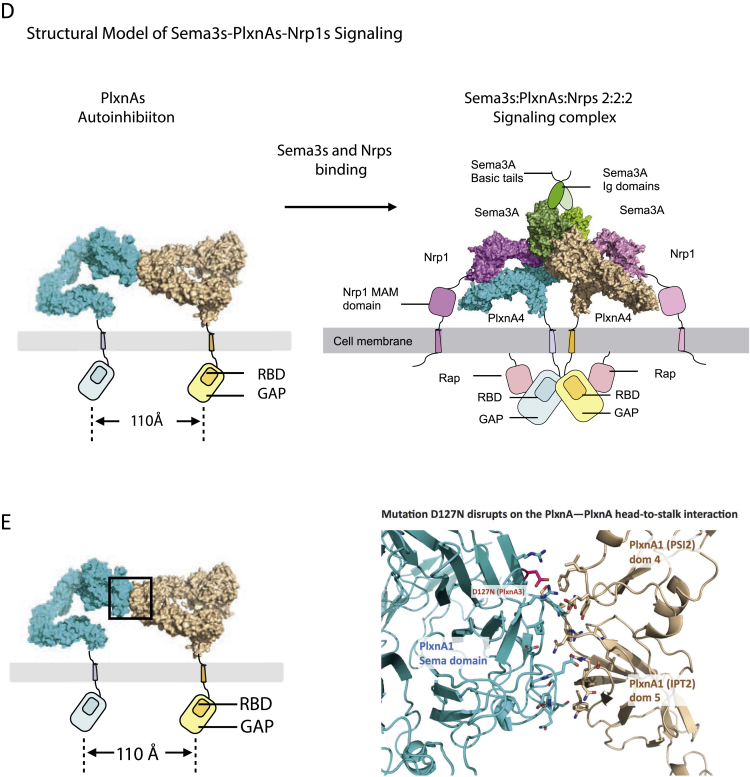
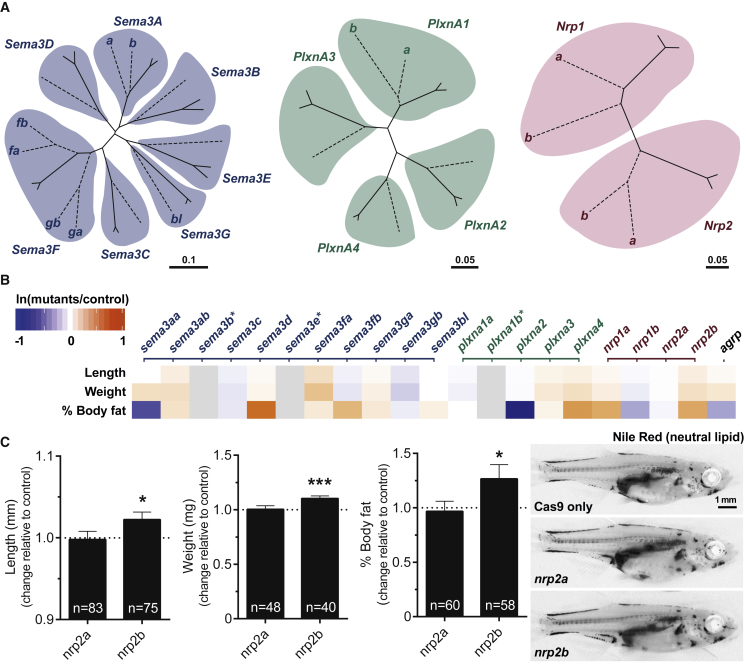
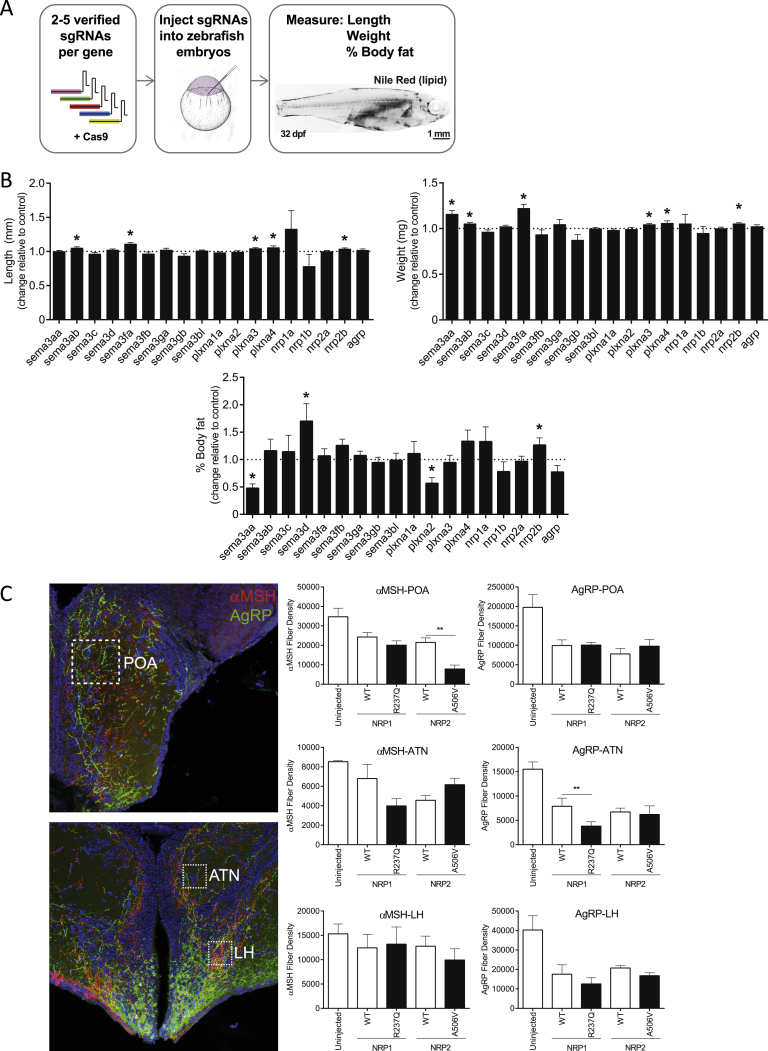
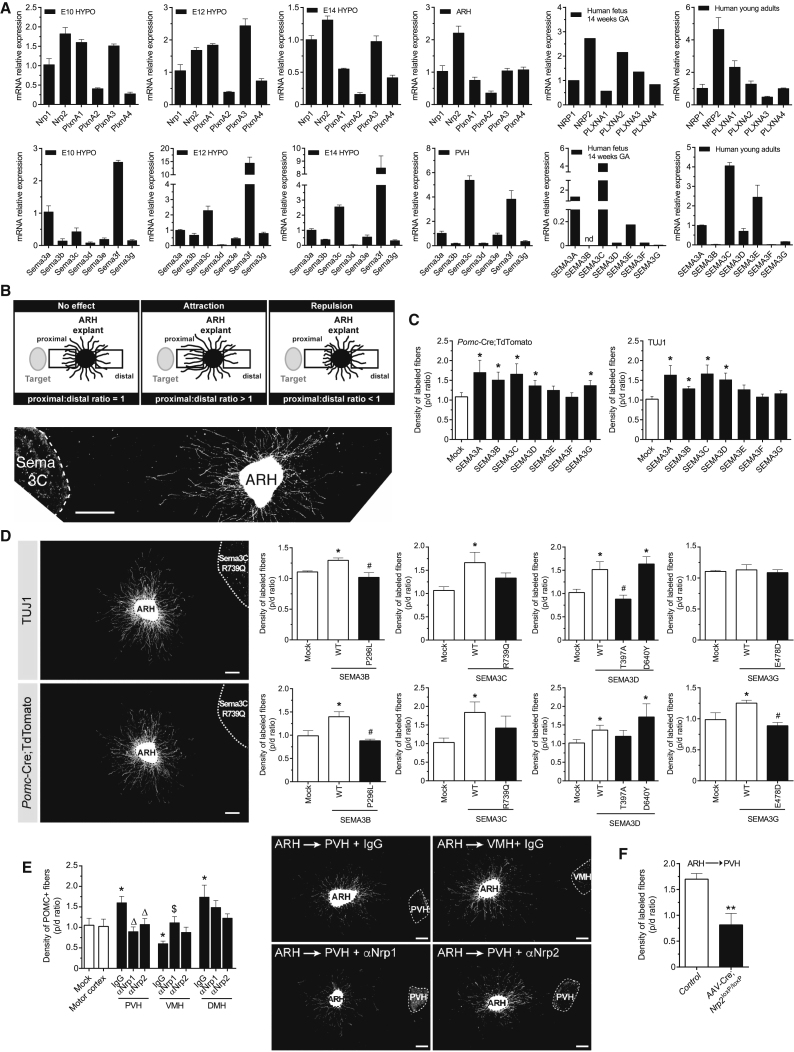
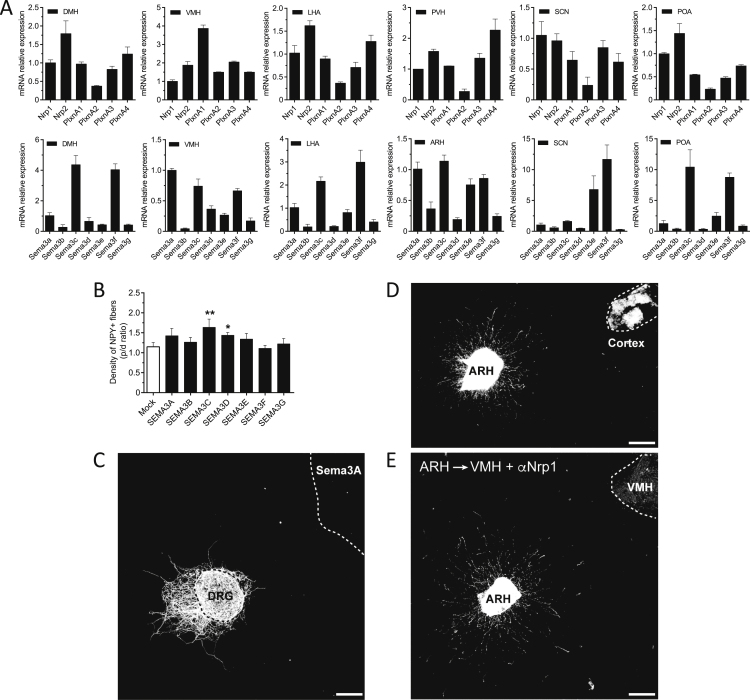
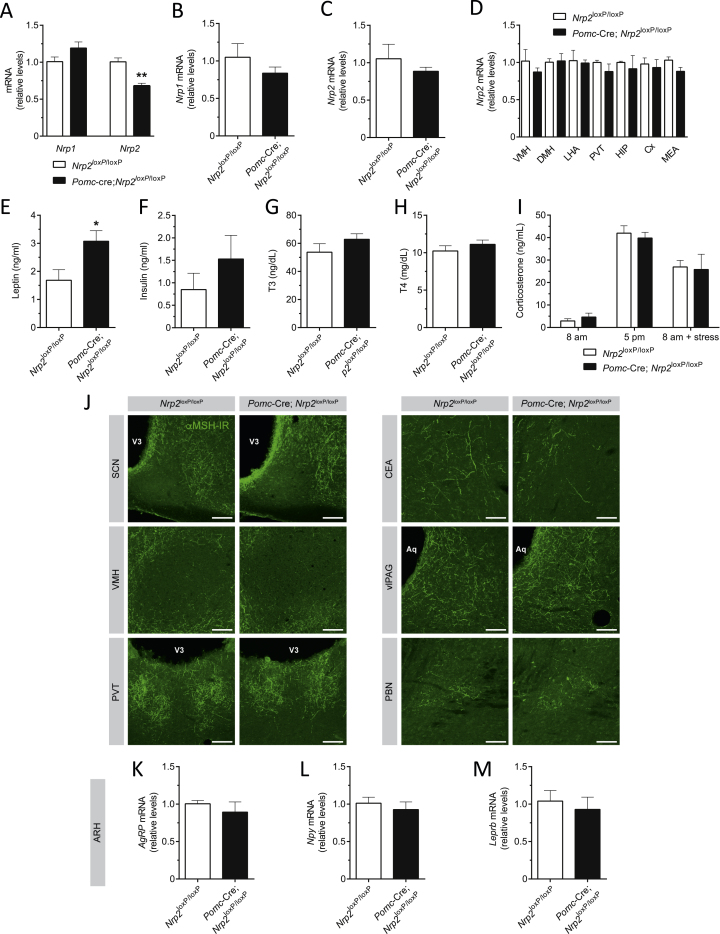
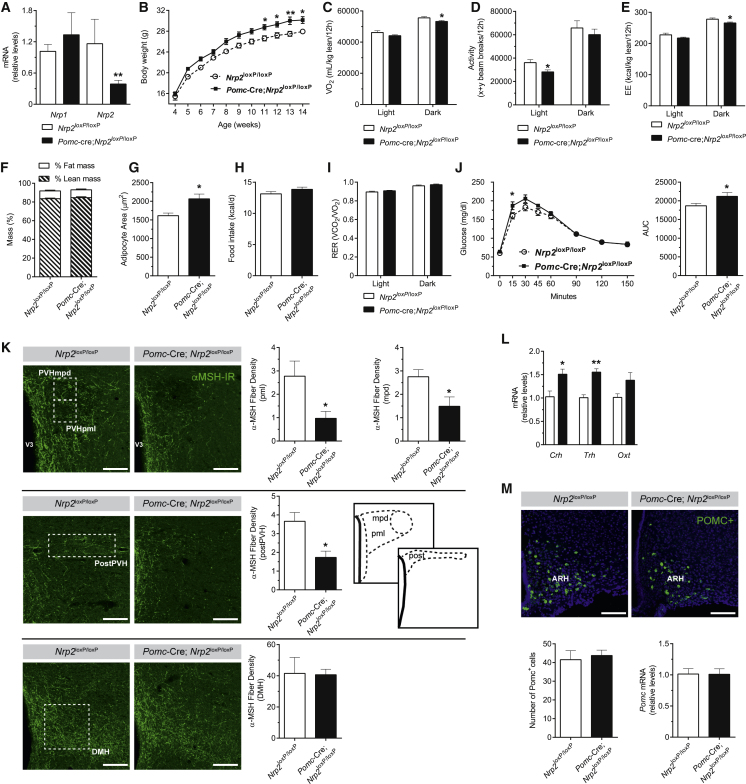
Hypothalamic melanocortin neurons play a pivotal role in weight regulation. Here, we examined the contribution of Semaphorin 3 (SEMA3) signaling to the development of these circuits. In genetic studies, we found 40 rare variants in SEMA3A-G and their receptors (PLXNA1-4; NRP1-2) in 573 severely obese individuals; variants disrupted secretion and/or signaling through multiple molecular mechanisms. Rare variants in this set of genes were significantly enriched in 982 severely obese cases compared to 4,449 controls. In a zebrafish mutagenesis screen, deletion of 7 genes in this pathway led to increased somatic growth and/or adiposity demonstrating that disruption of Semaphorin 3 signaling perturbs energy homeostasis. In mice, deletion of the Neuropilin-2 receptor in Pro-opiomelanocortin neurons disrupted their projections from the arcuate to the paraventricular nucleus, reduced energy expenditure, and caused weight gain. Cumulatively, these studies demonstrate that SEMA3-mediated signaling drives the development of hypothalamic melanocortin circuits involved in energy homeostasis.

Keywords: AgRP; Neuropilins; Plexins; Pomc; Semaphorin 3s; hypothalamus; obesity.


Figures

None
Graphical abstract
Figure 1
Figure 1
Rare Human Variants in SEMA3A-G Disrupt Protein Secretion and Signaling (A) Structural modeling of SEMA3 variants. Upper panel: SEMA3 variants on a schematic representation (mouse Sema3A numbering). SS, signal sequence; Sema, semaphorin domain; PSI, plexin-semaphorin-integrin domain; conserved furin cleavage sites indicated by scissors; conserved cysteines that form SEMA3A-G dimers (orange line). Lower panel: SEMA3A-G mutants mapped onto human SEMA3A structure (increase, blue; decrease, red; no effect, gray; on U87MG cell collapse). Sema and PSI domains on mouse Sema3A crystal structure (PDB: 4GZ8); Ig domain, model combining human SEMA4D (PDB: 1OLZ) and mouse Sema3A (PDB: 4GZ8) structural data; c-terminal basic domain, schematic. (B) ELISA analysis of C-FLAG-tagged WT/mutant SEMA3A-G secreted in the medium (a.u., arbitrary units). (C) Effect of WT/mutant SEMA3A-G on cell collapse normalized to amount of semaphorin secreted. (D) Structural analysis of SEMA3 mutants affecting cell collapse (increased, blue; decreased, red). Mutants are mapped on the crystal structure of the mouse Sema3A-Nrp1-PlxnA2 complex (PDB: 4GZA). Data represented as mean ± SEM from at least three independent experiments. p < 0.05; ∗∗p < 0.01; ∗∗∗p < 0.001 for all experiments. See also Figure S1 and Table S3.
Figure S1
Figure S1
Functional Characterization of Rare Human Variants in SEMA3A-G, Related to Figure 1 (A) Total expression of C-FLAG-tagged SEMA3A-G by ELISA analysis (A.U., arbitrary units). (B) Western blotting of total cellular and secreted SEMA3A-G. (C) Dimerization analysis using reducing and non-reducing western blotting of total cellular and secreted SEMA3G. (D) Collapse efficiency was assessed by counting the proportion of collapsed cells 30 min following addition of the indicated WT Semaphorin to the culture medium. (E) Effect of SEMA3A-G on cell collapse unadjusted for the amount of semaphorin secreted. Data are presented as mean ± SEM from at least 3 independent experiments; p < 0.05, ∗∗p < 0.01 and ∗∗∗p < 0.001.
Figure 2
Figure 2
Rare Human Variants in Neuropilins 1-2 and Plexins A1-4 Disrupt Cellular Localization and Signaling (A) Cell-surface localization for WT/mutant NRP1-2 and PLXNA1-4 by ELISA. (B) Effect of WT/mutant NRP1-2 and PLXNA1-4 on semaphorin-induced cell collapse. (C) Total binding (Bmax) in cells expressing WT/mutant NRP1-2 or co-expressing NRP1-2 mutants and WT PLXNA1-4. (D) Structural modeling of PLXNA mutants. Upper panel: PLXNA1-4 variants shown on schematic (mouse PlxnA1 numbering). SS, signal sequence; PSI, plexin-semaphorin-integrin; IPT, Ig domain. Lower panel: PLXNA mutants mapped onto the crystal structure of mouse PlxnA1 ectodomain (PDB: 5L56). (E) PLXNA mutants mapped onto the crystal structure of mouse PlxnA3 intracellular domain (PDB: 3IG3). (F) Upper panel: NRP variants shown on the schematic (mouse Nrp1 numbering). Lower panel: NRP1-2 variants mapped onto the crystal structure of mouse Nrp1 (PDB: 4GZ9). The membrane-proximal MAM (meprin, A-5 protein, and receptor protein-tyrosine phosphatase mu) domain of Nrp is represented schematically. RBD, Rho GTPase-binding domain; GAP, GTPase-activating protein; TM, transmembrane; JM, Juxtamembrane. The neuropilin ectodomain comprises two CUB domains (a1 and a2), two coagulation factor V/VIII homology domains (b1 and b2) and a MAM domain, L, linker. In (D)–(F), variants causing decreased surface expression (red), no effect on surface expression (gray), decreased surface expression as well as decreased cell collapse (blue) are shown. Data represented as mean ± SEM from at least three independent experiments. p < 0.05; ∗∗p < 0.01; ∗∗∗p < 0.001. See also Figure S2.
Figure S2
Figure S2
Functional Characterization of Rare Human Variants in Neuropilins 1-2 and Plexins A1-4, Related to Figure 2 (A) Total expression of WT and mutant NRP1-2 and PLXNA1-4 by ELISA on permeabilised HEK293 cells (A.U, arbitrary units). (B) Confocal microscopy of Cos-7 cells showing the co-localization of transiently expressed WT and mutant PLXNA1-4 (green) with plasma membrane (magenta) and endoplasmic reticulum (red) markers. Scale bars represent 10 μm. (C) Saturation receptor-ligand binding assay. Cells expressing WT/mutant NRP1-2 or co-expressing mutant NRP1-2 and WT PLXNA1-4 were incubated with increasing amounts of recombinant human SEMA3C and the equilibrium dissociation constant (kd) of the interaction and the total binding (Bmax) were calculated. (D) Structural model of SEMA3s signaling via the PLXNA receptors and co-receptor NRP1 or 2. (E) Variant PXLNA2 D127N locates on the PLXNA-PLXNA interface important for pre-signaling auto-inhibition. Data are presented as mean ± SEM from at least 3 independent experiments; p < 0.05, ∗∗p < 0.01 and ∗∗∗p < 0.001.
Figure S2
Figure S2
Functional Characterization of Rare Human Variants in Neuropilins 1-2 and Plexins A1-4, Related to Figure 2 (A) Total expression of WT and mutant NRP1-2 and PLXNA1-4 by ELISA on permeabilised HEK293 cells (A.U, arbitrary units). (B) Confocal microscopy of Cos-7 cells showing the co-localization of transiently expressed WT and mutant PLXNA1-4 (green) with plasma membrane (magenta) and endoplasmic reticulum (red) markers. Scale bars represent 10 μm. (C) Saturation receptor-ligand binding assay. Cells expressing WT/mutant NRP1-2 or co-expressing mutant NRP1-2 and WT PLXNA1-4 were incubated with increasing amounts of recombinant human SEMA3C and the equilibrium dissociation constant (kd) of the interaction and the total binding (Bmax) were calculated. (D) Structural model of SEMA3s signaling via the PLXNA receptors and co-receptor NRP1 or 2. (E) Variant PXLNA2 D127N locates on the PLXNA-PLXNA interface important for pre-signaling auto-inhibition. Data are presented as mean ± SEM from at least 3 independent experiments; p < 0.05, ∗∗p < 0.01 and ∗∗∗p < 0.001.
Figure 3
Figure 3
Disruption of Semaphorin 3 S, Neuropilins, and Plexins Alters Energy Homeostasis in Zebrafish (A) Unrooted phylogenetic trees of Sema3, PlxnA, and Nrp genes. Genes from zebrafish (dotted lines) and mouse and human (solid lines) were used to construct the trees. Where zebrafish genes have been duplicated, a letter is used to identify paralogs. Scale bars, number of substitutions per amino acid site. (B) Heatmap showing change in length, weight, and percentage of body fat in deletion mutants relative to Cas9-only control fish; decrease (blue), increase (orange) in the phenotype of mutants relative to control fish (for the natural log fold change); genes not screened; agrp, positive control. (C) Length (mm), weight (mg) and percentage of body fat in nrp2a and nrp2b mutant fish relative to Cas9-only injected control fish. Data represented as mean ± SEM. p < 0.05; ∗∗∗p < 0.001 in one-sample t tests. Representative images of Nile Red-stained zebrafish showing increased adiposity and size of nrp2b mutant fish (right). Scale bar, 1 mm. See also Figure S3.
Figure S3
Figure S3
Generation and Characterization of Semaphorin-Neuropilin-Plexin Deletion Mutants in Zebrafish, Related to Figure 3 (A) Schematic illustrating the mutagenesis strategy to target sema3, plxna and nrp genes in zebrafish. Two-five sgRNAs were generated to mutagenize each zebrafish gene. Only sgRNAs verified to induce mutagenesis were injected into one-cell stage zebrafish embryos. Zebrafish were raised to ∼30 days post fertilization and fish length (mm), weight (mg) and % body fat were quantified. (B) Results on fish length (mm), weight (mg) and % body fat for all deletion mutants (summarized in Figure 3B). (C) Microphotographs and quantification of the density of α-melanocyte-stimulating hormone (αMSH) (red) and agouti-related peptide (AgRP) (green) immunoreactive (IR) fibers innervating the preoptic area (POA), anterior tuberal nucleus of hypothalamus (ATN), and lateral hypothalamic nucleus (LH) of 35-day-old wild-type zebrafish overexpressing NRP1 and NRP2; p < 0.05 in one-sample t tests.
Figure 4
Figure 4
Class 3 Semaphorins and their receptors are expressed in the developing hypothalamus and direct innervation of the paraventricular nucleus of the hypothalamus by arcuate Pomc axons (A) Expression of Neuropilin (NRP1-2), PlexinA (PLXNA1-A4), and Semaphorin (SEMA3A-G) mRNA in the hypothalamus (HYPO) of mouse fetuses at embryonic day E10/12/14, in hypothalamic nuclei of P10 mice (ARH-arcuate; PVH-paraventricular nucleus of the hypothalamus), in the hypothalamus from human fetuses at 14 weeks of gestational age (GA), and from human young adults; values relative to GAPDH expression shown. (B) In a co-culture system to evaluate neural growth, the average density of neurites in the proximal and distal parts of the ARH explant (with respect to the target tissue, e.g., PVH) is compared to quantify the density of axons extending toward (proximal) or away (distal) from cell aggregates. (C) ARH explants from Pomc-Cre; TdTomato mice were co-cultured with an aggregate of HEK293 cells overexpressing Sema3A-G and immunostained with TUJ1 (neuron-specific class III beta-tubulin). (D) Quantitative analysis of TUJ1+ (upper panel) and Pomc+ (lower panel) axons derived from arcuate explants co-cultured with an aggregate of HEK293 cells overexpressing SEMA3A-G mutants (p < 0.05 versus mock; #p < 0.05 versus WT). ARH, arcuate nucleus. (E) ARH explants derived from Pomc-Cre, TdTomato mice were co-cultured with explants containing the PVH, DMH, or VMH and Nrp1 or Nrp2 blocking antibodies (α). Data represented as mean ± SEM. p < 0.05 versus mock; Δ, p < 0.05 versus PVH immunoglobin (IgG); $, p < 0.05 versus VMH IgG. (F) ARH explants derived from Nrp2loxP/loxP mice that received intra-ARH injections of an AAV-Cre vector with explants containing the PVH. Genetic loss of Nrp2 in the ARH causes a significant reduction in ARH axon growth. ∗∗p < 0.01 versus control. Scale bars, 250 μm (B) and 100 μm (D and E). See also Figure S4.
Figure S4
Figure S4
Expression of Class 3 Semaphorins and Their Receptors in the Developing Hypothalamus and Specificity of Co-Culture Assays, Related to Figure 4 (A) Expression of Semaphorin (Sema3A-G), Neuropilin (Nrp1-2), PlexinA (PlxnA1-A4) mRNA in microdissected hypothalamic nuclei of P10 mice; compared to expression of GAPDH. (B) Quantitative analysis of NPY+ axons derived from arcuate explants co-cultured with an aggregate of HEK293 cells overexpressing Sema3A-G. (C) Representative image showing an isolated explant derived from the dorsal root ganglion (DRG) and co-cultured with an aggregate of HEK293 cells overexpressing Sema3A. (D) Representative image showing an ARH explant co-cultured with a cortical explant. (E) Representative image showing ARH explants derived from Pomc-Cre, TdTomato mice co-cultured with explants containing the VMH in the presence of Nrp1 blocking antibodies (α). Data are represented as mean ± SEM. p < 0.05 and ∗∗p < 0.01 versus mock. ARH, arcuate nucleus of the hypothalamus; DMH, dorsomedial nucleus of the hypothalamus; LHA, lateral hypothalamic area; POA, preoptic area; SCN, suprachiasmatic nucleus; VMH, ventromedial nucleus of the hypothalamus.
Figure S5
Figure S5
Metabolic and Neuroanatomical Characterization of Pomc-Cre; Nrp2loxP/loxP Mice, Related to Figure 5 (A) Expression of Nrp1 and Nrp2 mRNA in the arcuate nucleus of the hypothalamus of adult Nrp2loxP/loxP and Pomc-Cre; Nrp2loxP/loxP mice; values relative to GAPDH expression are shown. (B–D) (B)Relative levels of Nrp1 in the pituitary of adult Nrp2loxP/loxP (control) and Pomc-Cre; Nrp2loxP/loxP (mutant) mice. Nrp2 mRNA expression in (C) the pituitary, and (D) ventromedial nucleus of the hypothalamus (VMH), dorsomedial nucleus of the hypothalamus (DMH), lateral hypothalamic area (LHA), paraventricular nucleus of the thalamus (PVT), hippocampus (HIP), cortex (Cx), and medial amygdala (MEA) of Nrp2loxP/loxP (control) and Pomc-Cre; Nrp2loxP/loxP (mutant) mice. (E–I) (E) Serum leptin, (F) insulin, (G) triiodothyronine (T3), (H) thyroxine (T4), and (I) corticosterone levels of adult Nrp2loxP/loxP and Pomc-Cre; Nrp2loxP/loxP mice. (J) Representative confocal images showing α-melanocyte-stimulating hormone (αMSH)-immunoreactive (IR) fibers in the brain of adult Nrp2loxP/loxP and Pomc-Cre; Nrp2loxP/loxP mice. (K–M) Relative levels of (K) Agouti-related peptide (Agrp), (L) neuropeptide Y (Npy), and (M) leptin receptor (Leprb) mRNA in the arcuate nucleus of the hypothalamus of adult Nrp2loxP/loxP and Pomc-Cre; Nrp2loxP/loxP mice. Data are presented as mean ± SEM. p < 0.05, ∗∗p < 0.01 versus Nrp2loxP/loxP mice. Aq, aqueduct; ARH, arcuate nucleus of the hypothalamus; CEA, central nucleus of the amygdala; vlPAG, ventrolateral periaqueductal gray matter; PBN, parabrachial nucleus; PVT, paraventricular nucleus of the thalamus; SCN, suprachiasmatic nucleus; VMH, ventromedial nucleus of the hypothalamus; V3, third ventricle. Scale bars, 100 μm.
Figure 5
Figure 5
Loss of Neuropilin 2 Signaling in Pomc Neurons Causes Reduced Energy Expenditure and Weight Gain in Mice and Disrupts Arcuate Pomc Projections to the PVH (A) Expression of Nrp1 and Nrp2 mRNA in sorted POMC+ neurons of adult Nrp2loxP/loxP and Pomc-Cre; Nrp2loxP/loxP mice; values relative to GAPDH expression shown. (B–J) Body weight (B), oxygen consumption (C), locomotor activity (D), energy expenditure (E), body composition (F), adipocyte area (G), average food intake (H), respiratory exchange rate (RER) (I), and glucose tolerance test and area under the curve (AUC) (J) of adult Nrp2loxP/loxP (control) and Pomc-Cre; Nrp2loxP/loxP (mutant) mice. (K) Microphotographs and quantification of the density of α-melanocyte-stimulating hormone (αMSH)-immunoreactive (IR) fibers innervating the neuroendocrine paraventricular nucleus of the hypothalamus (PVHpml and PVHmpd), pre-autonomic PVH (postPVH), and DMH of adult Nrp2loxP/loxP and Pomc-Cre; Nrp2loxP/loxP mice. (L) Relative expression of corticotropin-releasing factor (Crh), thyrotropin-releasing hormone (Trh), and oxytocin (Oxt) mRNA in the PVN of the hypothalamus of adult Nrp2loxP/loxP and Pomc-Cre; Nrp2loxP/loxP mice. (M) Microphotographs and quantification of Pomc-expressing neurons and relative levels of Pomc mRNA in the ARH of adult Nrp2loxP/loxP and Pomc-Cre; Nrp2loxP/loxP mice. Data represented as mean ± SEM. p < 0.05; ∗∗p < 0.01 versus Nrp2loxP/loxP. ARH, arcuate nucleus of the hypothalamus; DMH, dorsomedial nucleus of the hypothalamus; PVH, paraventricular nucleus of the hypothalamus; PVHmpd, dorsal component of the medial parvicellular PVH; PVHpml, lateral magnocellular PVH; post PVH, posterior part of the PVH; V3, third ventricle. Scale bars, 100 μm. See also Figure S5.

Comment in

References

    1. Abecasis G.R., Altshuler D., Auton A., Brooks L.D., Durbin R.M., Gibbs R.A., Hurles M.E., McVean G.A., 1000 Genomes Project Consortium A map of human genome variation from population-scale sequencing. Nature. 2010;467:1061–1073. - PMC - PubMed
    1. Agarwala V., Flannick J., Sunyaev S., Altshuler D., GoT2D Consortium Evaluating empirical bounds on complex disease genetic architecture. Nat. Genet. 2013;45:1418–1427. - PMC - PubMed
    1. Balthasar N., Coppari R., McMinn J., Liu S.M., Lee C.E., Tang V., Kenny C.D., McGovern R.A., Chua S.C., Jr., Elmquist J.K., Lowell B.B. Leptin receptor signaling in POMC neurons is required for normal body weight homeostasis. Neuron. 2004;42:983–991. - PubMed
    1. Berglund E.D., Vianna C.R., Donato J., Jr., Kim M.H., Chuang J.C., Lee C.E., Lauzon D.A., Lin P., Brule L.J., Scott M.M. Direct leptin action on POMC neurons regulates glucose homeostasis and hepatic insulin sensitivity in mice. J. Clin. Invest. 2012;122:1000–1009. - PMC - PubMed
    1. Bouret S.G., Draper S.J., Simerly R.B. Trophic action of leptin on hypothalamic neurons that regulate feeding. Science. 2004;304:108–110. - PubMed

Publication types

MeSH terms