. 2019 May 7;29(5):1151-1165.e6.
doi: 10.1016/j.cmet.2018.12.020. Epub 2019 Jan 17.

Loss of BCAA Catabolism during Carcinogenesis Enhances mTORC1 Activity and Promotes Tumor Development and Progression

Affiliations

Loss of BCAA Catabolism during Carcinogenesis Enhances mTORC1 Activity and Promotes Tumor Development and Progression

Russell E Ericksen et al. Cell Metab. .

Abstract

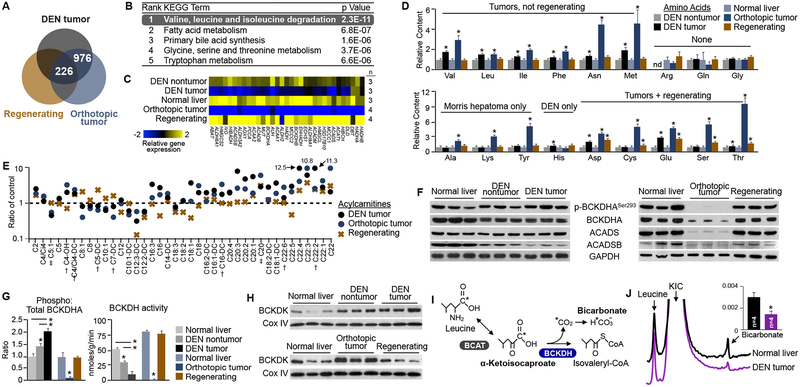
Tumors display profound changes in cellular metabolism, yet how these changes aid the development and growth of tumors is not fully understood. Here we use a multi-omic approach to examine liver carcinogenesis and regeneration, and find that progressive loss of branched-chain amino acid (BCAA) catabolism promotes tumor development and growth. In human hepatocellular carcinomas and animal models of liver cancer, suppression of BCAA catabolic enzyme expression led to BCAA accumulation in tumors, though this was not observed in regenerating liver tissues. The degree of enzyme suppression strongly correlated with tumor aggressiveness, and was an independent predictor of clinical outcome. Moreover, modulating BCAA accumulation regulated cancer cell proliferation in vitro, and tumor burden and overall survival in vivo. Dietary BCAA intake in humans also correlated with cancer mortality risk. In summary, loss of BCAA catabolism in tumors confers functional advantages, which could be exploited by therapeutic interventions in certain cancers.

Keywords: branched-chain amino acids; cancer; cancer metabolism; dietary intake; hepatocellular carcinoma; mTORC1; metabolomics; transcriptomics.


Conflict of interest statement

Declaration of Interests

The authors declare no competing interests.

Figures

Figure 1.
Figure 1.. BCAA Catabolism Is Suppressed During Hepatocellular Carcinoma Development and Progression
(A) Comparison of gene expression changes in hepatocellular carcinomas (HCCs) relative to adjacent nontumor liver tissues, collected at Singapore General Hospital (SGH) or characterized by the cancer genome atlas (TCGA-LIHC). (B) 1405 genes were similarly altered in both cohorts with high significance (p<1×10⁻⁸). (C) KEGG pathway analysis of the 1405 gene set. (D) Summary of branched-chain amino acid (BCAA) catabolic enzyme transcript levels across HCCs and nontumor liver tissues of both cohorts. (E) Immunoblots of selected BCAA catabolic enzymes from paired HCCs and nontumor liver tissues from patients of the SGH cohort. (F) Representative immunohistochemical micrographs from nontumor liver tissue and HCC biopsies, as profiled by The Human Protein Atlas. (G) Ex vivo tissue BCKDH complex activity from paired HCCs and nontumor liver tissues from patients of the SGH cohort (n=6 per group). (H) Summary of all significantly different metabolites from targeted metabolomics analyses from paired HCCs and nontumor liver tissues from patients of the SGH cohort (n=7 per group). (I) Summary of BCAA catabolic enzyme transcript levels in HCCs from the SGH and TCGA cohorts, sorted by stage, grade, metastasis, vascular invasion, and local invasion. (J) Kaplan-Meier survival estimate curves for patients ranked by a combined index of tumor BCKDHA, ACADS, and ACADSB expression. P-values for log-rank test and cox proportional hazard ratios (HR, with 95% percent confidence intervals) adjusted for age, sex, tumor stage and grade, and radiation, prescription and additional therapies shown. *P<0.05, compared to respective controls. Data are shown as mean ± s.e.m. See also Figure S1.
Figure 2.
Figure 2.. Loss of BCAA Catabolism Occurs in Liver Tumors, but Not Regenerating Liver Tissues
(A-E) Transcriptomic and metabolomic characterization of animal tumor models. DEN-induced tumors are compared to DEN nontumor tissue, and orthotopic tumors (Morris Hepatoma) and regenerating liver tissue after partial hepatectomy are compared to normal liver tissue. (A) Summary of significant, differentially-expressed genes. (B) KEGG pathway analysis of the 976 genes differentially expressed in tumors but not regenerating tissues. (C) Summary of BCAA catabolic enzyme transcript levels across normal, tumor, and regenerating tissues. (D) Quantification of tissue amino acid content, normalized to respective controls. nd=not detected. (E) Quantification of tissue acylcarnitine content, normalized to respective controls. Only acylcarnitines that trended in the same direction in both tumor models are shown. †P<0.05, in 1 of 2 tumor models, ‡P<0.05 in both tumor models, compared to respective controls, while not significantly different in regenerating tissue. (F) Immunoblots of selected BCAA catabolic enzymes in normal, tumor, and regenerating liver tissues. (G) Quantification of phospho:total BCKDHA ratio, and corresponding ex vivo tissue BCKDH complex enzymatic activity. (H) Immunoblots of mitochondrial fractions from normal, tumor, and regenerating liver tissues. (I) Schematic of magnetic resonance spectroscopy (MRS)-based in vivo BCKDH complex activity assay. Hyperpolarized [1-C13] α-ketoisocaproate was injected by tail vein, and enzyme activity was assessed by detection of labeled bicarbonate in the liver in live, anesthetized animals. (J) Representative liver MRS spectra after intravenous injection of hyperpolarized [1-C13]α-ketoisocaproate (KIC). Baselines are shifted to display the difference in bicarbonate peak. Quantification of relative bicarbonate levels over a 30 second interval inset. *P<0.05, compared to respective controls; Data are shown as mean ± s.e.m. See also Figure S2.
Figure 3.
Figure 3.. Loss of BCAA Catabolic Enzyme Expression Is Associated with Changes in Copy Number Variation and Transcription Factor Expression/Activity
(A) Summary of BCAA catabolic enzyme transcript levels in nontumor liver tissues, and tumors with or without CNV loss of indicated gene. (B) Distribution of CNV losses of the BCAA catabolic enzymes in the TCGA-LIHC cohort, sorted by unsupervised hierarchical clustering. (C) Summary of BCAA catabolic enzyme expression in nontumorigenic (HepG2) and tumorigenic (remaining) hepatoma/HCC-derived cell lines. (D) Immunoblots of selected BCAA catabolic enzymes across the cell line panel. (E) RT-PCR analysis of BCAA catabolic enzymes from HepG2 cells treated with the PPARα antagonist GW6471 for 48 hours. *P<0.05, compared to respective controls. Data are shown as mean ± s.e.m. See also Figure S3.
Figure 4.
Figure 4.. BCAA Catabolism Regulates mTORC1 Activity and in vitro Cell Proliferation
(A) Immunoblots of mTORCl downstream effectors (S6K and S6) and their activation states (p-S6KThr389 and p-S6ser235/236) in paired HCCs and nontumor liver tissues from patients of the SGH cohort. (B) Real-time proliferation curves, immunoblots detailing knockdown efficiency (BCKDHA) and mTORC1 activity, and intracellular BCAA content of AML12 cells expressing a tet-inducible BCKDHA shRNA in the absence or presence of doxycycline and/or the mTOR inhibitors rapamycin (0.05nM) or Torin 1(0.5nM). (C) Real-time proliferation curves and immunoblots of Hep3B cells grown in media with reduced levels of BCAAs. (D) Real-time proliferation curves and immunoblots of Hep3B cells overexpressing Flag-tagged BCKDHA, ACADS, or ACADSB. (E) Real-time proliferation curves and immunoblots of control and CRISPR-Cas9-mediated BCKDK null Hep3B clones. (F) Real-time proliferation curves of Hep3B cells treated with the BCKDK inhibitor BT2, and immunoblots after 2 hours of BT2 treatment. (G) Calculation of proliferation rates (number of divisions per day) for HCC cell lines treated with BT2. (H) Colocalization of mTOR and the lysosomal marker LAMP2 in Hep3B cells grown in nutrient sufficient (control) media, after 1 hour of amino acid withdrawal, or after 2 hours of BT2 treatment (150μM). Quantification displays Manders overlap of 20 random cells. (I) Immunoblots of 293T cells expressing control vectors (pLOC or Flag-Raptor) or constitutively active components of mTORCbrelated nutrient sensing complexes (HA-RagBS75L/HA-RagCQ99L or Flag-Raptor-Rheb 15) treated with vehicle or indicated concentration of BT2 for 2 hours. (J) Immunoblots of 293T cells with GFP or Sestrin 1, 2, and 3 knockdown, treated with vehicle or indicated concentration of BT2 for 2 hours. *P<0.05, compared to respective controls. Data are shown as mean ± s.e.m. See also Figure S4.
Figure 5.
Figure 5.. High Dietary BCAA Intake Enhances Tumor Development and Growth in vivo
(A-C) Analysis of mice 5 months after DEN injection, fed either a low fat diet (LFD, 10% kcal from fat) or high fat diet (HFD, 45% kcal from fat) with normal or high (+150%, +BCAA) levels of BCAAs. (A) Representative livers from DEN-injected mice. (B) Quantification of tumor incidence and tumor sizes of DEN-injected mice. (C) Liver masses of DEN-injected and control uninjected mice, normalized to total body weight. (D-M) Analysis of mice 8 months after DEN injection fed indicated diets. (D) Representative livers from DEN-injected mice. (E) Quantification of tumor incidence of DEN-injected groups (F) Quantification of the number of tumors (≥3mm) and size of the largest tumor per mouse from DEN-injected mice. (G) Liver masses of DEN-injected and uninjected mice, normalized to total body weight. (H) RT-PCR analysis of BCAA catabolic enzymes of normal liver tissue (from uninjected mice), and nontumor and tumor liver tissues (from DEN-injected mice). Results normalized to normal liver tissue of LFD-fed mice. Statistical analyses summarized in Figure S5A. (I) Quantification of BCAA content in nontumor liver tissues of DEN-injected mice, and its correlation with tumor multiplicity. (J) Quantification of BCAA content in tumors of DEN-injected mice. (K) Representative histological and immunohistochemical analyses of livers from DEN-injected mice. (L) Immunoblots of nontumor liver tissues from DEN-injected mice and quantification of phospho:total p70S6K ratios. *P<0.05 vs. LFD, §P<0.05 vs HFD. Data are shown as mean ± s.e.m. See also Figure S5.
Figure 6.
Figure 6.. Enhancing BCAA Catabolism or Restricting Dietary BCAAs Limits Tumor Burden in vivo
(A,B) Analysis of mice 8 months after DEN injection, fed either LFD+BCAA or HFD+BCAA diets without/with 0.02% BT2. (A) Representative livers. (B) Quantification of the number of tumors (≥3mm) and size of the largest tumor per mouse. (C) Kaplan-Meier survival curves of DEN-injected mice fed LFDs with low (−50%, -lowBCAA), standard, or high (+150%, +BCAA) levels of BCAAs. (D-J) Analysis of mice 12 months after DEN injection, fed indicated diets. (D) Representative livers. (E) Average tumor sizes. (F) Quantification of BCAA content in nontumor liver tissues. (G) Representative histological and immunohistochemical analyses of livers from DEN-injected mice. (H) Liver masses (normalized to total body weight) and nonliver lean body mass of DEN-injected and uninjected mice. (I) RT-PCR analysis of BCAA catabolic enzymes of normal liver tissue (from uninjected mice), and nontumor and tumor liver tissues (from DEN-injected mice). Results normalized to normal liver tissue of LFD-fed mice. Statistical analyses summarized in Figure S5H. (J) Average tumor sizes of DEN-injected mice, based on % kcal from BCAAs and % kcal from total protein. Non-BCAA amino acids were adjusted proportionally to match the total protein content of low- or high-BCAA diets. *P<0.05 vs. LFD, †P<0.05 vs LFD+BCAA, ‡P<0.05 vs HFD+BCAA. Data are shown as mean ± s.e.m. See also Figure S5.
Figure 7.
Figure 7.. The Overall Impact of BCAA Tissue Catabolism and Dietary Intake on Cancer Development, Progression, and Mortality
(A,B) Summary of BCAA catabolic enzyme transcript levels for all cancers profiled by The Cancer Genome Atlas (TCGA) with at least 5 solid normal tissue samples. (A) Heatmap displaying expression in normal and tumor tissues of individual cancers. Cancers are arranged from those with the greatest number of enzymes suppressed (top) to the least (bottom) and genes are arranged from those suppressed in the greatest number of cancers (left) to the least (right). (B) Summary of the BCAA catabolic pathway indicating net expression changes across all tumors. (C) Summary of BCAA catabolic enzyme transcript levels in tumors of the TCGA datasets COADREAD, STAD, ACC, KIRC, KIRP, and KICH, sorted by stage, grade, local invasion, lymph node invasion, and metastasis. (D) Quantification of cox proportional hazard ratios (95% confidence intervals), significance (log-rank p-value), robustness, and difference in days of estimated survival for patients across all cancers profiled by TCGA with at least 15 verified deaths with low tumor expression of ACADS, ACADSB, and BCKDHA. (E,F) Analysis of individuals 50–66 years-old in the NHANES III dataset. (E) Hazard ratios (HR, with 95% confidence intervals) based on BCAA intake, 1adjusted for age, sex, race, total kcal, usual dietary intake, diet change, physical activity, intentional weight loss, waist circumference, smoking, education, and prior diagnosis of cancer, diabetes and cardiovascular disease, 2additionally adjusted for % kcal from other macronutrients. (F) Substitution analysis comparing change in risk when replacing BCAAs with carbohydrate or fat, with the same adjustments as HR2 except total kcal and % kcal from non-BCAA protein. Data are presented as hazard ratio (solid line) with 95% confidence interval (shaded area). (G) Summary of BCAA catabolism in normal, regenerating, and cancerous liver tissues. See also Figure S6 and S7.

References

    1. AICR (2018). Diet, Nutrition, Physical Activity and Cancer: a Global Perspective. Continuous Update Project Expert Report 2018, W.C.R.F.A.I.f.C. Research., ed. (Washington, DC).
    1. Ally A, Balasundaram M, Carlsen R, Chuah E, Clarke A, Dhalla N, Holt RA, Jones SJM, Lee D, Ma Y, et al. (2017). Comprehensive and Integrative Genomic Characterization of Hepatocellular Carcinoma. Cell 169, 1327–1341e1323. - PMC - PubMed
    1. An J, Muoio DM, Shiota M, Fujimoto Y, Cline GW, Shulman GI, Koves TR, Stevens R, Millington D, and Newgard CB (2004). Hepatic expression of malonyl-CoA decarboxylase reverses muscle, liver and whole-animal insulin resistance. Nature medicine 10, 268–274. - PubMed
    1. Bernstein AM, Sun Q, Hu FB, Stampfer MJ, Manson JE, and Willett WC (2010). Major dietary protein sources and risk of coronary heart disease in women. Circulation 122, 876–883. - PMC - PubMed
    1. Boutros PC, Lau SK, Pintilie M, Liu N, Shepherd FA, Der SD, Tsao MS, Penn LZ, and Jurisica I (2009). Prognostic gene signatures for non-small-cell lung cancer. Proc Natl Acad Sci U S A 106, 2824–2828. - PMC - PubMed

Publication types

MeSH terms

Substances