. 2019 Mar 7;24(3):376-389.e8.
doi: 10.1016/j.stem.2018.12.011. Epub 2019 Jan 17.

Organoid-Induced Differentiation of Conventional T Cells from Human Pluripotent Stem Cells

Affiliations

Organoid-Induced Differentiation of Conventional T Cells from Human Pluripotent Stem Cells

Amélie Montel-Hagen et al. Cell Stem Cell. .

Abstract

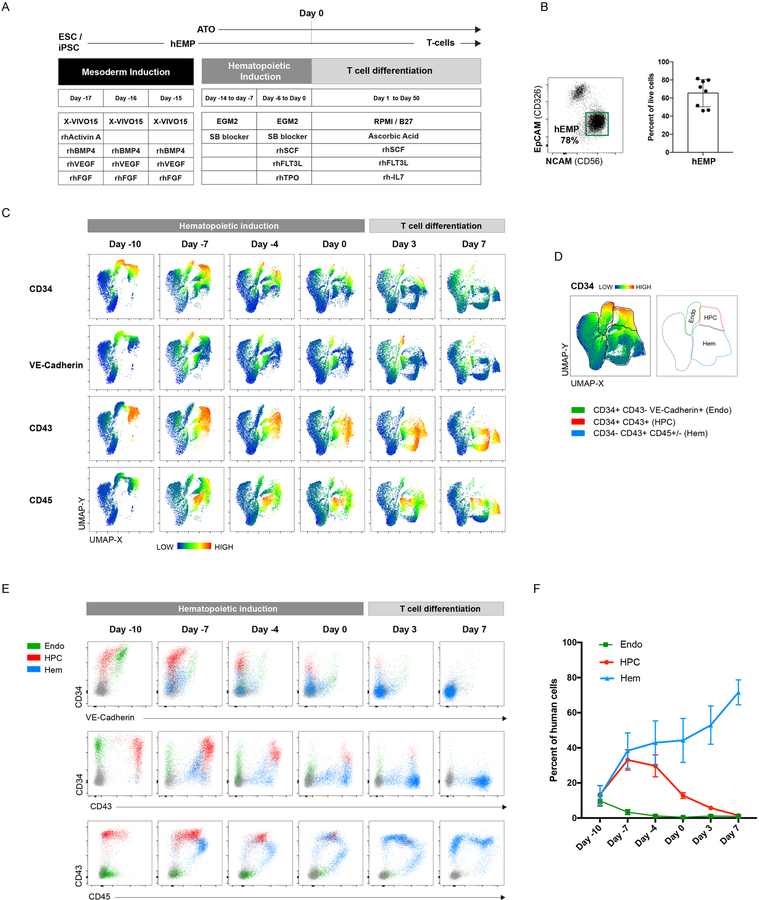
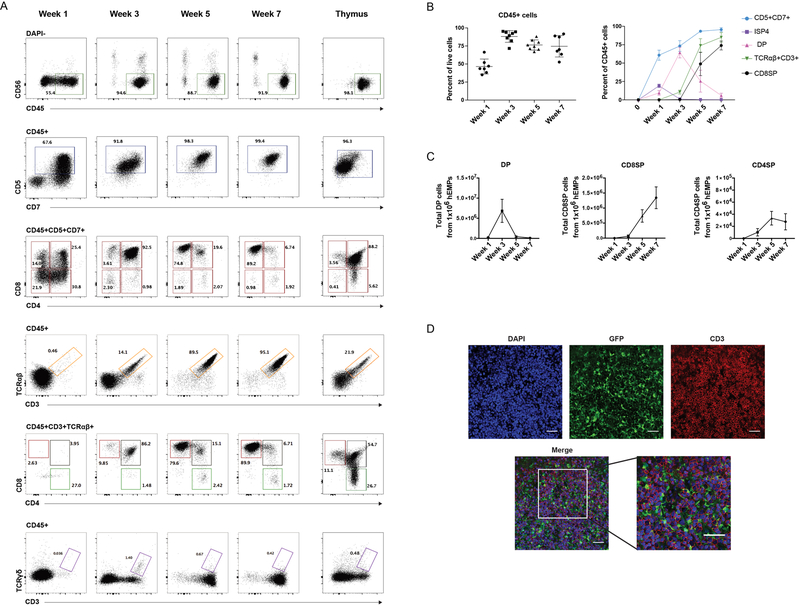
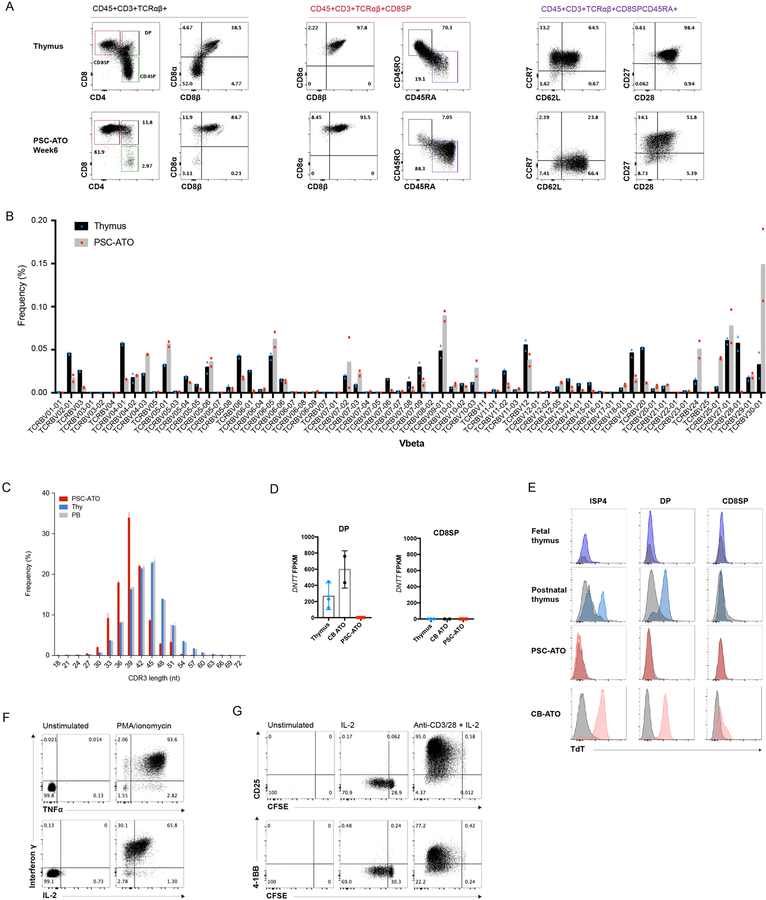
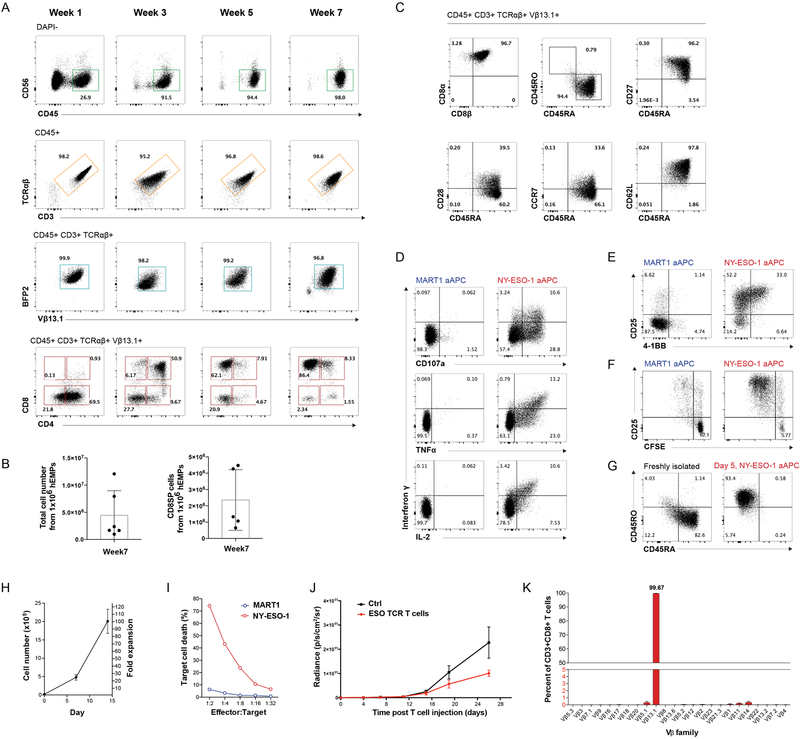
The ability to generate T cells from pluripotent stem cells (PSCs) has the potential to transform autologous T cell immunotherapy by facilitating universal, off-the-shelf cell products. However, differentiation of human PSCs into mature, conventional T cells has been challenging with existing methods. We report that a continuous 3D organoid system induced an orderly sequence of commitment and differentiation from PSC-derived embryonic mesoderm through hematopoietic specification and efficient terminal differentiation to naive CD3+CD8αβ+ and CD3+CD4+ conventional T cells with a diverse T cell receptor (TCR) repertoire. Introduction of an MHC class I-restricted TCR in PSCs produced naive, antigen-specific CD8αβ+ T cells that lacked endogenous TCR expression and showed anti-tumor efficacy in vitro and in vivo. Functional assays and RNA sequencing aligned PSC-derived T cells with primary naive CD8+ T cells. The PSC-artificial thymic organoid (ATO) system presented here is an efficient platform for generating functional, mature T cells from human PSCs.

Keywords: 3D organoids; T cell development; conventional T cells; hematopoiesis; human pluripotent stem cells; immunotherapy; in vitro; lymphopoiesis.


Figures

Figure 1:
Figure 1:. Hematopoietic induction from human pluripotent stem cells (PSCs) in the ATO system.
(A) Schematic of the PSC-ATO differentiation protocol starting from ESC or iPSC. After 3–4 days of mesoderm induction (days −17 to −15), hEMPs are isolated and aggregated with MS5-DLL4 or MS5-DLL1 cells in ATO culture for 2 weeks in hematopoietic induction conditions (days −14 to day 0). T cell differentiation is then initiated within the same ATOs by changing to T cell medium. (B) Representative analysis of hEMP differentiation (n=8) at day −15 after 3.5 days of mesoderm differentiation from H1 ESCs (left panel). hEMP frequency in day −15 cultures across independent experimental replicates (n=8). (C) UMAP analysis of flow cytometry data of different timepoints during hematopoietic induction and T cell differentiation in H1 PSC-ATOs. ATOs were digested to recover all cell populations including adherent cells. Human cells were gated based on negativity for mouse CD29 (expressed by MS5 stromal cells). Heatmaps reflect the mean fluorescence intensity (MFI) of the indicated markers. Data are representative of five independent experiments. (D) Manual gates based on UMAP clusters to broadly categorize cells as endothelial (endo), hematopoietic progenitor (HPC), or differentiated hematopoietic (hem) cells. Gates are shown on a concatenated plot of all timepoints shown in (C) with heatmap coloring based on CD34 MFI (left) or as outlines (right). Extended phenotypes for each population cluster are shown in Supplemental Fig. 1B. (E) Co-expression patterns of CD34, VE-cadherin, CD43, and CD45 on the three population clusters defined in (D). (F) Frequency of endothelial, HPC, and differentiated hematopoietic cells, as defined in (D) in PSC-ATOs at the indicated timepoints (n=5 independent experimental replicates).
Figure 2:
Figure 2:. T cell development from human pluripotent stem cells (PSCs) in the ATO system.
(A) Representative kinetics (n=8 independent experiments) of T cell differentiation in PSC-ATPs from H1 ESCs at the time points shown. Total live cells are shown in the DAPI- gate. Subsequent parent gates are shown above each panel. Human postnatal thymocytes are shown on the far right for comparison. (B) Left: Frequency of hematopoietic (CD45+) cells in PSC-ATOs at the indicated time points (gated on DAPI- cells). Right: frequencies of precursor and mature T cell populations at the indicated time points (gated on CD45+ cells) (mean SD, n=8 independent experiments). (C) Numbers of DP cells, CD8SP cells (defined as CD3+TCR +CD8+CD4-) and CD4SP cells (defined as CD3+TCR +CD4+CD8-) generated from 1×10⁶ hEMP at indicated time points (mean SEM; n=8). (D) Representative whole-mount immunofluorescence analysis (n=3) of PSC-ATOs at week 5. Staining for GFP (marking MS5-DLL4 cells), CD3 (red), and DAPI (nuclear stain). Scale bars, 50 m.
Figure 3:
Figure 3:. Maturation, TCR diversity and function of PSC derived T cells generated in PSC-ATOs.
(A) Representative flow cytometry analysis of T cell maturation markers on CD3+TCR + cells from H1 PSC-ATOs at week 7, demonstrating a conventional T cell phenotype (CD8 ) and generation of mature (CD45RA+CD45RO-) nave T cells. Parent gates are indicated above each panel. Human postnatal thymocytes are shown for comparison (top row). Data are representative of 8 independent experiments. (B) TCR V diversity in nave CD8SP T cells isolated from H1 PSC-ATOs (gray bars, n=2) compared to nave CD8SP from postnatal thymi (black bars, n=2) by deep sequencing of TCR V CDR3 regions. Frequency of cells expressing each V segment is shown. (C) TCR V CDR3 lengths in nave CD8SP T cells isolated from H1 PSC-ATOs (red bars, n=2), postnatal thymi (blue bars, n=2) and adult peripheral blood (gray bars, n=2) assessed by deep sequencing. (D) Expression of DNTT (TdT) by RNA sequencing in DP cells (left) and CD8SP T cells (right) isolated from H1 PSC-ATOs (n=3) compared to the same populations isolated from postnatal thymi (n=3) or ATOs initiated with human cord blood CD34+ HSPCs (CB-ATOs) (n=2). Gene expression is quantified as fragments per kilobase of transcript per million reads (FPKM). (E) Representative intracellular flow cytometry analysis of TdT expression gated on ISP4, DP and CD8SP populations from the human fetal and postnatal thymus (n=1 and n=2, respectively); H1 PSC-ATOs (n=3), and CB-ATOs (n=2). Isotype staining controls are shown in gray for each plot. (F) Polyfunctional cytokine production by H1 PSC-ATO derived CD8SP T cells after treatment with PMA/ionomycin. Data are representative of 3 independent experiments. (G) Proliferation (as measured by the dilution of CFSE) and upregulation of activation markers CD25 and 4–1BB by H1 PSC-ATO derived CD8SP T cells after 5 days of treatment with media only, IL-2, or anti-CD3/CD28 beads plus IL-2. Data are representative of three independent experiments.
Figure 4:
Figure 4:. Differentiation, antigen specific function, and V allelic exclusion of TCR-engineered T cells in PSC-ATOs.
(A) Analysis of differentiation kinetics (representative of six independent experiments) of HLA-A*0201/NY-ESO-1157–165-specific (ESO TCR) TCR-engineered T cells in PSC-ATOs initiated from TCR-transduced H1 ESCs ((TCR)PSC-ATOs). H1 ESCs were stably transduced with a lentiviral vector co-expressing the ESO TCR (detectable using an antibody specific for V?13.1) and the mTagBFP2 fluorescent protein. Total live cells are shown in the DAPI- gate. Subsequent parent gates are shown above each panel. (B) Number of total live cells (left) and V 13.1+ (ESO TCR) CD8SP T cells (right) generated in PSC-ATOs at week 7, starting with 1×10⁶ hEMPs (mean SD) (n=6 experiments). (C) Representative (n=6) flow cytometry analysis of maturation markers on ESO TCR CD8SP T cells from (TCR)PSC-ATOs, showing a conventional (CD8 +) and nave (CD45RA+CD45RO-) T cell phenotype including expression of CD27, CD28, CCR7, and CD62L. (D) Cytokine production and CD107a membrane mobilization of TCR-PSC-ATO-derived ESO TCR CD8SP T cells in response to K562 artificial antigen presenting cells (aAPC) expressing an irrelevant (MART-1) or cognate (NY-ESO-1) peptide-MHC single chain trimer. Data are representative of three independent experiments. (E) Upregulation of activation markers CD25 and 4–1BB on ESO TCR CD8SP T cells in response to MART1 or NY-ESO-1 aAPCs for 24h. (F) Proliferation (as measured by dilution of CFSE) of ESO TCR CD8 SP T cells in response to MART1 or NY-ESO-1 aAPCs for 5 days. (G) Evolution of an effector/memory T cell phenotype (CD45RA- CD45RO+) from nave (CD45RA+CD45RO-) ESO TCR CD8SP T cells after 5 days of stimulation with NY-ESO-1 aAPCs and IL-2. (H) Post-ATO expansion of ESO TCR CD8SP T cells isolated from (TCR)PSC-ATOs in response to cognate NY-ESO-1 aAPCs and IL-2. Mean and s.d. of technical triplicates are shown; data are representative of 3 independent experiments. (I) In vitro cytotoxicity of ESO TCR CD8SP T cells against target K562 cells expressing an irrelevant (MART1) or cognate (NY-ESO-1) single chain trimer. T cells were activated/expanded using NY-ESO-1 aAPCs and IL-2 prior to assay. Cell killing is shown as the percentage of target cells positive for annexin V binding at 12h, at the indicated effector to target cell ratios. Data are representative of two independent experiments. (J) In vivo slowing of tumor growth after I.V. administration of (TCR)PSC-ATP derived ESO-TCR CD8SP T cells. NSG mice were subcutaneously implanted with 2105 luciferase-transduced K562-ESO tumor cells 3 days prior to T cell infusion. 5 106 ESO TCR T cells isolated from (TCR)PSC-ATOs and expanded for 10 days, or PBS (control) were injected intravenously into each mouse. Bioluminescence was measured at the indicated timepoints. Mean and SEM for each group is shown (control n=5, ESO TCR T cells n=5). (K) Allelic exclusion of endogenous V expression shown by flow cytometry of CD8SP T cells isolated from (TCR)PSC-ATOs (n=3). Frequencies of T cells expressing the indicated V segments are shown (error bars represent s.d.).
Figure 5
Figure 5. Gene expression changes during the transition from PSC to hEMP to CD8SP T cell
(A) Hierarchical clustering for the 1981 genes classified as differentially expressed between PSC (H1 ESC), hEMP and PSC-ATO-derived CD8SP cells (pool of three pair-wise comparisons). Data for each biological replicate is shown. Individual clusters are labeled with vertical colored bars, and official symbols for representative genes are shown (full results provided in Table S1). (B) Functional enrichment network for all genes differentially expressed between PSC, hEMP and PSC-ATO-derived CD8SP cells. Individual gene ontology terms with similar gene members are grouped by categories (node color) and labeled using a representative member. Node size is proportional to statistical significance (Enrichment p-value) as shown. Edge thickness is proportional to between-node similarity and reflects the overlap between genes annotated in both ontology terms. Only edges representing a Kappa similarity score greater than 0.3 are shown. Only significant ontology terms are shown (hypergeometric p-value p<1e-03). The network is oriented to highlight the association between the genes in each ontology term and those in the clusters from (A).
Figure 6:
Figure 6:. RNA-Seq analysis of mature T cell development in PSC-ATOs
(A) Principal component analysis of gene expression for CD8SP and DP cells from three different sources (THY: normal thymus; CB-ATO: ATOs initiated with cord blood CD34+ HSPCs; and PSC-ATOs). Each symbol shape represents an individual biological replicate for the corresponding cell type; all CD8SP samples are yellow and all DP are green; the PSC-ATO group includes ATOs initated from iPSC (iPSC-ATO; black central dots), H1 ESCs (ESC-ATO; white central dots), and TCR-transduced H1 ESCs (ESC(TCR)-ATO; grey central dots). Shown is the ordination using the first two principal components (PC1 and PC2) and percent of variance explained by each principal component as computed using unfiltered, whole-transcriptome expression levels. (B) Functional enrichment results for genes differentially expressed between CD8SP and DP cells from three different sources (THY, CB-ATO, and PSC-ATO). For each pairwise comparison, shown are enrichment q-values computed independently for genes upregulated in CD8SP or DP cells for each source. Each functional category summarizes the enrichment of individual ontology terms with similar gene members (full results are provided in Table S1). (C) Comparison of gene expression fold changes between DP and CD8SP cells derived from different sources, for selected functional categories. The x axis represents the fold change (DP/CD8) for cells isolated from normal thymus. The y axis represents the fold change (DP/CD8) for ATO-derived cells differentiated from CB-ATOs (blue dots) or PSC-ATIs (red dots). For each category, boxes and official symbols highlight representative genes strongly up- or down-regulated between DP and CD8SP cells regardless of the source. Full results are provided in Table S1. (D) Hierarchical clustering for the 20 genes classified as differentially expressed (Wald adjusted p-value <1–10, fold change >2) between CD4SP and CD8SP cells from both PSC-ATOs and thymic samples. All 3 biological replicates for each cell type are shown. (E) SaVanT enrichment scores for CD8SP cells using RNA-Seq expression estimates. Enrichment was computed using T cell and CD8 T cell entries in a collection of pair-wise immunologic gene expression signatures (see Methods). Shown are results for CD8SP cells derived from different sources (THY: thymus, CB-ATO, iPS-ATO, ESC-ATO, and TCR-transduced ESC-ATOs). Entries labeled as “UP” include genes more expressed in the first cell type of the signature description. For each pair of cell types, enrichment in both “UP” and “DOWN” (genes more expressed in the second cell type) signatures are shown.

Comment in

References

    1. Calvo J, BenYoucef A, Baijer J, Rouyez MC, and Pflumio F (2012). Assessment of human multi-potent hematopoietic stem/progenitor cell potential using a single in vitro screening system. PloS one 7, e50495. - PMC - PubMed
    1. Carpenter AC, and Bosselut R (2010). Decision checkpoints in the thymus. Nature Immunology 11, 666–673. - PMC - PubMed
    1. Casero D, Sandoval S, Seet C, Scholes J, Zhu Y, Ha V, Luong A, Parekh C, and Crooks G (2015). Long non-coding RNA profiling of human lymphoid progenitor cells reveals transcriptional divergence of B cell and T cell lineages. Nat Immunol 16, 1282–1291. - PMC - PubMed
    1. Chin CJ, Cooper Aaron R, Lill Georgia R, Evseenko D, Zhu Y, He Chong B, Casero D, Pellegrini M, Kohn Donald B, and Crooks Gay M (2016). Genetic Tagging During Human Mesoderm Differentiation Reveals Tripotent Lateral Plate Mesodermal Progenitors. STEM CELLS 34, 1239–1250. - PMC - PubMed
    1. Crook JM, Peura TT, Kravets L, Bosman AG, Buzzard JJ, Horne R, Hentze H, Dunn NR, Zweigerdt R, Chua F, et al. (2007). The generation of six clinical-grade human embryonic stem cell lines. Cell stem cell 1, 490–494. - PubMed

Publication types

Substances