. 2019 Feb 12;12(2):274-289.
doi: 10.1016/j.stemcr.2018.12.015. Epub 2019 Jan 17.

Electroacupuncture Facilitates the Integration of Neural Stem Cell-Derived Neural Network with Transected Rat Spinal Cord

Affiliations

Electroacupuncture Facilitates the Integration of Neural Stem Cell-Derived Neural Network with Transected Rat Spinal Cord

Hui Jin et al. Stem Cell Reports. .

Abstract

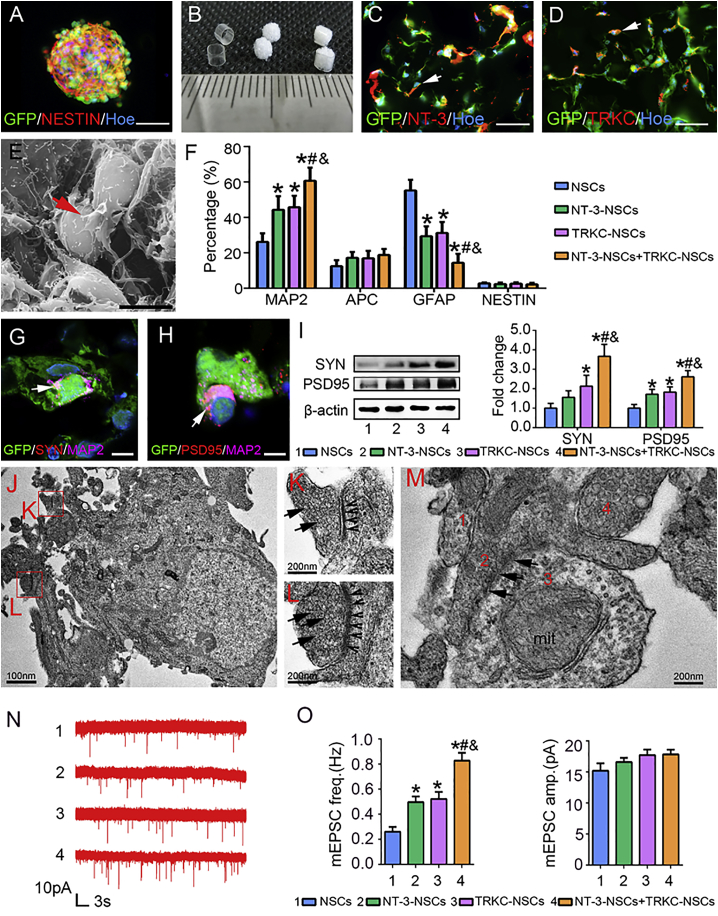
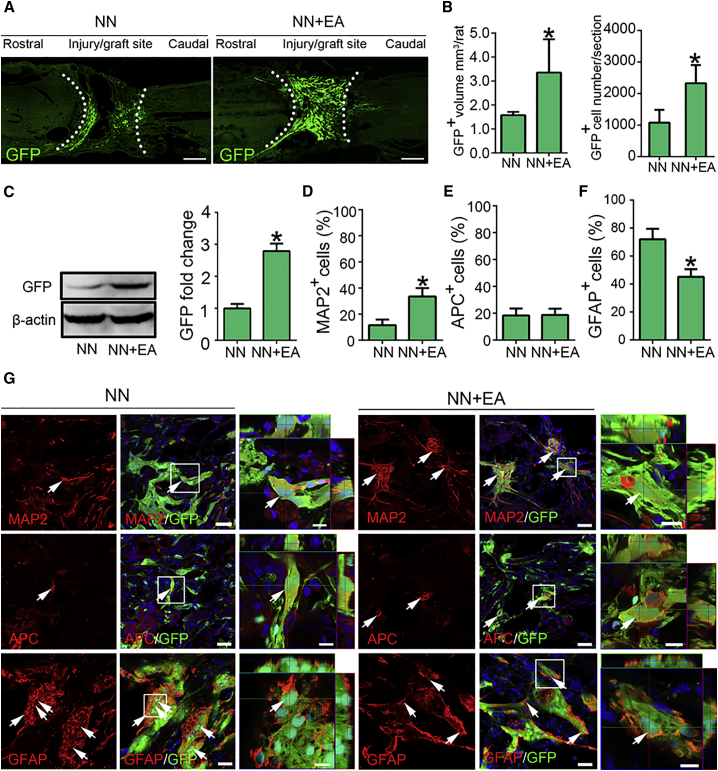
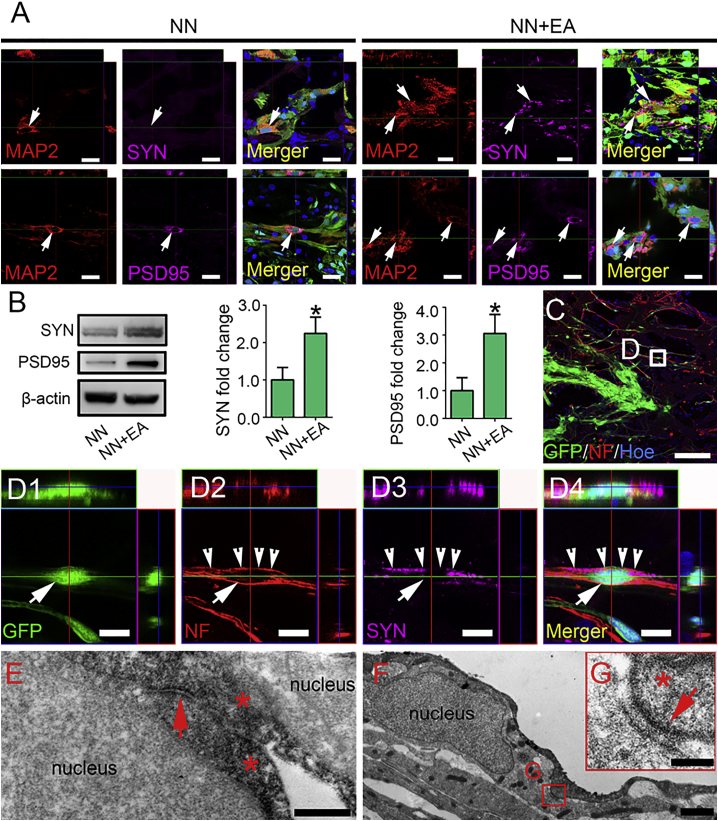
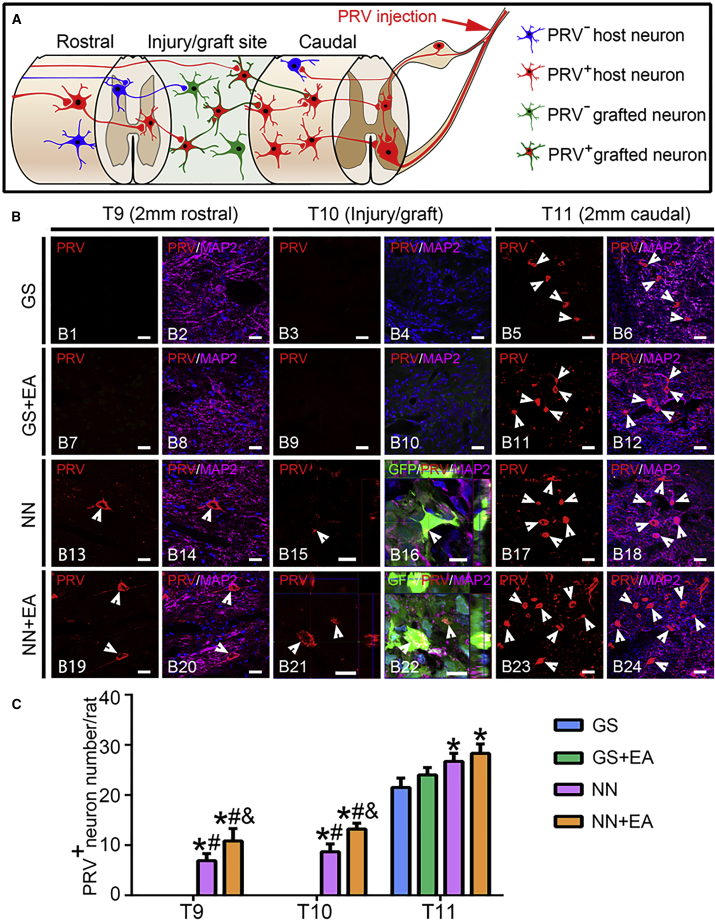
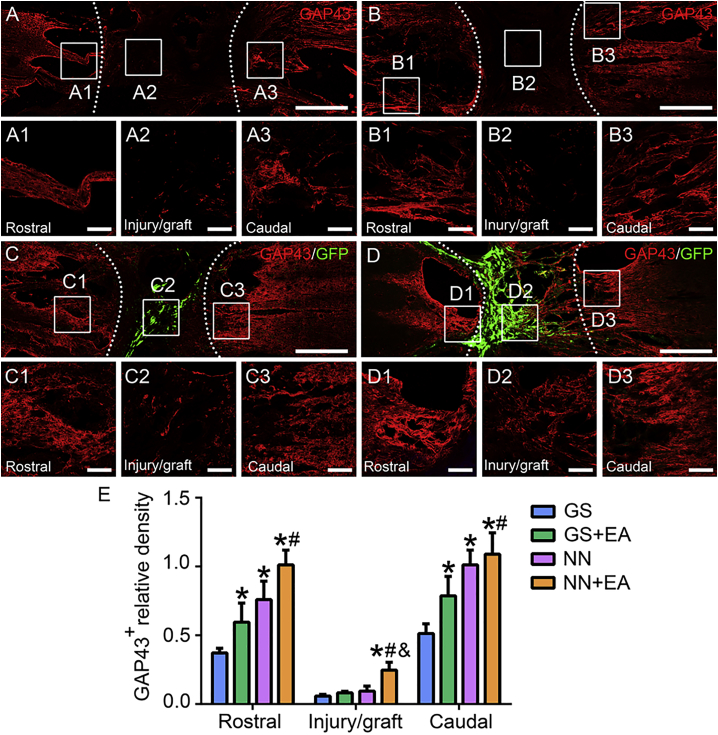
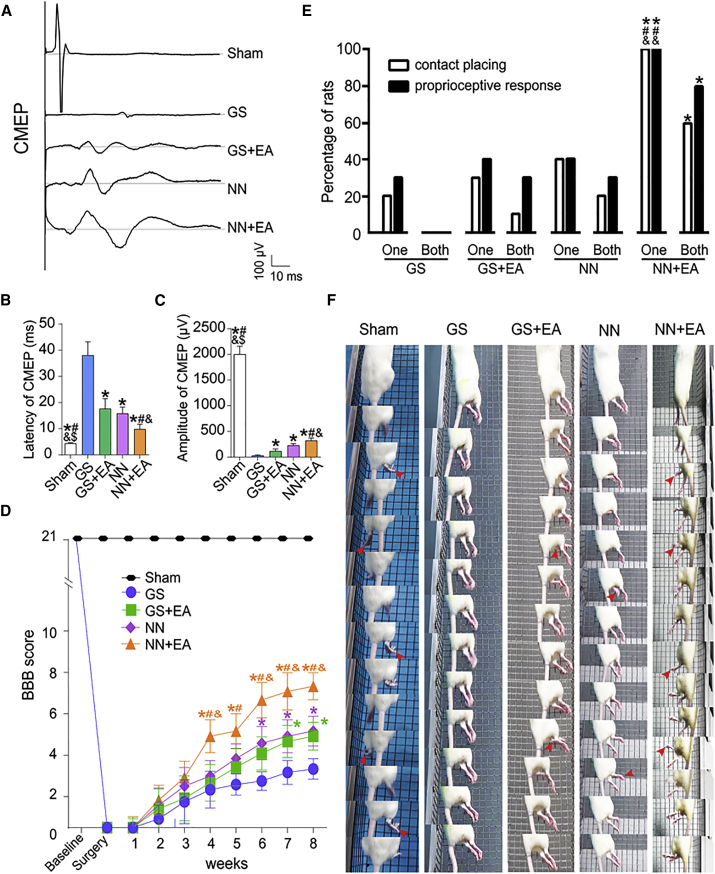
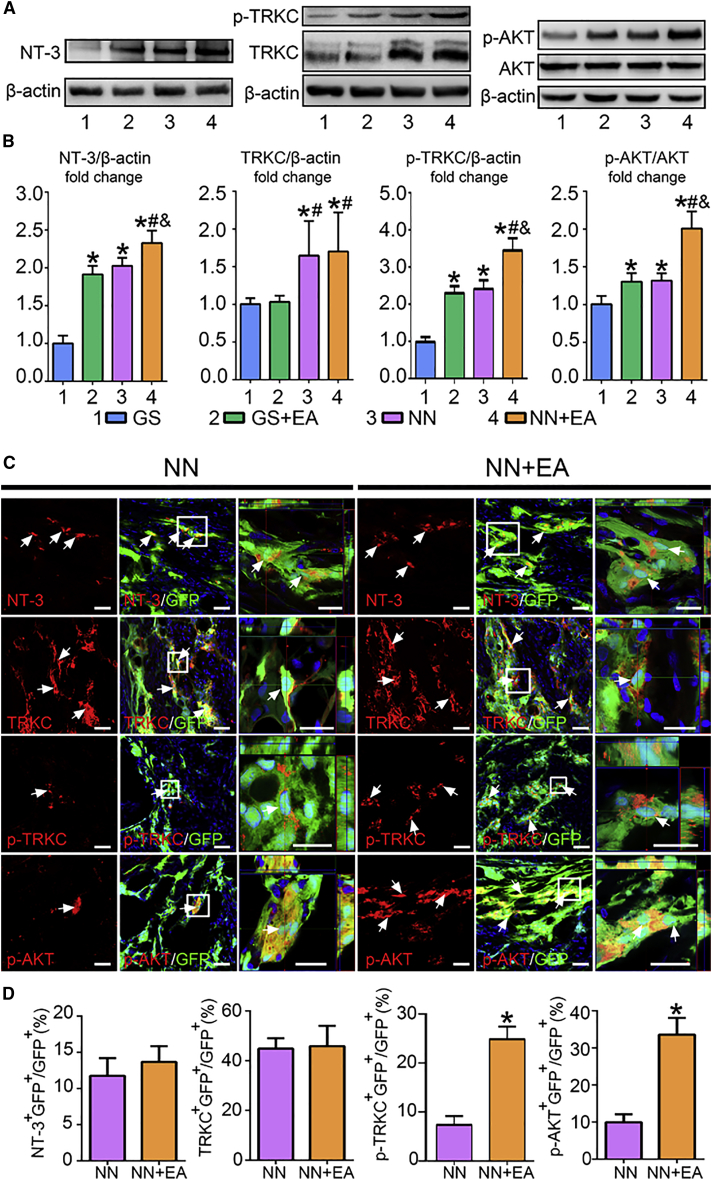
The hostile environment of an injured spinal cord makes it challenging to achieve higher viability in a grafted tissue-engineered neural network used to reconstruct the spinal cord circuit. Here, we investigate whether cell survival and synaptic transmission within an NT-3 and TRKC gene-overexpressing neural stem cell-derived neural network scaffold (NN) transplanted into transected spinal cord could be promoted by electroacupuncture (EA) through improving the microenvironment. Our results showed that EA facilitated the cell survival, neuronal differentiation, and synapse formation of a transplanted NN. Pseudorabies virus tracing demonstrated that EA strengthened synaptic integration of the transplanted NN with the host neural circuit. The combination therapy also promoted axonal regeneration, spinal conductivity, and functional recovery. The findings highlight EA as a potential and safe supplementary therapeutic strategy to reinforce the survival and synaptogenesis of a transplanted NN as a neuronal relay to bridge the two severed ends of an injured spinal cord.

Keywords: electroacupuncture; neural stem cells; neuronal relay; neurotrophin-3; spinal cord injury; tissue-engineered neural network.


Figures

Figure 1
Figure 1
Co-culture of NT-3-NSCs and TRKC-NSCs in 3D GS In Vitro to Establish an NSC-Derived Neural Network Scaffold with Functional Synaptic Structure (A) A neurosphere from GFP-transgenic rat pups comprised NESTIN+ NSCs. (B) PLGA tubes with diameter of 3 mm and length of 2 mm (left), a piece of GS (middle), and appearance of the GS scaffold (right). (C) NSCs infected with Adv-NT-3 were NT-3+ staining (arrow). (D) NSCs infected with Adv-TRKC showed TRKC+ staining (arrow). (E) Scanning electron microscopy showed that NSC-derived cells in the GS scaffold formed contacts with one another. A neurite of an NSC-derived neuron-like cell was in contact with another neuron-like cell body (red arrow). (F) Bar chart showing the percentages of MAP2+, APC+, GFAP+, and NESTIN+ cells in the NSCs, NT-3-NSCs, TRKC-NSCs, and NT-3-NSCs + TRKC-NSCs groups (n = 5/group). (G and H) MAP2+ (purple, arrows), GFP+ (green) NSC-derived neurons were labeled with (G) SYN (red) and (H) PSD95 (red) in the NT-3-NSCs + TRKC-NSCs group. (I) Western blot analysis of SYN and PSD95 (n = 5/group). (J–L) Transmission electron microscopy showing profiles of some synaptic structures between the NSC-derived neurons in the NT-3-NSCs + TRKC-NSCs group. (K and L) High magnifications of two boxed areas in (J) showing pre-synaptic components with spherical agranular vesicles (arrows), post-synaptic membrane (arrowheads), and synaptic cleft. (M) EM showed that several neurite terminals (numbered from 1 to 4) aggregate together to form axodendritic-like or axoaxonal-like synapses (arrows). (N) Representative traces of mEPSCs. (O) Bar charts showing the frequency and amplitude of mEPSCs in 4 groups (n = 10/group). One-way ANOVA with least significant difference (LSD) t; p < 0.05 indicates significant difference from the NSC group; #p < 0.05 indicates significant difference from the NT-3 NSCs; &p < 0.05 indicates significant difference from the TRKC NSC group. Scale bars: 40 μm in (A), (C), and (D); 10 μm in (E); 5 μm in (G) and (H); 100 nm in (J); 200 nm in (K–M).
Figure 2
Figure 2
EA Promotes the Survival and Differentiation of NSC-derived Neurons in Transplanted Neural Network Scaffold In Vivo (A) Representative confocal microscopy images from the NN and NN + EA groups 8 weeks after SCI. The dashed curves outline the interface of graft and host. (B) Bar chart showing the quantification of the number and volume of grafted GFP+ cells (n = 5/group; Mann-Whitney U test, p < 0.05). (C) Western blot analysis of GFP expression in the injury/graft site in the NN + EA and NN groups at 8 weeks after SCI (n = 5/group; Student's t test, p < 0.05). (D–F) Bar charts showing the percentage of GFP+ cells differentiating into (D) MAP2+ neurons, (E) APC+ oligodendrocytes, and (F) GFAP+ astrocytes at 8 weeks after graft (n = 5/group; Student's t test, p < 0.05). (G) Representative confocal microscopy images for MAP2, APC, and GFAP IF (arrows). Scale bars: 1 mm in (A); 40 μm in (G); 10 μm in the high-magnification boxed areas in (G).
Figure 3
Figure 3
Maintenance and Establishment of Synaptic Connections in the Injury/Graft Site of Spinal Cord (A) Representative images of cells triple labeled with GFP (green), MAP2 (red), and SYN (purple) or PSD95 (purple) in the epicenter of the injury/graft site. The merged images show the colocalization of GFP/MAP2/SYN or PSD95 (arrows). (B) Western blot analysis of SYN and PSD95 expression in the graft site of spinal cord at 8 weeks after SCI (n = 5/group, Student's t test, p < 0.05). (C and D) (C) NF+ host-derived axons and grafted GFP+ neurons in the injury/graft site of spinal cord were visualized by IF. (D1–D4) Magnified images of boxed area D in (C) that were triple labeled with (D1) anti-GFP (green), (D2) NF (red), (D3) SYN (purple), and (D4) their merged image. Arrow indicates a NF+GFP+ cell in contact with a NF+SYN+ host axon (arrowheads). (E) Representative IEM image of grafted GFP+ cells (, labeled by DAB) in the NN + EA group. The red arrow indicates a grafted GFP+ cell () forming a synaptic contact with another GFP+ cell (). (F) IEM image showing a host neuron and a GFP+ ( in G) grafted cell process. (G) An enlarged view of boxed area in (F) showing a synaptic-like contact (arrow). Scale bars: 20 μm in (A) and (C); 10 μm in (D1)–(D4); 400 nm in (E); 1 μm in (F); 200 nm in (G).
Figure 4
Figure 4
PRV Retrograde Tracing of Transplanted NSC-Derived Neurons in the Injury/Graft Site of Spinal Cord (A) A schematic diagram showing injection of PRV as a neuroanatomical tracer into the sciatic nerve. This resulted in transsynaptic and retrograde labeling of the grafted NN, thus demonstrating it as neuronal relays that can rebuild the synaptic integration with host neural circuits. (B) Representative images showing that the MAP2+ (purple) host or NSC-derived neurons (arrowheads) were retrogradely labeled by PRV (red) in the rostral and caudal areas to and in the injury/graft site of spinal cord in the GS (B1–B6), GS + EA (B7–B12), NN (B13–B18), and NN + EA (B19–B24) groups. (C) Bar chart showing the number of PRV-labeled neurons in the T9, T10, and T11 areas in 4 groups (n = 3/group; one-way ANOVA with LSD t, p < 0.05 indicates significant difference from GS group; #p < 0.05 indicates significant difference from GS + EA; &p < 0.05 indicates significant difference from NN group). Scale bars: 20 μm in (B1)–(B14), (B17)–(B20), (B23), and (B24); 10 μm in (B15), (B16), (B21), and (B22).
Figure 5
Figure 5
Assessment of GAP43+ Axons in the Injury/Graft Site of Spinal Cord (A–D) Representative images showing GAP43+ axons in the (A) GS, (B) GS + EA, (C) NN, and (D) NN + EA groups. The dashed curves outline the interface of graft and host. The enlarged images from the rostral and caudal areas and the injury/graft site of spinal cord are shown in (A1–A3), (B1–B3), (C1–C3), and (D1–D3). (E) Bar charts showing GAP43+ axon relative density in the rostral and caudal areas and the injury/graft site in 4 groups (n = 5/group; one-way ANOVA with LSD t, p < 0.05 indicates significant difference from the GS group; #p < 0.05 indicates significant difference from the GS + EA group; &p < 0.05 indicates significant difference from the NN group). Scale bars: 1 mm in (A–D); 100 μm in (A1)–(A3), (B1)–(B3), (C1)–(C3), and (D1)–(D3).
Figure 6
Figure 6
Outcomes of Electrophysiology, BBB Locomotion Assessment, and Grid Climb Test (A) CMEPs were obtained by electrophysiological analysis in the GS, GS + EA, NN, and NN + EA groups. (B and C) Bar charts showing the (B) latency and (C) amplitude of CMEPs (n = 5/group; one-way ANOVA with LSD t). (D) Graph of BBB score of the hindlimb locomotor function in 5 groups (n = 10/group; one-way ANOVA with LSD t). (E) Bar charts showing the percentage of rats that recovered two sensorimotor reflexes with one hindlimb or two hindlimbs in 45° inclined grid climb test (n = 10/group; Fisher's exact test). (F) Serial pictures of movement of the rats' feet (arrowheads) while crawling upward from bottom. p < 0.05 indicates significant difference from the GS group; #p < 0.05 indicates significant difference from the GS + EA group; &p < 0.05 indicates significant difference from the NN group; $p < 0.05 indicates significant difference from the NN + EA group.
Figure 7
Figure 7
Combination of NN Transplantation and EA Increased NT-3 Level and Activated TRKC/AKT Signaling Pathway (A and B) (A) Western blot analysis and (B) quantitation of NT-3, TRKC, p-TRKC, and p-AKT protein expression in the injury/graft site of spinal cord at 8 weeks after SCI (n = 5/group). p < 0.05 indicates significant difference from the GS group; #p < 0.05 indicates significant difference from the GS + EA group; &p < 0.05 indicates significant difference from the NN group by one-way ANOVA followed by LSD t. (C) Representative images showing the GFP+ cells colocalized with NT-3, TRKC, p-TRKC, and p-AKT (yellow, arrows). The boxed areas are shown with their corresponding higher magnification images. (D) Bar charts showing the percentage of GFP+ cells colocalized with NT-3, TRKC, p-TRKC, and p-AKT (n = 5/group). Student's t test, p < 0.05 indicates significant difference from the NN group by Student's t test. Scale bars, 20 μm in (C).

References

    1. Adler A.F., Lee-Kubli C., Kumamaru H., Kadoya K., Tuszynski M.H. Comprehensive monosynaptic rabies virus MAP of host connectivity with neural progenitor grafts after spinal cord injury. Stem Cell Reports. 2017;8:1525–1533. - PMC - PubMed
    1. Agbay A., Edgar J.M., Robinson M., Styan T., Wilson K., Schroll J., Ko J., Khadem Mohtaram N., Jun M.B., Willerth S.M. Biomaterial strategies for delivering stem cells as a treatment for spinal cord injury. Cells Tissues Organs. 2016;202:42–51. - PubMed
    1. Al-Ali H., Ding Y., Slepak T., Wu W. The mTOR substrate S6 kinase 1 (S6K1) is a negative regulator of axon regeneration and a potential drug target for central nervous system injury. J. Neurosci. 2017;37:7079–7095. - PMC - PubMed
    1. Bareyre F.M., Kerschensteiner M., Raineteau O., Mettenleiter T.C., Weinmann O., Schwab M.E. The injured spinal cord spontaneously forms a new intraspinal circuit in adult rats. Nat. Neurosci. 2004;7:269–277. - PubMed
    1. Basso D.M., Beattie M.S., Bresnahan J.C. A sensitive and reliable locomotor rating scale for open field testing in rats. J. Neurotrauma. 1995;12:1–21. - PubMed

Publication types