

Tumor-derived extracellular vesicles inhibit osteogenesis and exacerbate myeloma bone disease
- PMID: 30662562
- PMCID: PMC6332790
- DOI: 10.7150/thno.27550
Tumor-derived extracellular vesicles inhibit osteogenesis and exacerbate myeloma bone disease
Abstract
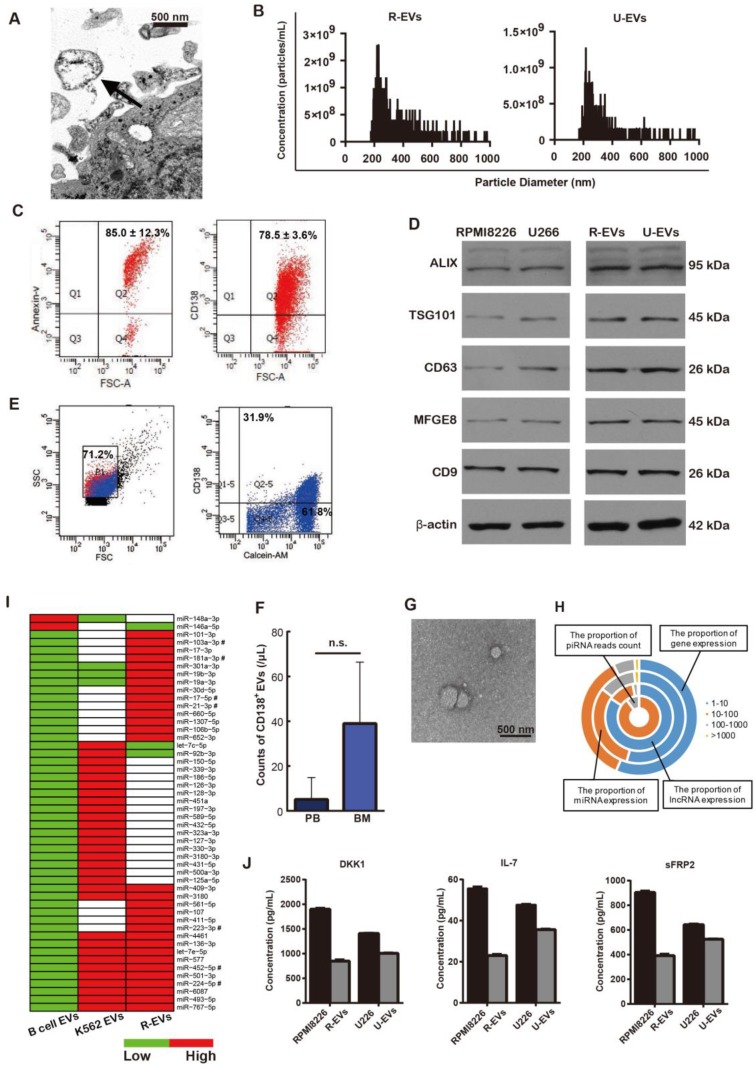
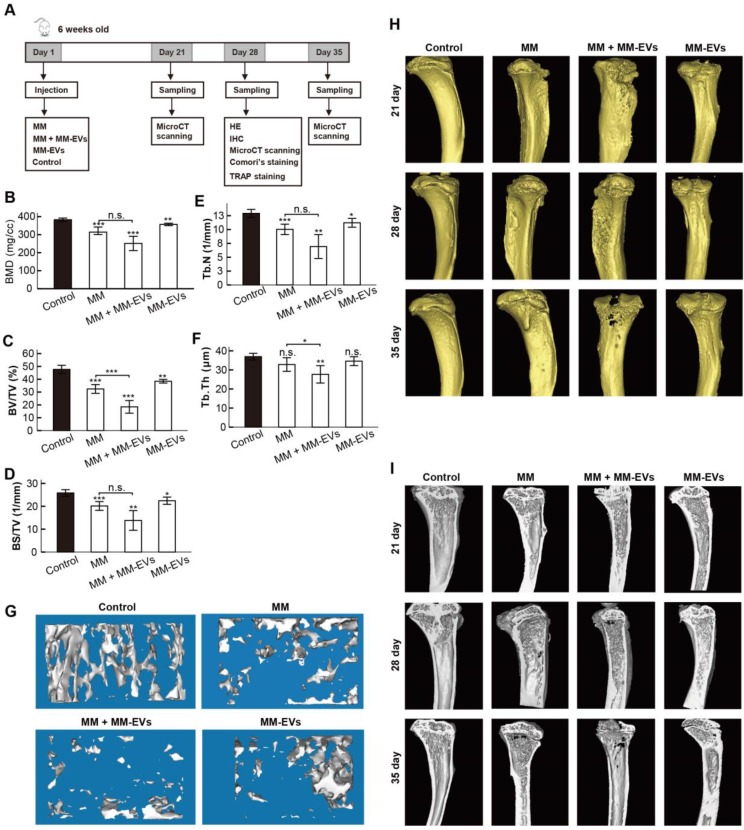
Background: As a hallmark driver of multiple myeloma (MM), MM bone disease (MBD) is unique in that it is characterized by severely impaired osteoblast activity resulting from blocked osteogenesis in bone marrow-derived mesenchymal stem cells (BM-MSCs). The mechanisms underlying this preferential blockade are incompletely understood. Methods: miRNA expression of MM cell-derived extracellular vesicles (MM-EVs) was detected by RNA sequencing. MM-EVs impaired osteogenesis and exacerbated MBD were in vitro and in vivo validated by histochemical staining, qPCR and micro-CT. We additionally examined the correlation between CD138+ circulating EVs (cirEVs) count and bone lesion in de novo MM patients. Results: Here, by sequencing and bioinformatics analysis, we found that MM-EVs were enriched in various molecules negatively regulating osteogenesis. We experimentally verified that MM-EVs inhibited BM-MSC osteogenesis, induced elevated expression of miR-103a-3p inhibiting osteogenesis in BM-MSCs, and increased cell viability and interleukin-6 secretion in MM cells. In a mouse model, MM-EVs that were injected into the marrow space of the left tibia led to impaired osteogenesis and exacerbated MBD and MM progression. Furthermore, the levels of CD138+ cirEVs in the peripheral blood were positively correlated with the number of MM bone lesions in MM patients. Conclusions: These findings suggest that MM-EVs play a pivotal role in the development of severely impaired osteoblast activity, which represents a novel biomarker for the precise diagnosis of MBD and a compelling rationale for exploring MM-EVs as a therapeutic target.
Keywords: bone lesions; extracellular vesicles; mesenchymal stem cells; multiple myeloma; osteogenesis.
Conflict of interest statement
Competing Interests: The authors have declared that no competing interest exists.
Figures


Similar articles
-
Monocyte-derived extracellular vesicles stimulate cytokine secretion and gene expression of matrix metalloproteinases by mesenchymal stem/stromal cells.FEBS J. 2018 Jun;285(12):2337-2359. doi: 10.1111/febs.14485. Epub 2018 May 18. FEBS J. 2018. PMID: 29732732
-
Human umbilical cord mesenchymal stromal cells-derived extracellular vesicles exert potent bone protective effects by CLEC11A-mediated regulation of bone metabolism.Theranostics. 2020 Jan 16;10(5):2293-2308. doi: 10.7150/thno.39238. eCollection 2020. Theranostics. 2020. PMID: 32089743 Free PMC article.
-
Extracellular vesicles released from mesenchymal stromal cells stimulate bone growth in osteogenesis imperfecta.Cytotherapy. 2018 Jan;20(1):62-73. doi: 10.1016/j.jcyt.2017.09.012. Epub 2017 Oct 26. Cytotherapy. 2018. PMID: 29107738
-
Extracellular vesicle cross-talk in the bone marrow microenvironment: implications in multiple myeloma.Oncotarget. 2016 Jun 21;7(25):38927-38945. doi: 10.18632/oncotarget.7792. Oncotarget. 2016. PMID: 26950273 Free PMC article. Review.
-
Extracellular vesicle-mediated cell-cell communication in haematological neoplasms.Philos Trans R Soc Lond B Biol Sci. 2018 Jan 5;373(1737):20160484. doi: 10.1098/rstb.2016.0484. Philos Trans R Soc Lond B Biol Sci. 2018. PMID: 29158313 Free PMC article. Review.
Cited by
-
m6A reader hnRNPA2B1 drives multiple myeloma osteolytic bone disease.Theranostics. 2022 Nov 14;12(18):7760-7774. doi: 10.7150/thno.76852. eCollection 2022. Theranostics. 2022. PMID: 36451863 Free PMC article.
-
Analysis of Amount, Size, Protein Phenotype and Molecular Content of Circulating Extracellular Vesicles Identifies New Biomarkers in Multiple Myeloma.Int J Nanomedicine. 2021 May 7;16:3141-3160. doi: 10.2147/IJN.S303391. eCollection 2021. Int J Nanomedicine. 2021. PMID: 33994784 Free PMC article.
-
Liquid Biopsy in Cancer: Focus on Lymphoproliferative Disorders.Cancers (Basel). 2022 Oct 31;14(21):5378. doi: 10.3390/cancers14215378. Cancers (Basel). 2022. PMID: 36358796 Free PMC article. Review.
-
Extracellular Vesicles Enhance Multiple Myeloma Metastatic Dissemination.Int J Mol Sci. 2019 Jul 1;20(13):3236. doi: 10.3390/ijms20133236. Int J Mol Sci. 2019. PMID: 31266187 Free PMC article. Review.
-
Inhibition of VCP modulates NF-κB signaling pathway to suppress multiple myeloma cell proliferation and osteoclast differentiation.Aging (Albany NY). 2023 Aug 21;15(16):8220-8236. doi: 10.18632/aging.204965. Epub 2023 Aug 21. Aging (Albany NY). 2023. PMID: 37606987 Free PMC article.
References
-
- Röllig C, Knop S, Bornhäuser M. Multiple myeloma. Lancet. 2015;385:2197–208. - PubMed
-
- Roodman GD. Mechanisms of bone metastasis. N Engl J Med. 2004;350:1655–64. - PubMed
-
- Roodman GD. Osteoblast function in myeloma. Bone. 2011;48:135–40. - PubMed
-
- Terpos E, Berenson J, Cook RJ, Lipton A, Coleman RE. Prognostic variables for survival and skeletal complications in patients with multiple myeloma osteolytic bone disease. Leukemia. 2010;24:1043–9. - PubMed
Publication types
MeSH terms
Substances
LinkOut - more resources
Full Text Sources
Medical
Research Materials
