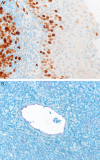
Histogram parameters derived from T2 weighted images are associated with histopathological findings in rectal cancer - a preliminary study
- PMID: 30662629
- PMCID: PMC6291705
Histogram parameters derived from T2 weighted images are associated with histopathological findings in rectal cancer - a preliminary study
Abstract
Histogram analysis can better reflect tumor heterogeneity than conventional imaging analysis. The present study analyzed possible correlations between histogram parameters derived from T2 weighted images and histopathological features in rectal cancer. Seventeen patients with histopathological proven rectal adenocarcinoma were retrospectively acquired with prebioptic 3 T MRI and available histopathological specimens. Histogram analysis was performed using an in-house matlab tool conducting a whole lesion measurement. Histopathology was investigated using Ki67 specimens with calculation of Ki67-index as well as cellularity and nucleic areas and CD31 specimens, with estimation of microvessel density. Several histogram parameters correlated with average nucleic area. Skewness showed a moderate correlation with microvessel density (P = 0.54, P = 0.02). None of the parameters correlated with Ki67-index. Skewness derived from T2 weighted images might be used as a surrogate parameter for average nucleic area and microvessel density. However, none of the parameters were associated with proliferation index.
Keywords: Ki67; MRI; Rectal cancer; histogram analysis; microvessel density.
Conflict of interest statement
None.
Figures


References
-
- Ma B, Gao P, Wang H, Xu Q, Song Y, Huang X, Sun J, Zhao J, Luo J, Sun Y, Wang Z. What has preoperative radio(chemo)therapy brought to localized rectal cancer patients in terms of perioperative and long-term outcomes over the past decades? A systematic review and meta-analysis based on 41,121 patients. Int J Cancer. 2017;141:1052–1065. - PubMed
-
- Beets-Tan RG, Lambregts DM, Maas M, Maas M, Bipat S, Barbaro B, Caseiro-Alves F, Curvo-Semedo L, Fenlon HM, Gollub MJ, Gourtsoyianni S, Halligan S, Hoeffel C, Kim SH, Laghi A, Maier A, Rafaelsen SR, Stoker J, Taylor SA, Torkzad MR, Blomqvist L. Magnetic resonance imaging for the clinical management of rectal cancer patients: recommendations from the 2012 European Society of Gastrointestinal and Abdominal Radiology (ESGAR) consensus meeting. Eur Radiol. 2013;23:2522–2531. - PubMed
-
- Heid I, Steiger K, Trajkovic-Arsic M, Settles M, Eßwein MR, Erkan M, Kleeff J, Jäger C, Friess H, Haller B, Steingötter A, Schmid RM, Schwaiger M, Rummeny EJ, Esposito I, Siveke JT, Braren RF. Co-clinical assessment of tumor cellularity in pancreatic cancer. Clin Cancer Res. 2017;23:1461–1470. - PubMed
LinkOut - more resources
Full Text Sources
