Development of a Novel Diagnostic Biomarker Set for Rheumatoid Arthritis Using a Proteomics Approach
- PMID: 30662913
- PMCID: PMC6312602
- DOI: 10.1155/2018/7490723
Development of a Novel Diagnostic Biomarker Set for Rheumatoid Arthritis Using a Proteomics Approach
Abstract
Background: Rheumatoid arthritis (RA) is an autoimmune disease that starts with inflammation of the synovial membrane. Studies have been conducted to develop methods for efficient diagnosis of RA and to identify the mechanisms underlying RA development. Blood samples can be useful for detecting disturbance of homeostasis in patients with RA. Nanoliquid chromatography-tandem mass spectrometry (LC-MS/MS) is an efficient proteomics approach to analyze blood sample and quantify serum proteins.
Methods: Serum samples of 18 healthy controls and 18 patients with RA were analyzed by LC-MS/MS. Selected candidate biomarkers were validated by enzyme-linked immunosorbent assay (ELISA) using sera from 43 healthy controls and 44 patients with RA.
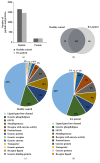
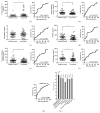
Results: Thirty-eight proteins were significantly differentially expressed by more than 2-fold in healthy controls and patients with RA. Based on a literature survey, we selected six candidate RA biomarkers. ELISA was used to evaluate whether these proteins effectively allow distinguishing patients with RA from healthy controls and monitoring drug efficacy. SAA4, gelsolin, and vitamin D-binding protein were validated as potential biomarkers of RA for screening and drug efficacy monitoring of RA.
Conclusions: We identified a panel of three biomarkers for RA which has potential for application in RA diagnosis and drug efficacy monitoring. Further, our findings will aid in understanding the pathogenesis of RA.
Figures


Similar articles
-
Proteomics Analysis for Verification of Rheumatoid Arthritis Biomarker Candidates Using Multiple Reaction Monitoring.Proteomics Clin Appl. 2019 May;13(3):e1800011. doi: 10.1002/prca.201800011. Epub 2018 Oct 9. Proteomics Clin Appl. 2019. PMID: 30230224
-
Identification and Validation of SAA4 as a Rheumatoid Arthritis Prescreening Marker by Liquid Chromatography Tandem-mass Spectrometry.Molecules. 2017 May 14;22(5):805. doi: 10.3390/molecules22050805. Molecules. 2017. PMID: 28505104 Free PMC article.
-
Identification of novel autoantigen in the synovial fluid of rheumatoid arthritis patients using an immunoproteomics approach.PLoS One. 2013;8(2):e56246. doi: 10.1371/journal.pone.0056246. Epub 2013 Feb 13. PLoS One. 2013. PMID: 23418544 Free PMC article.
-
Defining the proteomic landscape of rheumatoid arthritis: progress and prospective clinical applications.Expert Rev Proteomics. 2017 May;14(5):431-444. doi: 10.1080/14789450.2017.1321481. Epub 2017 May 2. Expert Rev Proteomics. 2017. PMID: 28425787 Review.
-
[Plasma analysis of rheumatoid arthritis by SELDI].Nihon Rinsho Meneki Gakkai Kaishi. 2007 Jun;30(3):145-50. doi: 10.2177/jsci.30.145. Nihon Rinsho Meneki Gakkai Kaishi. 2007. PMID: 17603254 Review. Japanese.
Cited by
-
LC-MS/MS-Based Serum Protein Profiling for Identification of Candidate Biomarkers in Pakistani Rheumatoid Arthritis Patients.Life (Basel). 2022 Mar 21;12(3):464. doi: 10.3390/life12030464. Life (Basel). 2022. PMID: 35330214 Free PMC article.
-
Plasma proteome analysis of rheumatic patients reveals differences in fingerprints based on cardiovascular history: a pilot study.Proteome Sci. 2025 Apr 11;23(1):4. doi: 10.1186/s12953-025-00243-6. Proteome Sci. 2025. PMID: 40217270 Free PMC article.
-
Anti-Rheumatic potential of biological DMARDS and protagonistic role of bio-markers in early detection and management of rheumatoid arthritis.Innate Immun. 2025 Jan-Dec;31:17534259251324820. doi: 10.1177/17534259251324820. Epub 2025 Mar 16. Innate Immun. 2025. PMID: 40091354 Free PMC article. Review.
-
Association of the serological status of rheumatoid arthritis patients with two circulating protein biomarkers: A useful tool for precision medicine strategies.Front Med (Lausanne). 2022 Oct 28;9:963540. doi: 10.3389/fmed.2022.963540. eCollection 2022. Front Med (Lausanne). 2022. PMID: 36388911 Free PMC article.
-
Exploring candidate biomarkers for rheumatoid arthritis through cardiovascular and cardiometabolic serum proteome profiling.Front Immunol. 2024 Feb 14;15:1333995. doi: 10.3389/fimmu.2024.1333995. eCollection 2024. Front Immunol. 2024. PMID: 38420123 Free PMC article.
References
-
- Kroot J. A. E.-J., De Jong B. A. W., Van Leeuwen M. A., et al. The prognostic value of anti-cyclic citrullinated peptide antibody in patients with recent-onset rheumatoid arthritis. Arthritis & Rheumatology. 2000;43(8):1831–1835. doi: 10.1002/1529-0131(200008)43:8<1831::AID-ANR19>3.0.CO;2-6. - DOI - PubMed
-
- Venables P., Maini R. Diagnosis and differential diagnosis of rheumatoid arthritis, UpToDate2012. 2006.
MeSH terms
Substances
LinkOut - more resources
Full Text Sources
Other Literature Sources
Medical
Research Materials
Miscellaneous

