. 2019 Jan 9;5(1):eaav0486.
doi: 10.1126/sciadv.aav0486. eCollection 2019 Jan.

Global patterns and drivers of ecosystem functioning in rivers and riparian zones

Scott D TiegsDavid M CostelloMark W IskenGuy WoodwardPeter B McIntyreMark O GessnerEric ChauvetNatalie A GriffithsAlex S FleckerVicenç AcuñaRicardo AlbariñoDaniel C AllenCecilia AlonsoPatricio AndinoClay ArangoJukka AroviitaMarcus V M BarbosaLeon A BarmutaColden V BaxterThomas D C BellBrent BellingerLuz BoyeroLee E BrownAndreas BruderDenise A BruesewitzFrancis J BurdonMarcos CallistoCristina CanhotoKrista A CappsMaría M CastilloJoanne ClapcottFanny ColasCheco Colón-GaudJulien CornutVerónica Crespo-PérezWyatt F CrossJoseph M CulpMichael DangerOlivier DanglesElvira de EytoAlison M DerryVeronica Díaz VillanuevaMichael M DouglasArturo ElosegiAndrea C EncaladaSally EntrekinRodrigo EspinosaDiana EthaiyaVerónica FerreiraCarmen FerriolKyla M FlanaganTadeusz FleituchJennifer J Follstad ShahAndré Frainer BarbosaNikolai FribergPaul C FrostErica A GarciaLiliana García LagoPavel Ernesto García SotoSudeep GhateDarren P GilingAlan GilmerJosé Francisco Gonçalves JrRosario Karina GonzalesManuel A S GraçaMike GraceHans-Peter GrossartFrançois GuéroldVlad GulisLuiz U HeppScott HigginsTakuo HishiJoseph HuddartJohn HudsonSamantha ImbergerCarlos Iñiguez-ArmijosTomoya IwataDavid J JanetskiEleanor JenningsAndrea E KirkwoodAaron A KoningSarian KostenKevin A KuehnHjalmar LaudonPeter R LeavittAurea L Lemes da SilvaShawn J LerouxCarri J LeRoyPeter J LisiRichard MacKenzieAmy M MarcarelliFrank O MaseseBrendan G McKieAdriana Oliveira MedeirosKristian MeissnerMarko MilišaShailendra MishraYo MiyakeAshley MoerkeShorok MombrikotbRob MooneyTim MoultonTimo MuotkaJunjiro N NegishiVinicius Neres-LimaMika L NieminenJorge NimptschJakub OndruchRiku PaavolaIsabel PardoChristopher J PatrickEdwin T H M PeetersJesus PozoCatherine PringleAaron PrussianEstefania QuentaAntonio QuesadaBrian ReidJohn S RichardsonAnna RigosiJosé RincónGeta RîşnoveanuChristopher T RobinsonLorena Rodríguez-GallegoTodd V RoyerJames A RusakAnna C SantamansGéza B SelmeczyGelas SimiyuAgnija SkujaJerzy SmyklaKandikere R SridharRyan SponsellerAaron StolerChristopher M SwanDavid SzlagFranco Teixeira-de MelloJonathan D TonkinSari UusheimoAllison M VeachSirje VilbasteLena B M VoughtChiao-Ping WangJackson R WebsterPaul B WilsonStefan WoelflMarguerite A XenopoulosAdam G YatesChihiro YoshimuraCatherine M YuleYixin X ZhangJacob A Zwart

Global patterns and drivers of ecosystem functioning in rivers and riparian zones

Scott D Tiegs et al. Sci Adv. .

Abstract

River ecosystems receive and process vast quantities of terrestrial organic carbon, the fate of which depends strongly on microbial activity. Variation in and controls of processing rates, however, are poorly characterized at the global scale. In response, we used a peer-sourced research network and a highly standardized carbon processing assay to conduct a global-scale field experiment in greater than 1000 river and riparian sites. We found that Earth's biomes have distinct carbon processing signatures. Slow processing is evident across latitudes, whereas rapid rates are restricted to lower latitudes. Both the mean rate and variability decline with latitude, suggesting temperature constraints toward the poles and greater roles for other environmental drivers (e.g., nutrient loading) toward the equator. These results and data set the stage for unprecedented "next-generation biomonitoring" by establishing baselines to help quantify environmental impacts to the functioning of ecosystems at a global scale.


Figures

Fig. 1
Fig. 1. Global distribution of field sites, mean decomposition rates across biomes, and photos of select field sites.
More than 500 river-riparian pairs (n = 514 river, n = 533 riparian) were located in approximately 40 countries, on each continent, and spanned more than 140° of latitude. Colors correspond to Earth’s major terrestrial biomes (A). The estimated mean decomposition rates (±95% credible intervals) of cotton strips (kD) varied across biomes in riparian zones (B) and their adjacent rivers (C). Photographs are shown for rivers and zones in temperate broadleaf forests (1), tundra (2), tropical wet forests (3), boreal forests (4), montane grassland (5), and Mediterranean ecosystems (6). Photo credits: Stream 1. Olivier Dangles, Centre d’Ecologie Fonctionnelle et Evolutive, IRD, CNRS. Stream 2. Jerzy Smykla, Institute of Nature Conservation, Polish Academy of Sciences. Stream 3. Luis Hepp, Department of Biological Sciences, Regional Integrated University of Upper Uruguay and Missions. Stream 4. Jukka Aroviita, Finnish Environment Institute (SYKE). Stream 5. Scott Tiegs, Department of Biological Sciences, Oakland University. Stream 6. Manuel Graça, MARE—Marine and Environmental Sciences Centre, University of Coimbra.
Fig. 2
Fig. 2. Relationships between absolute latitude and decomposition rates in riparian zones and rivers.
Quantile regression in riparian zones (A) and rivers (B) showing decomposition rates per day (kD) versus latitude and the 95th quantile (dashed line). Inset panels (A) and (B) show the increasing slope of regression lines with each 5-centile. In each habitat, slow decomposition can be observed regardless of latitude; latitude, however, imposes a strong upper constraint on decay rates. When the effect of temperature is removed by expressing decomposition on a per–degree-day basis (kDD) (C and D), there is no significant relationship between decomposition and latitude in riparian zones (C), and a negative relationship is observed with latitude in rivers (D). Colors match the biomes shown in Fig. 1.
Fig. 3
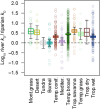
Fig. 3. The log response ratio of river decomposition (kD) to riparian decomposition (kD).
Bayesian estimates of median ratios are shown as horizontal lines, with 50 and 95% credible intervals of the median as the box and whiskers, respectively. Open symbols show individual riparian-river pairs color-coded by biome (n = 514). Values greater than zero (dashed line) indicate significantly more rapid decomposition in rivers relative to their riparian zones.
Fig. 4
Fig. 4. Temperature sensitivity of cellulose decomposition in riparian zones and rivers.
Arrhenius plots illustrating differences in the apparent activation energies of decomposition in riparian zones (A), 0.40 eV and rivers (B), 0.68 eV. (C) Posterior distribution of the slope estimates (i.e., apparent activation energy estimates), indicating that neither of the slopes overlap with zero (i.e., they are statistically significant) and that there is very little overlap between the slope estimates for decomposition in rivers and riparian zones.

References

    1. Galy V., Peucker-Ehrenbrink B., Eglinton T., Global carbon export from the terrestrial biosphere controlled by erosion. Nature 521, 204–207 (2015). - PubMed
    1. Meybeck M., Global analysis of river systems: From earth system controls to anthropocene syndromes. Philos. Trans. R. Soc. Lond. B Biol. Sci. 358, 1935–1955 (2003). - PMC - PubMed
    1. Tranvik L. J., Downing J. A., Cotner J. B., Loiselle S. A., Striegl R. G., Ballatore T. J., Dillon P., Finlay K., Fortino K., Knoll L. B., Kortelainen P. L., Kutser T., Larsen S., Laurion I., Leech D. M., Leigh McCallister S., McKnight D. M., Melack J. M., Overholt E., Porter J. A., Prairie Y., Renwick W. H., Roland F., Sherman B. S., Schindler D. W., Sobek S., Tremblay A., Vanni M. J., Verschoor A. M., von Wachenfeldt Eddie, Weyhenmeyer G. A., Lakes and reservoirs as regulators of carbon cycling and climate. Limnol. Oceanogr. 54, 2298–2314 (2009).
    1. Woodward G., Gessner M. O., Giller P. S., Gulis V., Hladyz S., Lecerf A., Malmqvist B., McKie B. G., Tiegs S. D., Cariss H., Dobson M., Elosegi A., Ferreira V., Graça M. A. S., Fleituch T., Lacoursière J. O., Nistorescu M., Pozo J., Risnoveanu G., Schindler M., Vadineanu A., Vought L. B.-M., Chauvet E., Continental-scale effects of nutrient pollution on stream-ecosystem functioning. Science 336, 1438–1440 (2012). - PubMed
    1. Follstad Shah J. J., Kominoski J. S., Ardón M., Dodds W. K., Gessner M. O., Griffiths N. A., Hawkins C. P., Johnson S. L., Lecerf A., LeRoy Carri J., Manning D. W. P., Rosemond A. D., Sinsabaugh R. L., Swan C. M., Webster J. R., Zeglin L. H., Global synthesis of the temperature sensitivity of leaf litter breakdown in streams and rivers. Glob. Chang. Biol. 23, 3064–3075 (2017). - PubMed

Publication types