. 2018 Sep;1(1):91-105.
doi: 10.3390/neuroglia1010008. Epub 2018 Jun 12.

Sequential Contribution of Parenchymal and Neural Stem Cell-Derived Oligodendrocyte Precursor Cells toward Remyelination

Affiliations

Sequential Contribution of Parenchymal and Neural Stem Cell-Derived Oligodendrocyte Precursor Cells toward Remyelination

David R Serwanski et al. Neuroglia. 2018 Sep.

Abstract

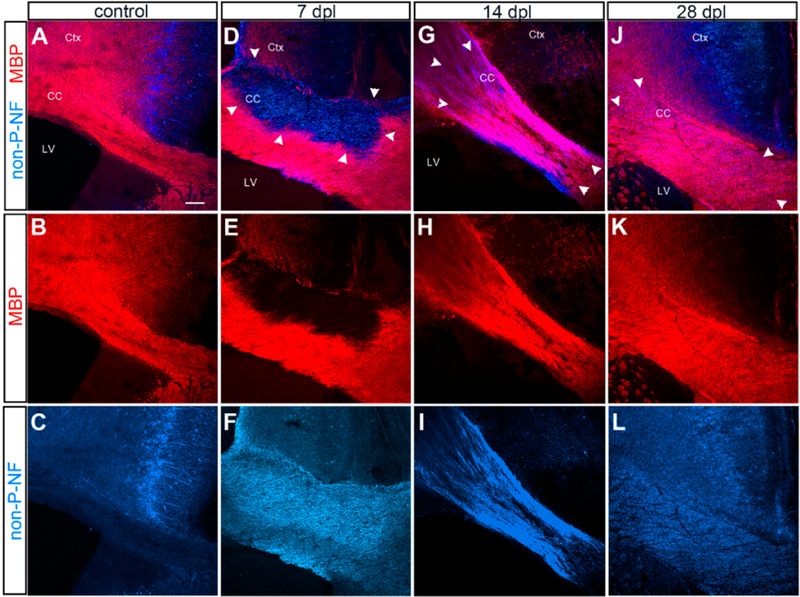
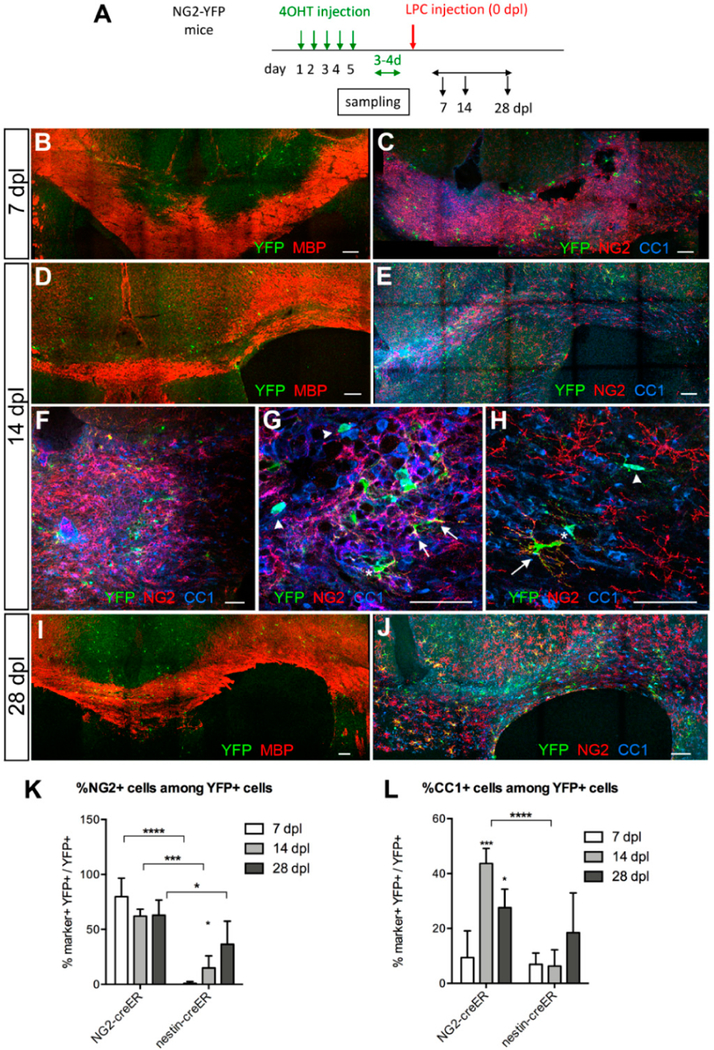
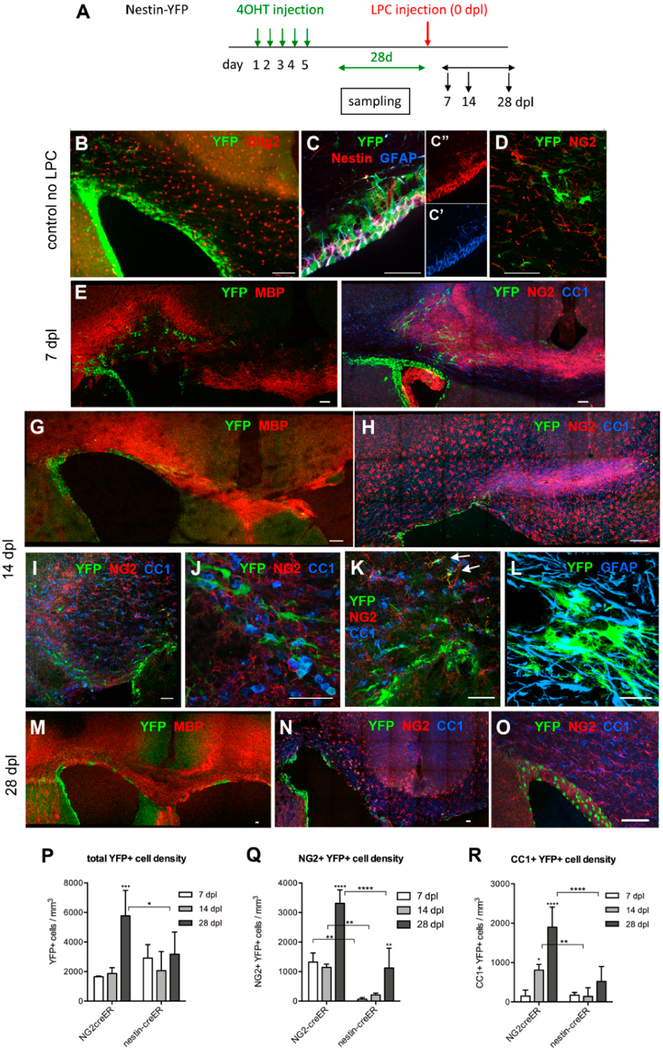
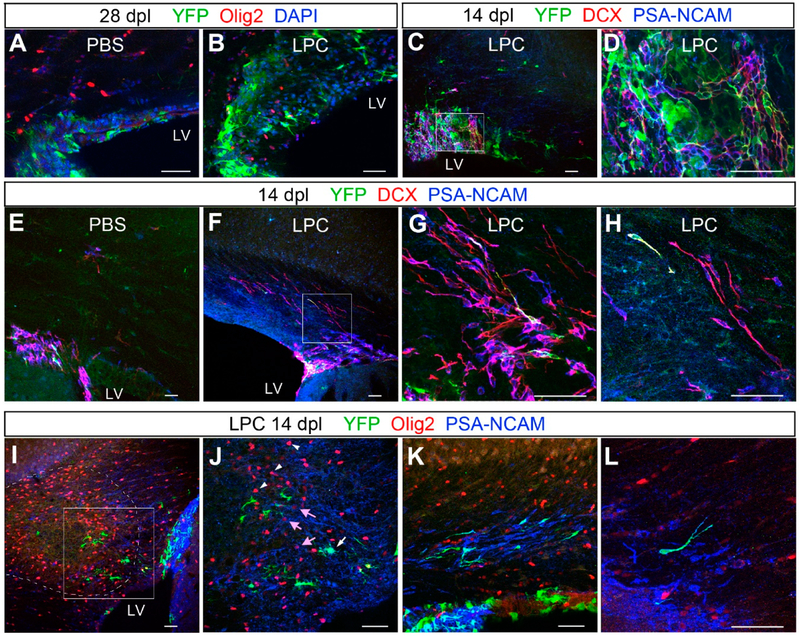
In the adult mammalian forebrain, oligodendrocyte precursor cells (OPCs), also known as NG2 glia are distributed ubiquitously throughout the gray and white matter. They remain proliferative and continuously generate myelinating oligodendrocytes throughout life. In response to a demyelinating insult, OPCs proliferate rapidly and differentiate into oligodendrocytes which contribute to myelin repair. In addition to OPCs, neural stem cells (NSCs) in the subventricular zone (SVZ) also contribute to remyelinating oligodendrocytes, particularly in demyelinated lesions in the vicinity of the SVZ, such as the corpus callosum. To determine the relative contribution of local OPCs and NSC-derived cells toward myelin repair, we performed genetic fate mapping of OPCs and NSCs and compared their ability to generate oligodendrocytes after acute demyelination in the corpus callosum created by local injection of α-lysophosphatidylcholine (LPC). We have found that local OPCs responded rapidly to acute demyelination, expanded in the lesion within seven days, and produced oligodendrocytes by two weeks after lesioning. By contrast, NSC-derived NG2 cells did not significantly increase in the lesion until four weeks after demyelination and generated fewer oligodendrocytes than parenchymal OPCs. These observations suggest that local OPCs could function as the primary responders to repair acutely demyelinated lesion, and that NSCs in the SVZ contribute to repopulating OPCs following their depletion due to oligodendrocyte differentiation.

Keywords: NG2; demyelination; myelin; neural stem cell; oligodendrocyte precursor; subventricular zone.


Conflict of interest statement

Conflicts of Interest: The authors declare no conflicts of interest.

Figures

Figure 1.
Figure 1.
Evolution of α-lysophosphatidylcholine (LPC)-induced demyelinated lesion. Immunofluorescence labeling for myelin basic protein (MBP) and non-phosphorylated neurofilaments. (AC) Control unlesioned brain. Intact MBP+ myelin in the corpus callosum. Non-phosphorylated neurofilaments are restricted to the neurons in the cingulate cortex. Ctx: cortex, CC: corpus callosum, LV: lateral ventricle. (DF) Demyelinated corpus callosum at 7 days post lesioning (dpl) showing a well-defined lesion lacking MBP and upregulated non-phosphorylated neurofilaments. Boundary of the lesion is indicated by arrowheads. (GI) Demyelinated corpus callosum at 14 dpl showing partial remyelination, characterized by uneven MBP labeling and persistent presence non-phosphorylated neurofilaments. (JL) Remyelinated corpus callosum at 28 dpl showing uniform MBP labeling and reduced levels of non-phosphorylated neurofilaments, though they are higher than unlesioned corpus callosum. Scale bar: 100 μm.
Figure 2.
Figure 2.
Response of local oligodendrocyte precursor cells (OPCs) to LPC-induced demyelination in the corpus callosum. (A) Scheme showing the experimental outline. (B,C) Lesion at 7 dpl. Low magnification images of immunolabeling for MBP and yellow fluorescent protein (YFP) showing an area of demyelination (B) and immunolabeling for YFP, NG2, and CC1 showing scattered YFP+NG2+ cells in the lesion (C). (DH) Lesion at 14 dpl. Low magnification images of immunolabeling for MBP and YFP showing partially remyelinated lesion (D), characterized by uneven MBP staining, and immunolabeling for YFP, NG2, and CC1 showing increased number of YFP+ cells in the lesion (E,F). Higher magnification shows a significant proportion of YFP+ cells express CC1 (arrowheads), while other YFP+ cells are NG2+ (arrows). Some YFP+ cells express both NG2 and CC1 (asterisks) at varying ratios. (G) is a higher magnification of the lesion. (H) is from a site further away from the lesion. (I,J) Lesion at 28 dpl. Immunolabeling for MBP and YFP shows largely repaired lesion (I) and a cluster of YFP+CC1+ cells in the center of the repaired lesion while YFP+ NG2+ cells are seen at the periphery (J). Scale bars: 100 μm for (BF) and (I,J); 50 μm for (FH). (K,L) The proportion of YFP+ cells that were NG2+ (K) or CC1+ (L) in Tg(Cspg4-creERTM;gt(ROSA)26Sortm1(EYFP) (NG2-YFP) and Tg(Nes-creERT2);gt(ROSA)26Sortm1(EYFP) (nestin-YFP) mice. * p < 0.05, *** p < 0.001, **** p < 0.0001. n = 3, two-way ANOVA, uncorrected Fisher’s least significant difference (LSD) test.
Figure 3.
Figure 3.
Response of subventricular zone (SVZ) cells to LPC-induced demyelination in the corpus callosum. (A) Scheme showing the experimental outline. (BD) The distribution and phenotype of YFP+ cells prior to LPC injection. The majority of the YFP+ cells are found in the SVZ (B) and very few of the YFP+ cells expressed Olig2. The majority of the YFP+ cells expressed nestin and GFAP (C) but not NG2 (D). (E,F) Lesion at 7 dpl. Low magnification images of MBP and YFP immunolabeling showing an area of demyelination with YFP+ cells mostly above the lateral ventricle (E) and immunolabeling for YFP, NG2, and CC1 showing that most of the YFP+ cells are neither NG2+ nor CC1+. There is strongly upregulated NG2 immunoreactivity throughout the lesion. Note that YFP+ cells line the SVZ. Some YFP+ cells appear to be migrating toward the needle track (arrows). (GL) Lesion at 14 dpl. Low magnification of immunolabeling for MBP and YFP showing partially remyelinated lesion (G) and immunolabeling for YFP, NG2, and CC1 showing a slightly increased number of YFP+ cells in the lesion (H). Higher magnification shows that most of the YFP+ cells were confined to the lesion border (I). Higher magnification of I shows that most of the YFP+ cells did not express NG2 or CC1. (J) A region from the periphery of the lesion above the lateral angle of SVZ showing two YFP+ NG2+ cells (arrowheads). Some of the large, YFP+ cells were glial fibrillary acidic protein (GFAP)+ (L). (MO) Lesion at 28 dpl. YFP and MBP labeling show remyelinated lesion with increased YFP+ cells in the lesion (M) and that the majority of the YFP+ cells were NG2+ (N). (O) Control mouse injected with PBS and stained for YFP, NG2, and CC1 at 28 dpl, showing that the majority of the YFP+ cells are confined to the SVZ and few YFP+ cells were detectable in the corpus callosum. Scale bar: 50 μm. (PR) The density of YFP+ cells (P), YFP+ NG2+ cells (Q), and YFP+ CC1+ cells at 7, 14, and 28 dpl in NG2-YFP and nestin-YFP mice. * p < 0.05, ** p < 0.01, *** p < 0.001, **** p < 0.0001. n = 3–4, two-way ANOVA, uncorrected Fisher’s LSD.
Figure 4.
Figure 4.
Changes in subventricular zone (SVZ) cells after LPC-induced demyelination. (A,B) Immunolabeling for YFP, Olig2, and DAPI showing increased thickness of the dorsal SVZ 28 days after LPC injection (B) compared with PBS-injected control (A). Very few Olig2+ cells are found in the control SVZ after PBS injection, whereas several Olig2+ cells are detected in the thickened SVZ after LPC injection. (C,D) Immunolabeling for doublecortin (Dcx) and PSA-NCAM showing that many of the YFP+ cells co-express Dcx and PSA-NCAM. (D) represents a higher magnification of the boxed area in C. (EH) Immunolabeling for YFP, Dcx, and (PSA-NCAM) showing that most of the Dcx/PSA-NCAM+ cells are confined to the SVZ in control (E), whereas LPC-injected animals show a greater number of Dcx+ PSA-NCAM+ cells migrating dorsally into the SVZ (FH). (H) is a higher magnification image of the boxed area in (F). (I,J) Immunolabeling for YFP, Olig2, and PSA-NCAM near the lesion (dotted line) at 14 dpl. There is a dense cluster of PSA-NCAM+ cells in the lateral angle of the SVZ (right side in I). Higher magnification of the boxed area in (I), showing a YFP+ cell that is also PSA-NCAM+ (J, white arrow). There is a cluster of strongly Olig2+ cells inside the lesion (arrowheads in (J)), and weakly Olig2+ PSA-NCAM+ cells are detected at the lesion border (pink arrows in (J)). (K,L) PSA-NCAM+ cells, some of which are YFP+, appear to be migrating in the corpus callosum in clusters (K), and many of them have a tadpole-shaped unipolar morphology (L). Scale bar: 50 μm.

References

    1. Nishiyama A; Komitova M; Suzuki R; Zhu X Polydendrocytes (NG2 cells): Multifunctional cells with lineage plasticity. Nat. Rev. Neurosci 2009, 10, 9–22. - PubMed
    1. Nishiyama A; Boshans L; Goncalves CM; Wegrzyn J; Patel KD Lineage, fate, and fate potential of NG2-glia. Brain Res 2016, 1638 (Pt B), 116–128. - PMC - PubMed
    1. Keirstead HS; Levine JM; Blakemore WF Response of the oligodendrocyte progenitor cell population (defined by NG2 labelling) to demyelination of the adult spinal cord. Glia 1998, 22, 161–170. - PubMed
    1. Di Bello CI; Dawson MR; Levine JM; Reynolds R Generation of oligodendroglial progenitors in acute inflammatory demyelinating lesions of the rat brain stem is associated with demyelination rather than inflammation. J. Neurocytol 1999, 28, 365–381. - PubMed
    1. Watanabe M; Toyama Y; Nishiyama A Differentiation of proliferated NG2-positive glial progenitor cells in a remyelinating lesion. J. Neurosci. Res 2002, 69, 826–836. - PubMed

LinkOut - more resources