Review
. 2019 Aug;50(2):347-364.
doi: 10.1002/jmri.26645. Epub 2019 Jan 20.

APT-weighted MRI: Techniques, current neuro applications, and challenging issues

Affiliations
Review

APT-weighted MRI: Techniques, current neuro applications, and challenging issues

Jinyuan Zhou et al. J Magn Reson Imaging. 2019 Aug.

Abstract

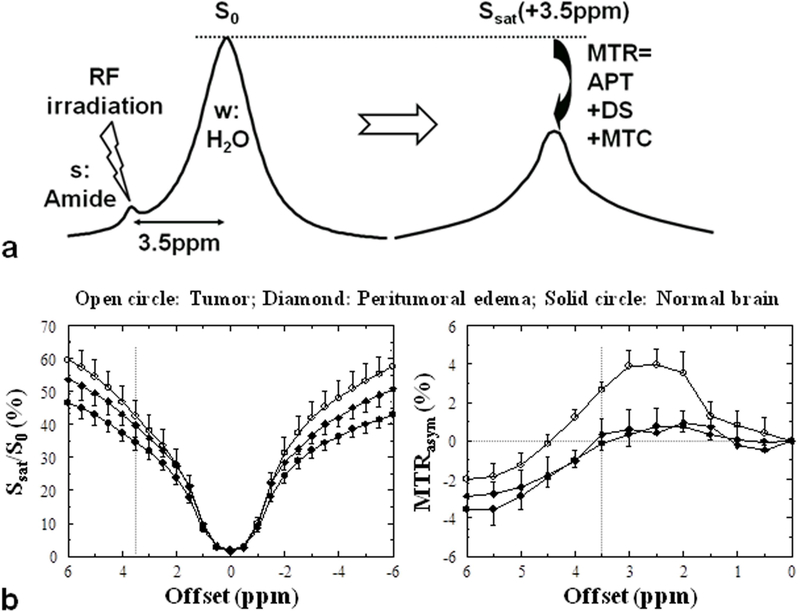
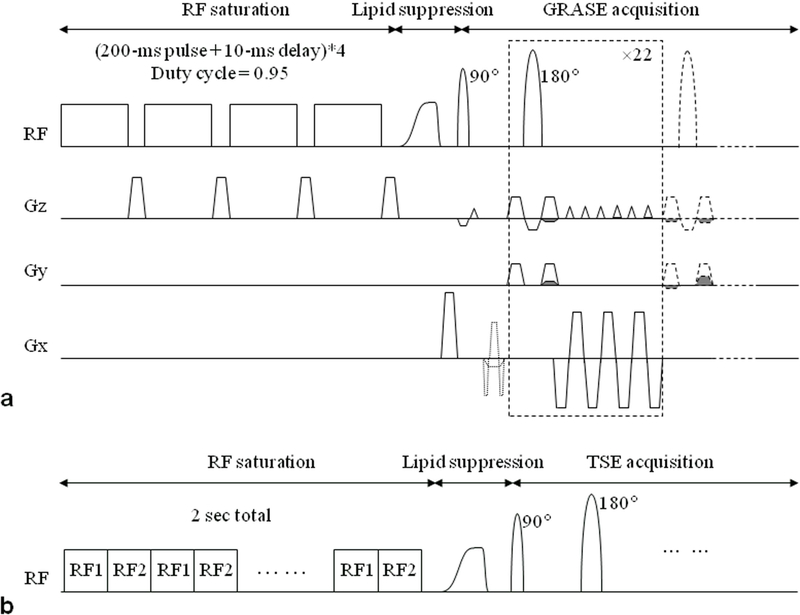
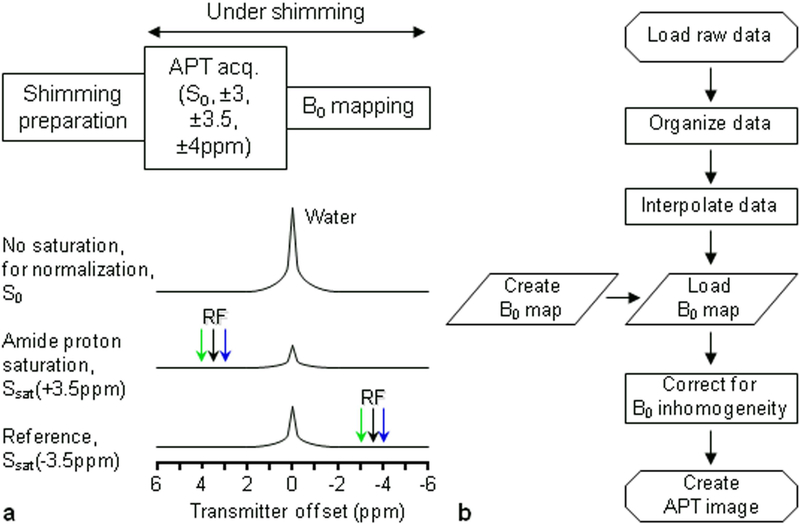
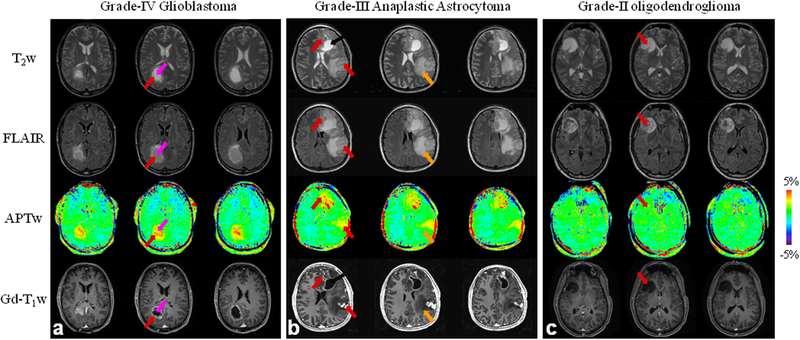
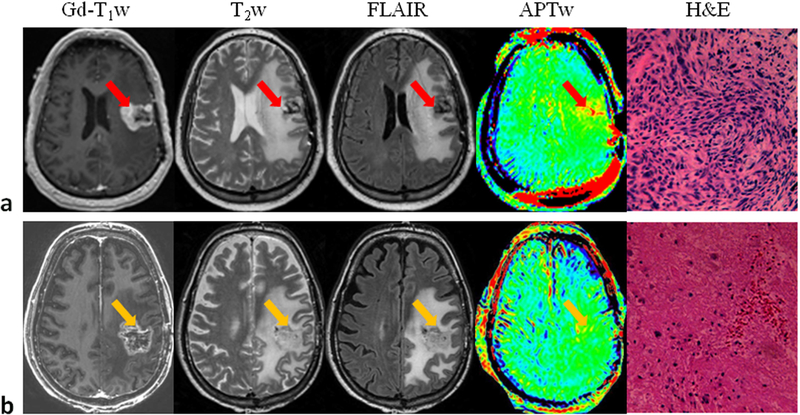
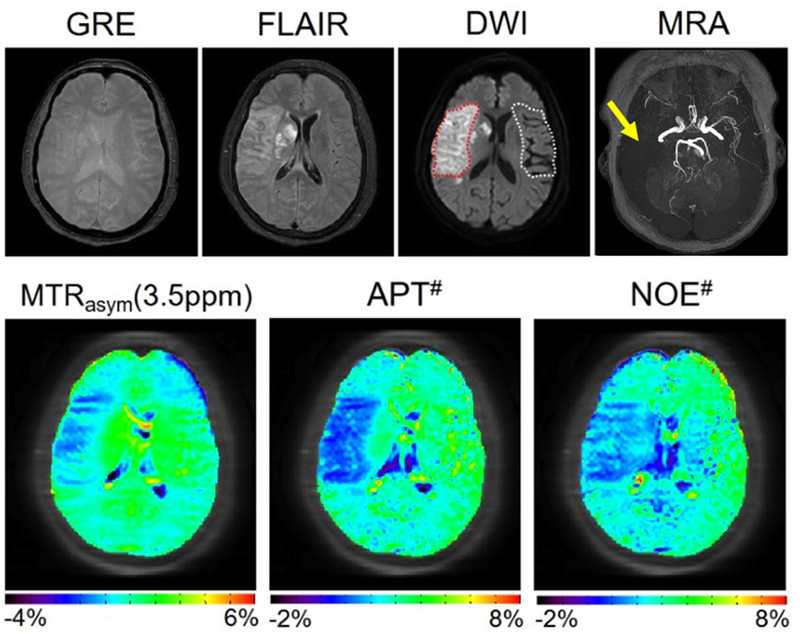
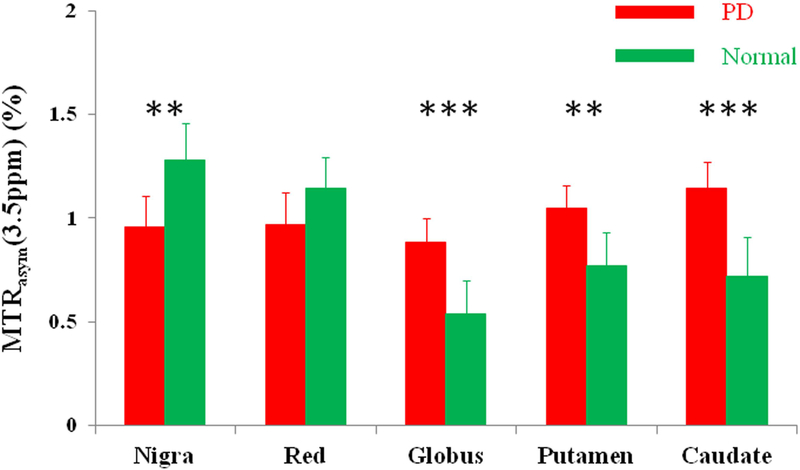
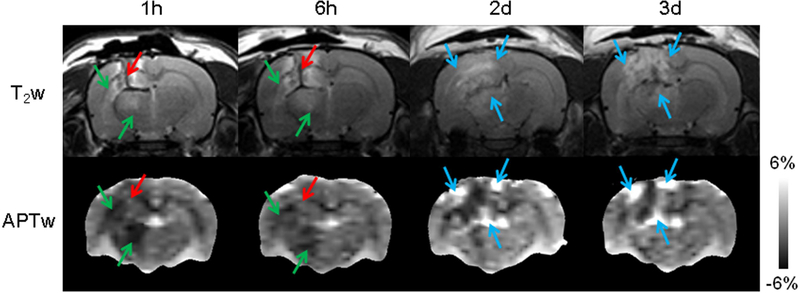
Amide proton transfer-weighted (APTw) imaging is a molecular MRI technique that generates image contrast based predominantly on the amide protons in mobile cellular proteins and peptides that are endogenous in tissue. This technique, the most studied type of chemical exchange saturation transfer imaging, has been used successfully for imaging of protein content and pH, the latter being possible due to the strong dependence of the amide proton exchange rate on pH. In this article we briefly review the basic principles and recent technical advances of APTw imaging, which is showing promise clinically, especially for characterizing brain tumors and distinguishing recurrent tumor from treatment effects. Early applications of this approach to stroke, Alzheimer's disease, Parkinson's disease, multiple sclerosis, and traumatic brain injury are also illustrated. Finally, we outline the technical challenges for clinical APT-based imaging and discuss several controversies regarding the origin of APTw imaging signals in vivo. Level of Evidence: 3 Technical Efficacy Stage: 3 J. Magn. Reson. Imaging 2019;50:347-364.

Keywords: APT-weighted imaging; CEST imaging; brain tumor; molecular imaging; stroke.


Conflict of interest statement

Disclosure of Potential Conflicts of Interest

J.Z. and P.C.M.v.Z. are co-inventors on a patent for the APT MRI technology. This patent is owned and managed by Johns Hopkins University. P.C.M.v.Z. is a paid lecturer for Philips Medical Systems. This arrangement has been approved by The Johns Hopkins University in accordance with its Conflict of Interest policies.

Figures

Figure 1.
Figure 1.
a: CEST/APT detection enhancement principle. The small pool (s) reflects dilute exchangeable amide protons (at ~3.5 ppm downfield of the water resonance) of mobile proteins, and the large pool (w) reflects bulk water protons. The RF irradiation selectively saturates/labels exchangeable protons in pool s, which subsequently exchange with unsaturated protons of pool w (rate ksw). b: Z-spectra and MTRasym spectra for tumor, peritumoral edema and contralateral normal brain tissue in a 9L tumor rat brain model (n = 5). Compared to the peritumoral edema and contralateral normal brain tissue regions, there is a substantial increase in the tumor MTRasym over the 2−3.5 ppm offset range. Reproduced with permission from Zhou et al., Magn Reson Med 2003;50:1120–6.
Figure 2.
Figure 2.
a: 3D APT imaging sequence with gradient- and spin-echo (GRASE) readout. The sequence consisted of 4 block saturation pulses (200 ms each, 2 μT), a frequency modulated lipid suppression pulse, and 3D GRASE image acquisition. b: pTX-based, time-interleaved 3D TSE APT sequence. The RF saturation (tsat = 2 sec) consisted of 40 time-interleaved block pulses on two RF transmit channels (50 ms duration each; 2 μT amplitude). Reproduced with permission from Zhu et al., Magn Reson Med 2010;64:638–44.
Figure 3.
Figure 3.
a: Six-offset APT data acquisition protocol with shimming typically up to the second order. During the APT data acquisition, extra offsets (±3, ±4 ppm) are acquired to correct for the residual B0 inhomogeneity. b: APT data processing flow chart. The procedures include the generation of B0 shift map and correction of APT data using B0 map. Reproduced with permission from Zhou et al., Magn Reson Med 2008;60:842–9.
Figure 4.
Figure 4.
a: APTw and conventional MR images for a patient with a glioblastoma. APT-weighted image shows hyperintensity in the gadolinium-enhancing area (red arrow) and in the centrally cystic area (back arrow), compared to the contralateral brain area. b: APTw and conventional MR images for a patient with a multi-focal grade-3 anaplastic astrocytoma. APT imaging shows that the tumor cores are hyperintense. c: APTw and conventional MR images for a patient with a low-grade glioma. APTw image shows isointensity in the lesion, compared to the contralateral brain tissue. Areas of gadolinium enhancement, FLAIR hyperintensity, and APTw hyperintensity are unique from one another, and APTw imaging adds new information to the standard MRI techniques. Red arrow: tumor core; orange arrow: peritumoral edema. The APTw scan time is 8 min 10 sec. Three of 15 slices are shown. (a and c) Reproduced with permission from Zhou et al., J Magn Reson Imaging 2013;38:1119–28.
Figure 5.
Figure 5.
a: Conventional and APTw MRI and histology from a patient with tumor progression. The gadolinium-enhancing areas on Gd-T1w were hyperintense on the APTw images, compared with the contralateral brain area. H&E-stained section demonstrated spindle mesenchymal cell proliferation with segregated glial cells. b: Conventional and APTw MRI and histology from a patient with the clinical diagnosis of pseudoprogression. The gadolinium-enhancing lesion appeared isointense on APTw, with punctate APTw hyperintensity scattered within the lesion. H&E-stained section showed large necrosis with scattered dying tumor cells and inflammatory cells. For APTw images (display window −5% to 5%), 15 slices were acquired, and only one is shown. Reproduced with permission, and with the addition of pathology images, from Ma et al., J Magn Reson Imaging 2016;44:456–62.
Figure 6.
Figure 6.
APTw imaging of an acute stroke patient with right MCA occlusion (<7 hrs from symptom onset) using the MTR asymmetry analysis and EMR approaches. APT# and NOE# showed much clearer ischemic contrasts than MTRasym(3.5ppm). Reproduced with permission from Heo et al., Magn Reson Med 2017;78:871–80.
Figure 7.
Figure 7.
Comparison of the average MTRasym(3.5ppm) signals of the substantia nigra, red nucleus, globus pallidus, putamen, and caudate for Parkinson’s disease (PD) patients (n = 27) and normal controls (n = 22). In regions of the substantia nigra and red nucleus, the MTRasym(3.5ppm) signals were reduced in PD patients, compared to normal controls. In regions of the globus pallidus, putamen, and caudate, the MTRasym(3.5ppm) signals were increased in PD patients, compared to normal controls. Reproduced with permission from Li et al., Eur Radiol 2014;24:2631–9.
Figure 8.
Figure 8.
A typical example of T2w and APTw images of TBI in a rat at different time points. Green arrows: ischemia; red arrows: hemorrhage; blue arrows: inflammatory response (increased inflammatory cell density). Reproduced with permission from Zhang et al., J Cereb Blood Flow Metab 2017;37:3422–32.
Figure. 9.
Figure. 9.
Average Z-spectra and MTRasym spectra of brain tumors and contralateral normal brain tissue in a rat 9L gliosarcoma model (n = 8) at 4.7T obtained at three different RF saturation powers and tsat = 4 sec. a: Regions of interest (ROIs) for the image analysis defined on an MT-weighted image at 6 ppm. b, c: B1 = 0.6 μT. The downfield Z-spectra of the tumor and contralateral normal brain tissue are both higher than the corresponding reflected Z-spectra. d, e: B1 = 1.3 μT. f, g: B1 = 2.1 μT. At 3.5 ppm (use green dashed vertical guideline), the tumor Z-spectrum is lower than the corresponding reflected Z-spectrum, while the contralateral downfield Z-spectrum is about equal to the corresponding reflected Z-spectrum. Reproduced with permission and with some additions from Zhou et al., Magn. Reson. Med. 2013;70:320–327.

Similar articles

Cited by

References

    1. Weissleder R, Pittet MJ. Imaging in the era of molecular oncology. Nature 2008;452:580–9. - PMC - PubMed
    1. Forsen S, Hoffman RA. Study of moderately rapid chemical exchange reactions by means of nuclear magnetic double resonance. J Chem Phys 1963;39:2892–901.
    1. Ward KM, Aletras AH, Balaban RS. A new class of contrast agents for MRI based on proton chemical exchange dependent saturation transfer (CEST). J Magn Reson 2000;143:79–87. - PubMed
    1. Zhou J, van Zijl PC. Chemical exchange saturation transfer imaging and spectroscopy. Progr NMR Spectr 2006;48:109–36.
    1. Sherry AD, Woods M. Chemical exchange saturation transfer contrast agents for magnetic resonance imaging. Annu Rev Biomed Eng 2008;10:391–411. - PMC - PubMed

Publication types