

Cross-sectional comparison of health-span phenotypes in young versus geriatric marmosets
- PMID: 30664265
- PMCID: PMC7036287
- DOI: 10.1002/ajp.22952
Cross-sectional comparison of health-span phenotypes in young versus geriatric marmosets
Abstract
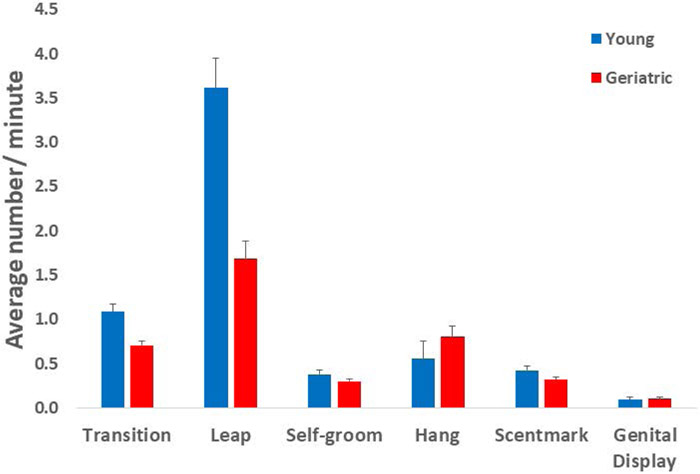
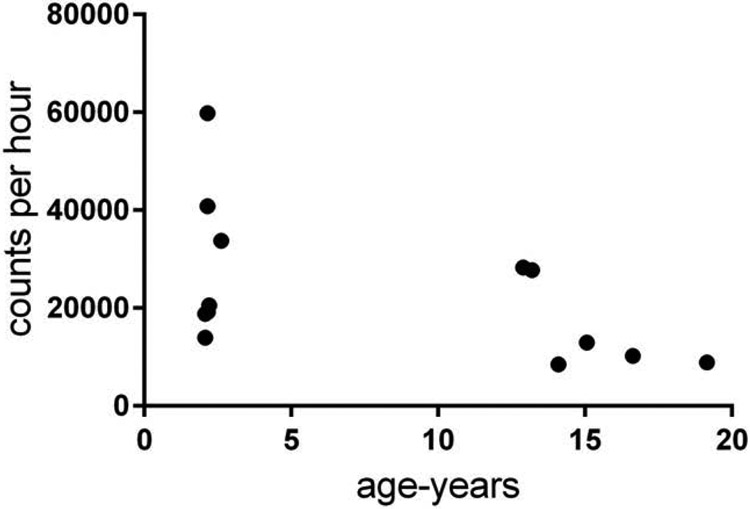
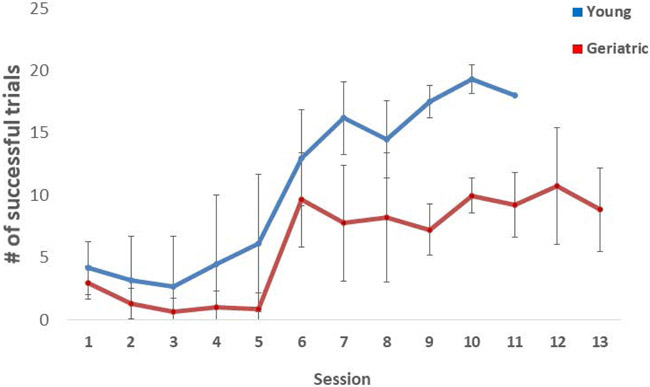
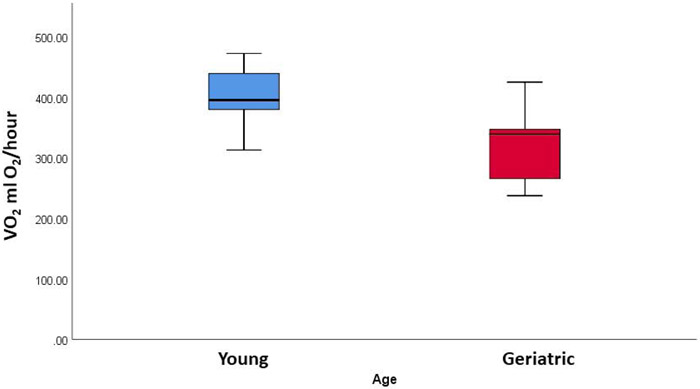
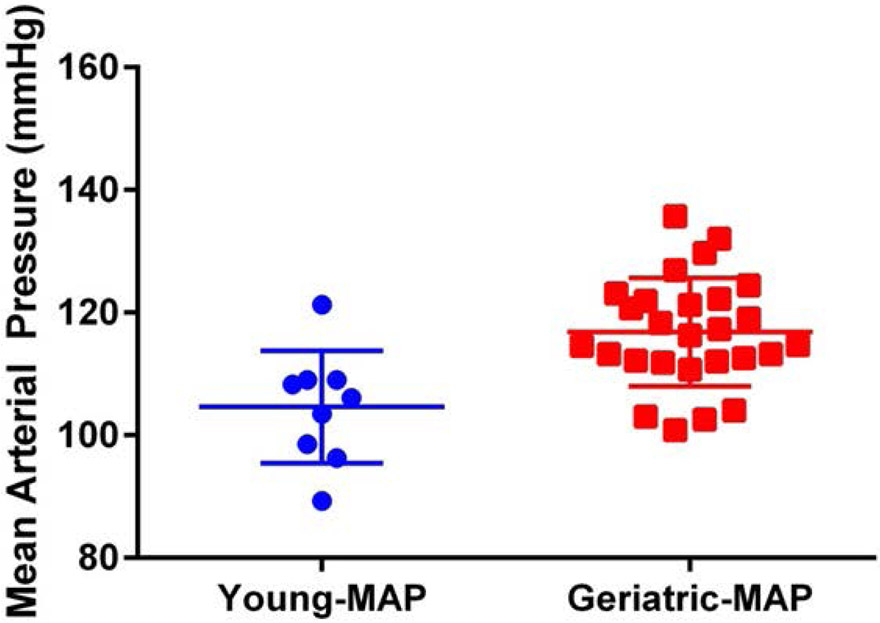
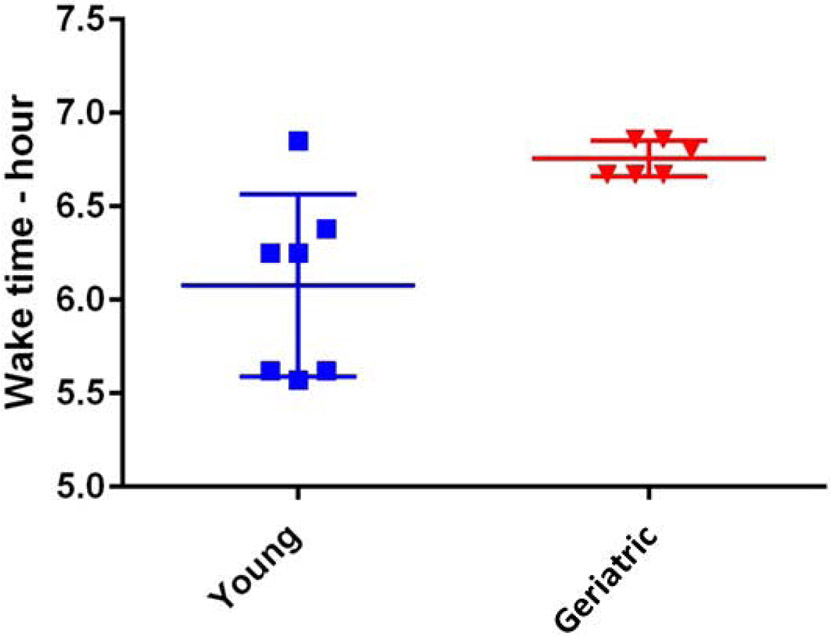
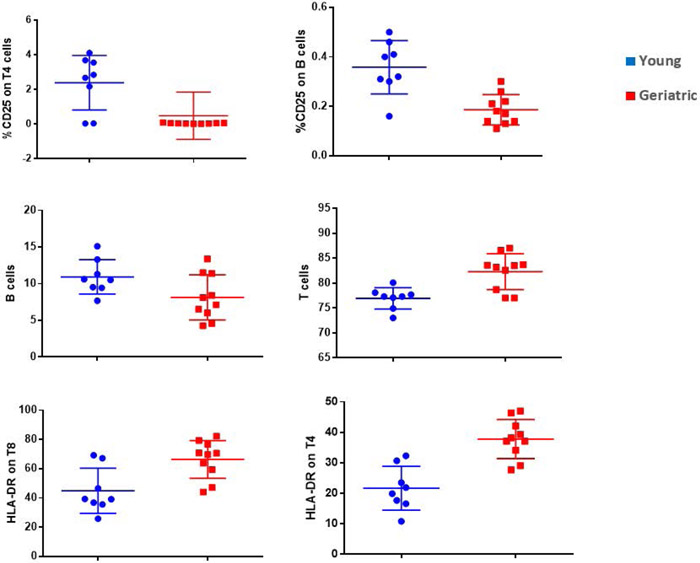
The development of the marmoset as a translational model for healthspan and lifespan studies relies on the characterization of health parameters in young and geriatric marmosets. This cross-sectional study examined health phenotypes in marmosets for five domains of interest for human health and aging: mobility, cognition, metabolism, homeostasis, and immune function. Geriatric marmosets were found to have significant executive function impairment when compared to young animals. While geriatric animals did not show gross abnormalities in mobility and measures of locomotion, their types of movement were altered from young animals. Geriatric marmosets had alterations in cardiac function, with significantly increased mean arterial pressures; metabolism, with significantly lower VO2 ; and suppressed immune function. Further, this study sought to characterize and describe histopathology for both young and geriatric healthy marmosets. Overall this study provides a characterization of health parameters for young and geriatric marmosets which will greatly enhance future aging and interventional testing in marmosets.
Keywords: animal models; biomarkers of aging; healthspan; longevity; nonhuman primates.
© 2019 Wiley Periodicals, Inc.
Figures
Similar articles
-
Age-related changes in the marmoset gut microbiome.Am J Primatol. 2019 Feb;81(2):e22960. doi: 10.1002/ajp.22960. Epub 2019 Feb 25. Am J Primatol. 2019. PMID: 30802990 Free PMC article.
-
The aging common marmoset's immune system: From junior to senior.Am J Primatol. 2020 Jun;82(6):e23128. doi: 10.1002/ajp.23128. Epub 2020 Apr 4. Am J Primatol. 2020. PMID: 32246726
-
Age-Related Learning and Working Memory Impairment in the Common Marmoset.J Neurosci. 2022 Nov 23;42(47):8870-8880. doi: 10.1523/JNEUROSCI.0985-22.2022. Epub 2022 Oct 18. J Neurosci. 2022. PMID: 36257687 Free PMC article.
-
The common marmoset as a model of neurodegeneration.Trends Neurosci. 2023 May;46(5):394-409. doi: 10.1016/j.tins.2023.02.002. Epub 2023 Mar 10. Trends Neurosci. 2023. PMID: 36907677 Review.
-
The role of androgenic steroids in shaping social phenotypes across the lifespan in male marmosets (Callithrix spp.).Am J Primatol. 2013 Mar;75(3):212-21. doi: 10.1002/ajp.22077. Epub 2012 Sep 19. Am J Primatol. 2013. PMID: 23335110 Free PMC article. Review.
Cited by
-
The common marmoset as a translational model of age-related osteoarthritis.Geroscience. 2024 Jun;46(3):2827-2847. doi: 10.1007/s11357-024-01103-5. Epub 2024 Mar 11. Geroscience. 2024. PMID: 38466454 Free PMC article.
-
Improving preclinical to clinical translation of cognitive function for aging-related disorders: the utility of comprehensive touchscreen testing batteries in common marmosets.Cogn Affect Behav Neurosci. 2024 Apr;24(2):325-348. doi: 10.3758/s13415-023-01144-x. Epub 2024 Jan 10. Cogn Affect Behav Neurosci. 2024. PMID: 38200282 Free PMC article.
-
Antibiotic-induced gut dysbiosis elicits gut-brain axis relevant multi-omic signatures and behavioral and neuroendocrine changes in a nonhuman primate model.Gut Microbes. 2024 Jan-Dec;16(1):2305476. doi: 10.1080/19490976.2024.2305476. Epub 2024 Jan 29. Gut Microbes. 2024. PMID: 38284649 Free PMC article.
-
Functional Cardiovascular Characterization of the Common Marmoset (Callithrix jacchus).Biology (Basel). 2023 Aug 11;12(8):1123. doi: 10.3390/biology12081123. Biology (Basel). 2023. PMID: 37627007 Free PMC article.
-
Induction of Anxiety-Like Phenotypes by Knockdown of Cannabinoid Type-1 Receptors in the Amygdala of Marmosets.Neurosci Bull. 2023 Nov;39(11):1669-1682. doi: 10.1007/s12264-023-01081-2. Epub 2023 Jun 27. Neurosci Bull. 2023. PMID: 37368194 Free PMC article.
References
Publication types
MeSH terms
Grants and funding
LinkOut - more resources
Full Text Sources
Medical
