. 2019 Jan 21;10(1):360.
doi: 10.1038/s41467-018-08126-5.

C1 CAGE detects transcription start sites and enhancer activity at single-cell resolution

Affiliations

C1 CAGE detects transcription start sites and enhancer activity at single-cell resolution

Tsukasa Kouno et al. Nat Commun. .

Abstract

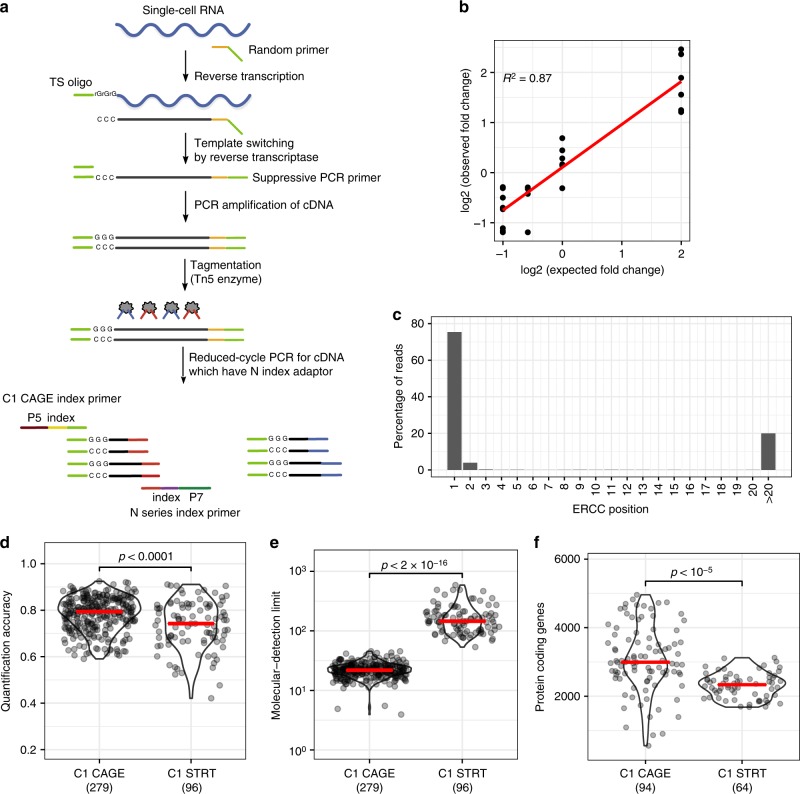
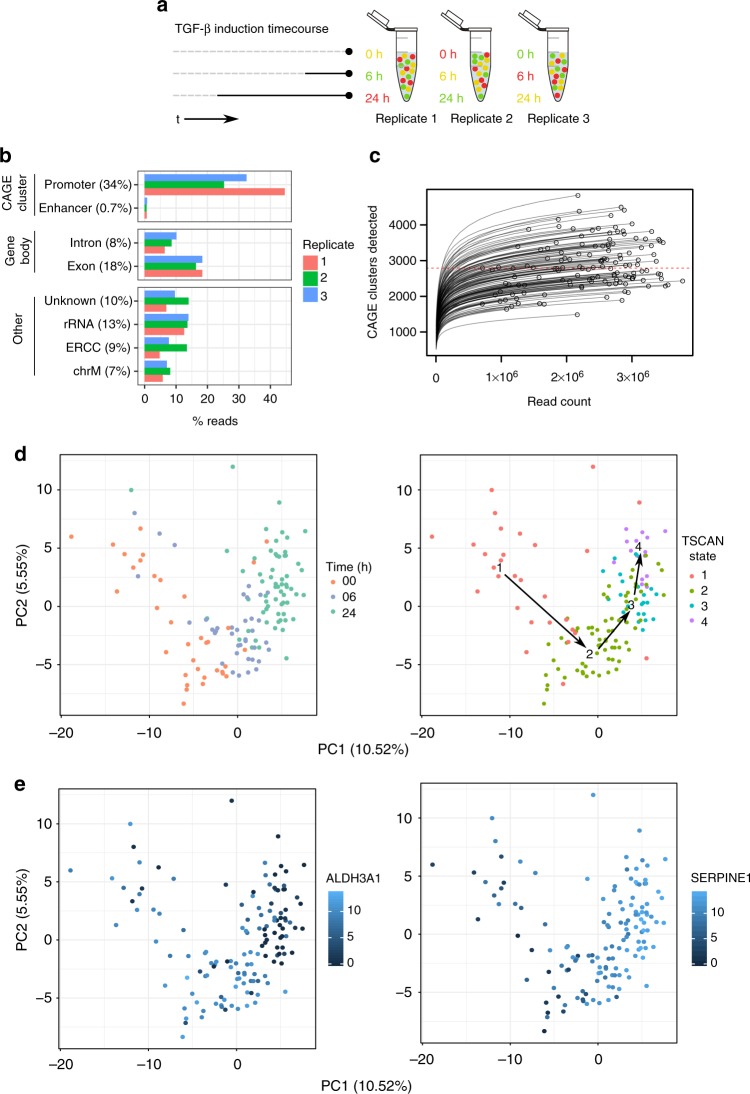
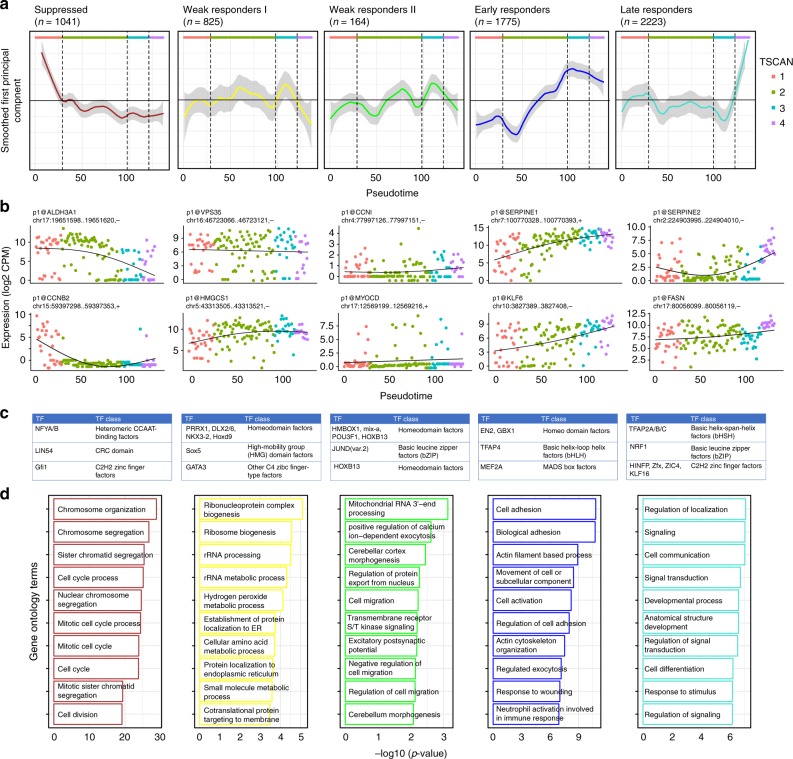
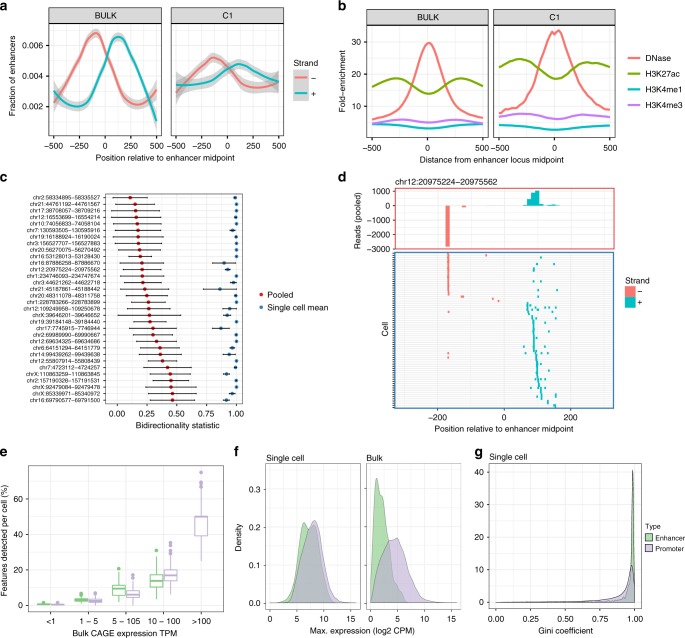
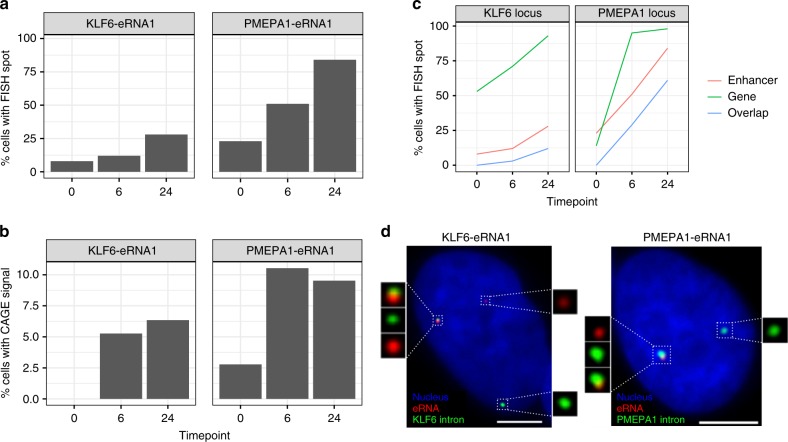
Single-cell transcriptomic profiling is a powerful tool to explore cellular heterogeneity. However, most of these methods focus on the 3'-end of polyadenylated transcripts and provide only a partial view of the transcriptome. We introduce C1 CAGE, a method for the detection of transcript 5'-ends with an original sample multiplexing strategy in the C1TM microfluidic system. We first quantifiy the performance of C1 CAGE and find it as accurate and sensitive as other methods in the C1 system. We then use it to profile promoter and enhancer activities in the cellular response to TGF-β of lung cancer cells and discover subpopulations of cells differing in their response. We also describe enhancer RNA dynamics revealing transcriptional bursts in subsets of cells with transcripts arising from either strand in a mutually exclusive manner, validated using single molecule fluorescence in situ hybridization.


Conflict of interest statement

N.R. is an employee and stockholder of Fluidigm Corporation. The remaining authors declare no competing interests.

Figures

Fig. 1
Fig. 1
The C1 CAGE method and performance. a Schematic of the C1 CAGE method. Tn5 enzymes are loaded with two different adapters: N (red) and S (blue). P5, P7: Illumina sequencing adapters. b Observed and expected fold-change ratios between ERCC mix1 and mix2. Linear regression line (red) and R-squared value shown. c Percentage of reads aligning to the 5ʹ-end of ERCC spike-ins by nucleotide position. df Comparison between C1 CAGE and C1 STRT Seq (data from Svensson et al.) Red bars show median values. p-values from Welch's two-sided two sample t test shown. d Pearson correlation between expected and observed ERCC spike-in molecules. e The number of ERCC spike-in molecules required for a 50% chance of detection. f Protein-coding genes detected in mouse ES cells counting reads within FANTOM5 promoter regions. Source data are provided as a Source Data file
Fig. 2
Fig. 2
Multiplexing time course strategy. a Different combinations of Calcein red and green are added to each timepoint for each replicate. b Forward read 5ʹ-end counts by annotation category. Mean read percentage per category shown in brackets. c Count of CAGE clusters within each cell after subsampling. Dashed red line at median (2788). d PCA of cells performed on variable subset of CAGE clusters, percentage of variance explained by components shown, cells colored by time point and TSCAN state. e PCA of cells performed on variable subset of CAGE clusters, percentage of variance explained by components shown, cells colored by expression values for the marker genes ALDH3A1 and SERPINE1 demonstrating that the dynamics of TGF-β response are captured by the TSCAN states. Source data are provided as a Source Data file
Fig. 3
Fig. 3
WGCNA clusters of response to TGF-β. a CAGE cluster expression profiles for 5 WGCNA modules, 3 of which show a clear response to TGF-β (suppressed, early responders, and late responders). The curves are smoothed with the loess R function. b Example CAGE cluster expression profiles from each module. c Top three enriched TF binding profiles in each module. d Functional analysis using edgeR’s implementation of GOseq. Top over-represented GO terms for biological processes are shown. Source data are provided as a Source Data file
Fig. 4
Fig. 4
Enhancer analysis at single-cell resolution. Comparison of enhancers detected by bulk CAGE and pooled C1 CAGE data a showing bidirectional read profiles smoothed by generalized additive model and b epigenetic profiles. c Bidirectionality scores (0: equally bidirectional; 1: fully unidirectional) at selected enhancers for pooled cells downsampled to the same depth as corresponding single cells 100 times (red dots: mean, black bars: standard error) and single-cells (blue dots: mean; black bars: standard error). d Example locus on chromosome 12: read profile histogram (upper box), and read presence or absence in single-cells (lower box). eg Comparison of enhancers and gene promoters in C1 CAGE and bulk CAGE: e fraction of bulk features detected within each cell, stratified by bulk expression level, centre line = median, box = 25th to 75th percentiles, whiskers = up to 1.5× interquartile range from the box. f Density plots of the maximum expression levels, g Gini coefficient distribution in single-cell data. Lower scores: broad expression (expressed in more cells); higher scores: more specific/enriched expression (fewer cells). Source data are provided as a Source Data file
Fig. 5
Fig. 5
Enhancer and promoter profiles in smFISH. a, b Proportion of cells with KLF6-eRNA1 and PMEPA1-eRNA1 detected by a FISH, b C1 CAGE. c Proportion of cells with detected gene intronic RNA and eRNA and cells with spot overlap at the KLF6 and PMEPA1 loci. d Representative images showing gene intronic RNA and eRNA detection by FISH. Bar = 5 μm. n = 100 per time point. Source data are provided as a Source Data file

References

    1. Trapnell C. Defining cell types and states with single-cell genomics. Genome Res. 2015;25:1491–1498. doi: 10.1101/gr.190595.115. - DOI - PMC - PubMed
    1. Wagner A, Regev A, Yosef N. Revealing the vectors of cellular identity with single-cell genomics. Nat. Biotechnol. 2016;34:1145–1160. doi: 10.1038/nbt.3711. - DOI - PMC - PubMed
    1. Shiraki T, et al. Cap analysis gene expression for high-throughput analysis of transcriptional starting point and identification of promoter usage. Proc. Natl Acad. Sci. 2003;100:15776–15781. doi: 10.1073/pnas.2136655100. - DOI - PMC - PubMed
    1. Carninci P, et al. Genome-wide analysis of mammalian promoter architecture and evolution. Nat. Genet. 2006;38:626–635. doi: 10.1038/ng1789. - DOI - PubMed
    1. Forrest ARR, et al. A promoter-level mammalian expression atlas. Nature. 2014;507:462–470. doi: 10.1038/nature13182. - DOI - PMC - PubMed

Publication types

MeSH terms

Substances