. 2019 Jan 21;10(1):339.
doi: 10.1038/s41467-018-08000-4.

Genome-wide association study of body fat distribution identifies adiposity loci and sex-specific genetic effects

Affiliations

Genome-wide association study of body fat distribution identifies adiposity loci and sex-specific genetic effects

Mathias Rask-Andersen et al. Nat Commun. .

Abstract

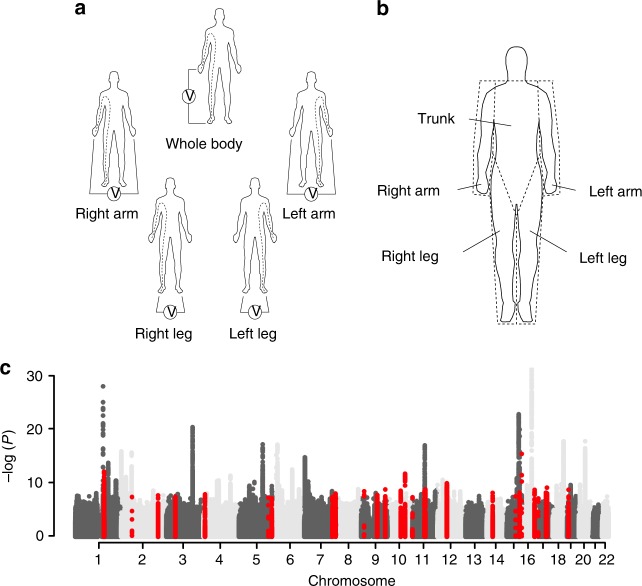
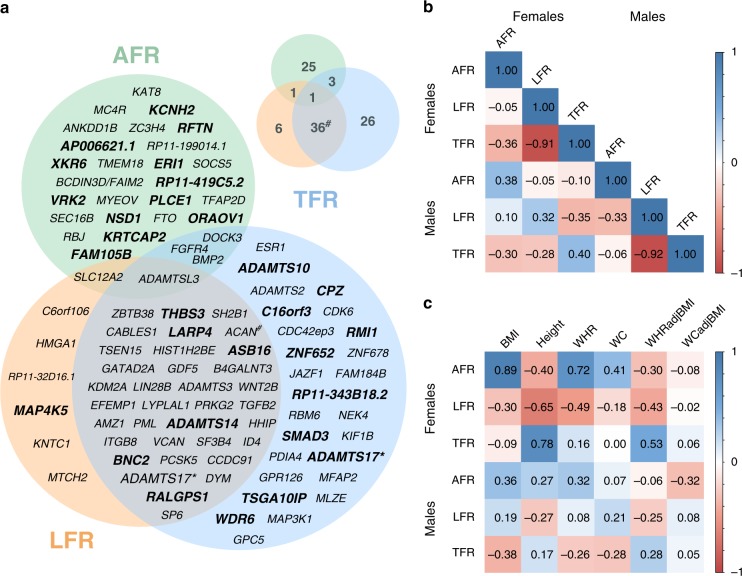
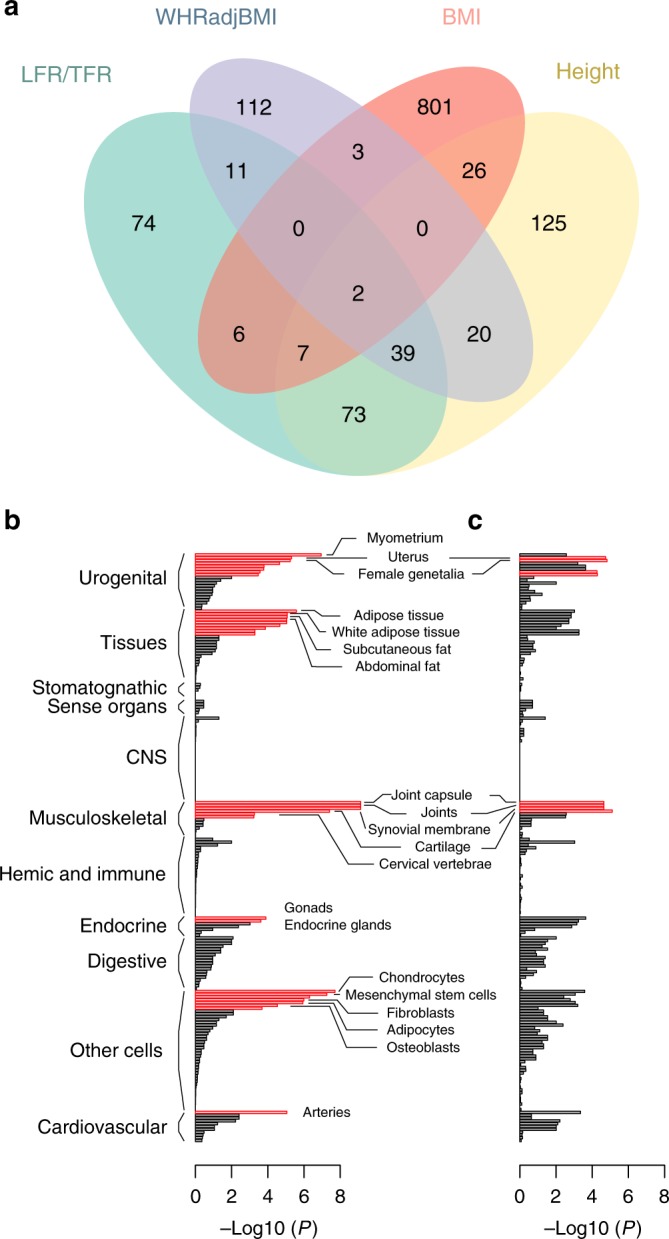
Body mass and body fat composition are of clinical interest due to their links to cardiovascular- and metabolic diseases. Fat stored in the trunk has been suggested to be more pathogenic compared to fat stored in other compartments. In this study, we perform genome-wide association studies (GWAS) for the proportion of body fat distributed to the arms, legs and trunk estimated from segmental bio-electrical impedance analysis (sBIA) for 362,499 individuals from the UK Biobank. 98 independent associations with body fat distribution are identified, 29 that have not previously been associated with anthropometric traits. A high degree of sex-heterogeneity is observed and the effects of 37 associated variants are stronger in females compared to males. Our findings also implicate that body fat distribution in females involves mesenchyme derived tissues and cell types, female endocrine tissues as well as extracellular matrix maintenance and remodeling.


Conflict of interest statement

The authors declare no competing interests.

Figures

Fig. 1
Fig. 1
Segmental body impedance analyses. This method uses bio-electrical impedance to estimate body composition: fat mass, muscle mass, etc. In this study, adipose tissue mass was estimated using the Tanita BC-418MA body composition analyzer (a). This machine uses an eight-electrode method, which allows for five measurements of impedance. Electrical current is supplied to the front of both feet and the fingertips of both hands. Voltage is measured on either heel or thenar portion of the palms. Body composition is derived from a regression formula for each body part. The formula is derived from regression analysis using height, weight, age and impedance for each body part as predictors for composition of each body part as assessed by DXA (b). GWAS for AFR, LFR, and TFR were conducted in the UK Biobank cohort and revealed associations with loci that have not previously been associated with standard anthropometric traits. c A manhattan plot with combined results for association studies of body fat ratios in combined and sex-stratified analyses. Overall, 135 independent associations with at least one of the body fat ratios were observed in the discovery analyses. Out of the initial 135 associations, 98 replicated; of which 30 replicated for AFR, 44 for LFR and 66 for TFR. Loci that have not previously been associated with an anthropomorphic trait are highlighted in red (N = 29)
Fig. 2
Fig. 2
Overlap and genetic correlation between body fat ratios and other anthropometric traits. a The overlap between AFR-, LFR-, and TFR-associated loci is illustrated as a Venn diagram. The loci are denoted by the nearest gene or by the most likely target gene (see methods section). The loci in bold type and larger font designate loci that have not previously been associated with an anthropometric trait. The total number in each field is illustrated top right. *: Two independent signals were observed within the ADAMTS17 locus: one with an effect on LFR and one on TFR. #: Two independent associations with LFR and TFR were observed within the ACAN locus. b Genetic correlation between body fat ratios within, and between sexes. Genetic correlations were estimated by cross-trait LD-score regression. The absolute values for each genetic correlation (rg) is included. c Genetic correlations between body fat ratios and standard anthropometric traits. Sex-stratified summary statistics were generated for each trait by GWAS in the discovery cohort. Color scales represent genetic correlation and range from red (−1.0: perfect anticorrelation) to blue (1.0 perfect correlation)
Fig. 3
Fig. 3
Enrichment analyses of genes at LFR and TFR-associated loci. a Reconstituted gene-sets that were enriched for TFR- and LFR-associated genes (in both males and females) were compared to results from previous GWAS on WHRadjBMI, BMI, and height. Tissue and cell type enrichment of b TFR- and c LFR-associated genes in females. Red bars denote tissues gene sets that were significantly enriched for LFR- and TFR-associated genes at FDR < 0.05/12

References

    1. Afshin A, et al. Health effects of overweight and obesity in 195 countries over 25 years. N. Engl. J. Med. 2017;377:13–27. doi: 10.1056/NEJMoa1614362. - DOI - PMC - PubMed
    1. Ng M, et al. Global, regional, and national prevalence of overweight and obesity in children and adults during 1980-2013: a systematic analysis for the Global Burden of Disease Study 2013. Lancet. 2014;384:766–781. doi: 10.1016/S0140-6736(14)60460-8. - DOI - PMC - PubMed
    1. Di Cesare M, et al. Trends in adult body-mass index in 200 countries from 1975 to 2014: A pooled analysis of 1698 population-based measurement studies with 19.2 million participants. Lancet. 2016;387:1377–1396. doi: 10.1016/S0140-6736(16)30054-X. - DOI - PMC - PubMed
    1. Pi-Sunyer, F. X. Clinical guidelines on the identification, evaluation, and treatment of overweight and obesity in adults: the evidence report. National Institutes of Health. Obes Res. 6 Suppl 2, 51S–209S (1998). - PubMed
    1. Link JC, Reue K. The genetic basis for sex differences in obesity and lipid metabolism. Annu. Rev. Nutr. 2017;37:225–245. doi: 10.1146/annurev-nutr-071816-064827. - DOI - PMC - PubMed

Publication types

MeSH terms