. 2019 Jan 21;10(1):357.
doi: 10.1038/s41467-018-07863-x.

Low-frequency variation in TP53 has large effects on head circumference and intracranial volume

Collaborators, Affiliations

Low-frequency variation in TP53 has large effects on head circumference and intracranial volume

Simon Haworth et al. Nat Commun. .

Abstract

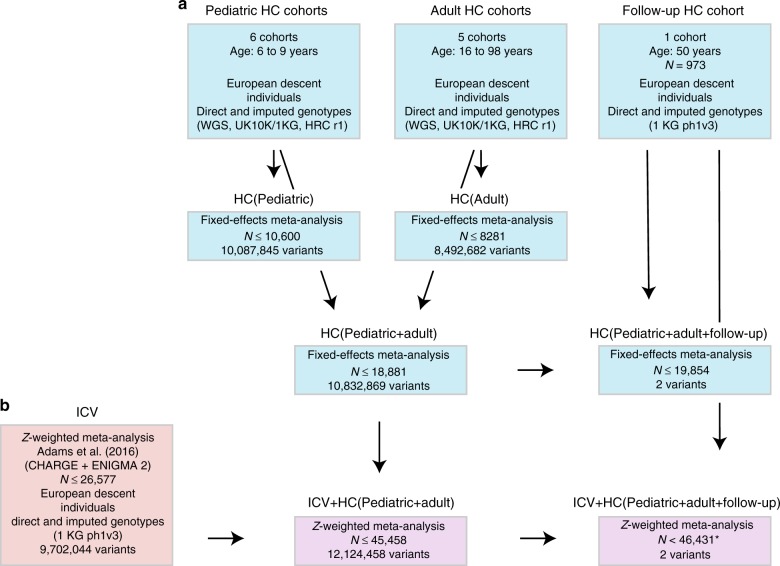
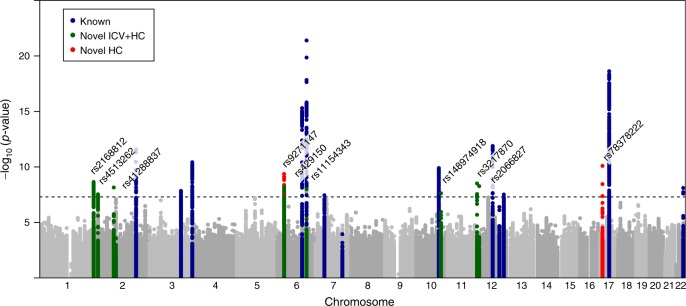
Cranial growth and development is a complex process which affects the closely related traits of head circumference (HC) and intracranial volume (ICV). The underlying genetic influences shaping these traits during the transition from childhood to adulthood are little understood, but might include both age-specific genetic factors and low-frequency genetic variation. Here, we model the developmental genetic architecture of HC, showing this is genetically stable and correlated with genetic determinants of ICV. Investigating up to 46,000 children and adults of European descent, we identify association with final HC and/or final ICV + HC at 9 novel common and low-frequency loci, illustrating that genetic variation from a wide allele frequency spectrum contributes to cranial growth. The largest effects are reported for low-frequency variants within TP53, with 0.5 cm wider heads in increaser-allele carriers versus non-carriers during mid-childhood, suggesting a previously unrecognized role of TP53 transcripts in human cranial development.


Conflict of interest statement

I.T. is an employee of GlaxoSmithKline. The remaining authors declare no competing interests.

Figures

Fig. 1
Fig. 1
Study design. a Head circumference meta-analysis design using a fixed-effect meta-analysis including different developmental stages. b Combined head circumference and intracranial volume meta-analysis design using a Z-weighted meta-analysis. ICV intracranial volume. WGS whole-genome sequencing; UK10K/1KG Joint UK10K/1000 Genomes imputation template, 1KG 1000 Genomes imputation template, HRC The Haplotype Reference Consortium r1. *Due to sample dropout only N ≤ 43,529 were available
Fig. 2
Fig. 2
Genome-wide association with final head circumference (HC). a HC(Pediatric): N = 8281, b HC(Adult): N = 10,600 and c HC(Pediatric + adult): N = 18,881 inverse-variance weighted meta-analyses. The dashed line represents the threshold for nominal genome-wide (p < 5.0 × 10−8) significance. Accounting for multiple testing, the adjusted level of genome-wide significance is p < 3.3 × 10−8. Known variants for intracranial volume, brain volume, and head circumference are shown in blue. Novel signals passing a nominal genome-wide association threshold (p < 5.0 × 10−8) are shown with their lead SNP in red. Replicated signals are labeled with a red cross. The genomic position is shown according to NCBI Build 37
Fig. 3
Fig. 3
Regional association plot at 17p13.1 associated with final head circumference (HC) and final cranial dimension. a Depicts a 800 Mb window and b a zoomed view of genetic association signals and functional annotations near TP53. Within each plot, in the first panel SNPs are plotted with their −log10 p value as a function of the genomic position (b37). This panel shows the statistical evidence for association based on HC (Pediatric + adult) and combined ICV + HC (Pediatric + adult) meta-analyses, including HC follow-up studies. SNPs are colored according to their correlation with the HC lead signal (rs35850753, pairwise LD-r2-values). The second panel represents the gene region (ENSEMBL GRCh37). The third panel in (b) presents the Genomic Evolutionary Rate Profiling (GERP++) score of mammalian alignments. The last four panels in (b) show 4 of 15 core chromatin states, present in the zoomed view, from the Roadmap Epigenomics Consortium including Embryonic Stem Cells (ESC), hESC Derived CD56 + Ectoderm Cultured Cells, Fetal Brain (Male) and Brain Dorsolateral Prefrontal Cortex respectively (see legend for color coding)
Fig. 4
Fig. 4
Stratified head circumference growth model trajectories for rs35850753 carriers (T-allele) versus non carriers (C-allele). The growth model was based on untransformed head circumference (cm) scores spanning birth to 15 years observed in 6225 ALSPAC participants with up to 13 repeat measures (17,269 observations) using a mixed effect SuperImposition by Translation And Rotation (SITAR) model
Fig. 5
Fig. 5
Genetic architecture of head circumference (HC). a Linkage-disequilibrium score SNP-heritability (LDSC-h2) for HC (Pediatric), HC (Adult) and HC (Pediatric + adult) meta-analyses. b Genetic-relationship matrix structural equation modeling (GSEM) of head circumference during development: Path diagram of the full Cholesky decomposition model using longitudinal head circumference measures from ALSPAC (1.5 years (N = 3945), 7 years (N = 5819), and 15 years (N = 3406)). Phenotypic variance (P1, P2, P3) was dissected into genetic (A1, A2 and A3) and residual (E1, E2 and E3) factors. Observed measures are represented by squares and latent factors by circles. Single-headed arrows define relationships between variables. The variance of latent variables is constrained to unit variance. c Standardized genetic and residual variance components for head circumference during development. Variance components were estimated using the GSEM model as shown in (b). d Linkage-disequilibrium score correlation (LDSC-rg) for HC (Pediatric), HC (Adult) and HC (Pediatric + adult) and 235 phenotypes: 17 genetic correlation estimates passing a Bonferroni threshold (p < 0.00014) are shown with their standard errors. ***p < 10−8; **p < 10−5; *p < 0.00014
Fig. 6
Fig. 6
Genome-wide association analysis of final cranial dimension. A genome-wide weighted Z-score meta-analysis of combined head circumference (HC) and intracranial volume (ICV) was carried out (ICV + HC (Pediatric + adult): N = 45,458). The dashed line represents the threshold for nominal genome-wide (p < 5.0 × 10−8) significance. Accounting for multiple testing, the adjusted level of genome-wide significance is p < 3.3×10⁻⁸. Known variants for ICV, brain volume, and HC are shown in blue. Novel signals passing a nominal genome-wide association threshold (p < 5.0 × 10−8) are shown with their lead SNP in green (Table 2, Table S15). HC (Pediatric + adult) signals identified in this study are shown in red. The genomic position is shown according to NCBI Build 37

References

    1. Fabbri M, et al. The skull roof tracks the brain during the evolution and development of reptiles including birds. Nat. Ecol. Evol. 2017;1:1543. doi: 10.1038/s41559-017-0288-2. - DOI - PubMed
    1. Koyabu D, et al. Mammalian skull heterochrony reveals modular evolution and a link between cranial development and brain size. Nat. Commun. 2014;5:3625. doi: 10.1038/ncomms4625. - DOI - PMC - PubMed
    1. Harris SR. Measuring head circumference: update on infant microcephaly. Can. Fam. Physician. 2015;61:680–684. - PMC - PubMed
    1. Maunu J, et al. Brain and ventricles in very low birth weight infants at term: a comparison among head circumference, ultrasound, and magnetic resonance imaging. Pediatrics. 2009;123:617–626. doi: 10.1542/peds.2007-3264. - DOI - PubMed
    1. Bartholomeusz H, Courchesne E, Karns C. Relationship between head circumference and brain volume in healthy normal toddlers, children, and adults. Neuropediatrics. 2002;33:239–241. doi: 10.1055/s-2002-36735. - DOI - PubMed

Publication types