. 2019 Jan 21;10(1):348.
doi: 10.1038/s41467-018-08255-x.

BAP1 complex promotes transcription by opposing PRC1-mediated H2A ubiquitylation

Affiliations

BAP1 complex promotes transcription by opposing PRC1-mediated H2A ubiquitylation

Antoine Campagne et al. Nat Commun. .

Abstract

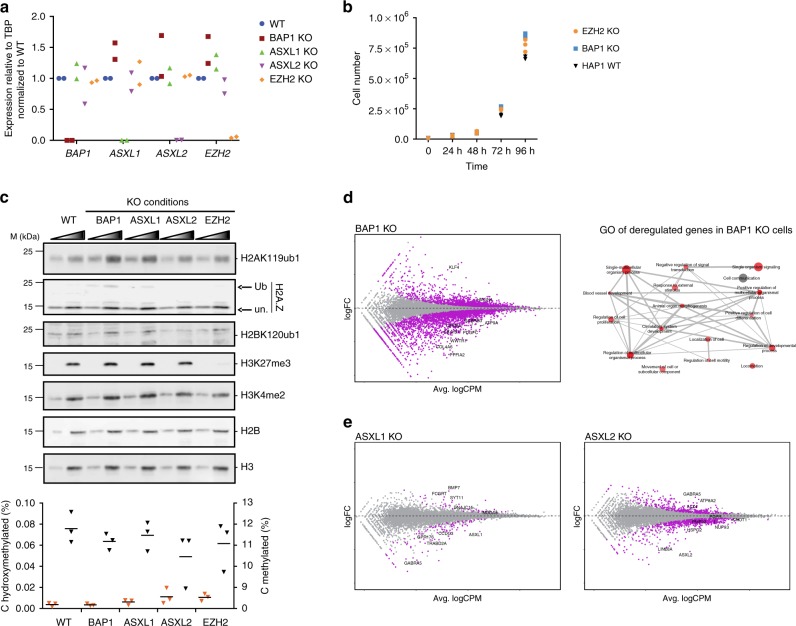
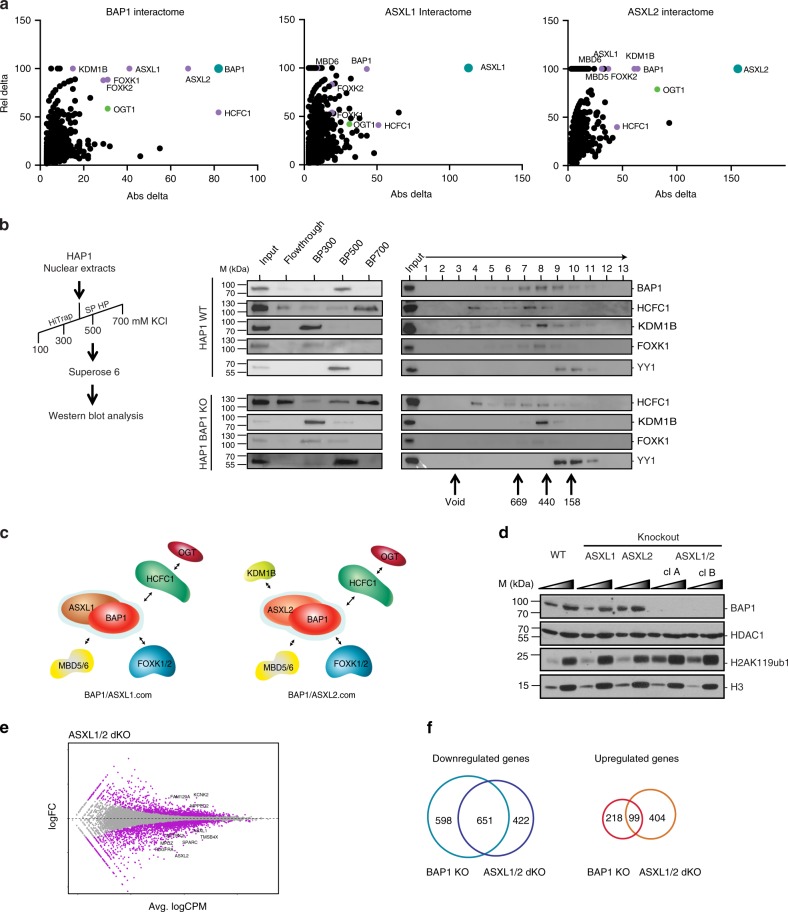
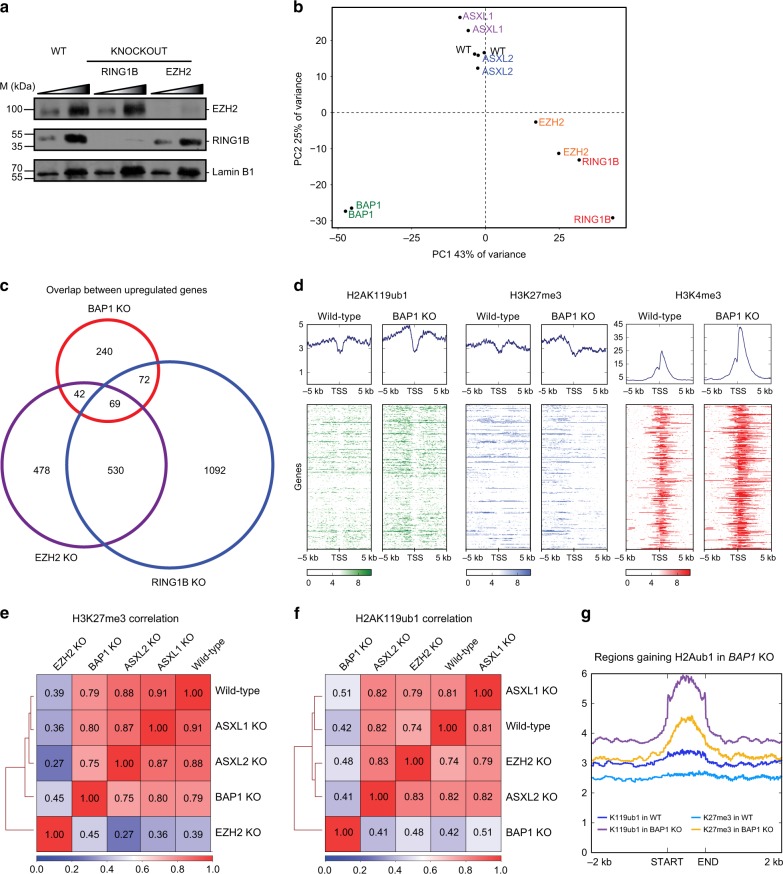
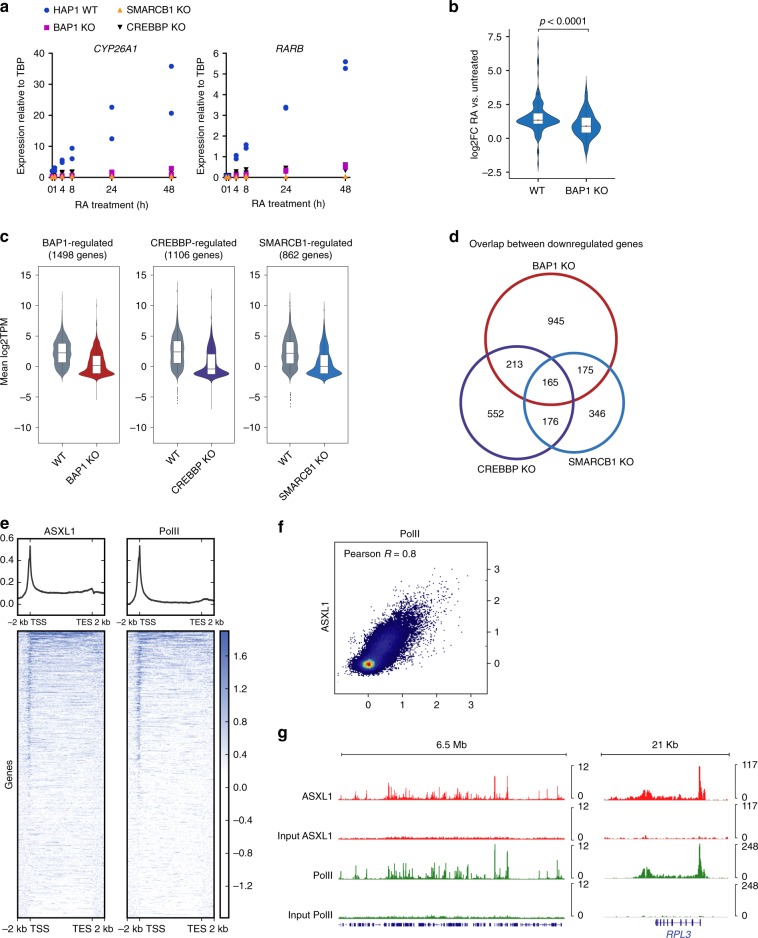
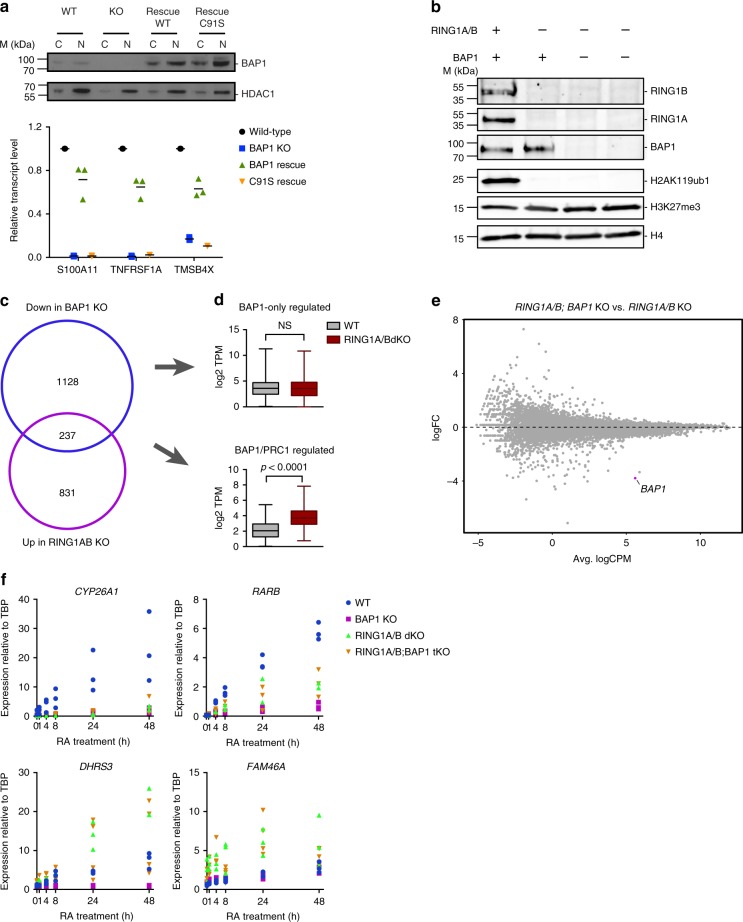
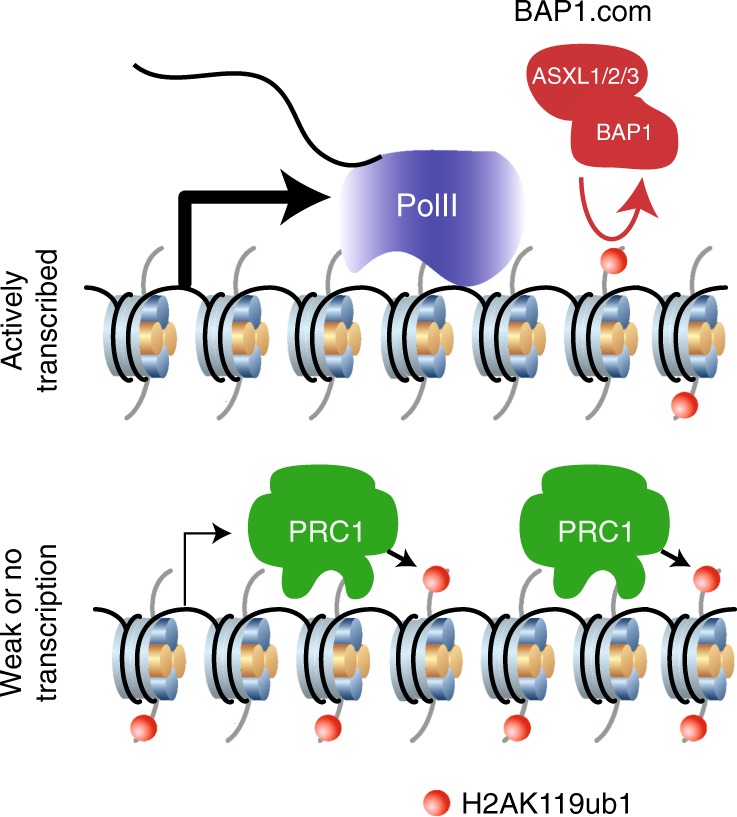
In Drosophila, a complex consisting of Calypso and ASX catalyzes H2A deubiquitination and has been reported to act as part of the Polycomb machinery in transcriptional silencing. The mammalian homologs of these proteins (BAP1 and ASXL1/2/3, respectively), are frequently mutated in various cancer types, yet their precise functions remain unclear. Using an integrative approach based on isogenic cell lines generated with CRISPR/Cas9, we uncover an unanticipated role for BAP1 in gene activation. This function requires the assembly of an enzymatically active BAP1-associated core complex (BAP1.com) containing one of the redundant ASXL proteins. We investigate the mechanism underlying BAP1.com-mediated transcriptional regulation and show that it does not participate in Polycomb-mediated silencing. Instead, our results establish that the function of BAP1.com is to safeguard transcriptionally active genes against silencing by the Polycomb Repressive Complex 1.


Conflict of interest statement

The authors declare no competing interests.

Figures

Fig. 1
Fig. 1
Functional consequences of loss of BAP1, ASXL1, or ASXL2 on chromatin and gene expression. a RT-qPCR analysis of BAP1, ASXL1, ASXL2, and EZH2 expression in the different KO conditions indicated on top. n = 2. b Proliferation curve of wild-type, EZH2 KO and BAP1 KO HAP1 cells. n = 3. c Top, western blot analysis of acid extracted histones with antibodies directed against various histone modifications (as indicated on the right) in the different cell lines indicated on top, M  molecular weight. A two-point titration (1:2.5 ratio) is shown for each condition, ub  ubiquitinated, un unmodified. Bottom, analysis of cytosine methylation (blue triangles) or hydroxymethylation (red triangles) in the KO conditions indicated at the bottom. Horizontal bars indicate the mean. n = 3. d Left panel: scatterplot showing log2 fold-change (logFC) expression between wild-type and BAP1 KO cells versus average log2 counts per million (logCPM). Differentially expressed genes (DEGs) in BAP1 KO cells are highlighted in purple. Right panel: representation of the non-redundant most enriched GO terms within the DEGs in BAP1 KO cells. e Scatterplots as in d, showing gene expression changes in ASXL1 and ASXL2 KO cells
Fig. 2
Fig. 2
BAP1.com core complex and associated factors. a Mass spectrometry analysis of HeLa cells overexpressing Flag-tagged versions of BAP1, ASXL1, and ASXL2. Graphs represent proteins relative to their absolute (Abs) and relative (Rel) delta compared with mass spectrometry analysis of empty vector expressing cells. Absolute delta is the absolute difference between distinct peptides identified in sample and control; relative delta is the ratio of absolute delta versus the sum of distinct peptides identified in sample and control. b Elution patterns of HAP1 WT and HAP1 BAP1-KO nuclear extracts following the purification scheme indicated in the left panel and monitored by western blot with the indicated antibodies. Middle pattern is a representative elution pattern (step elution with increased salt concentration) on a cation exchange column (SP-HP, GE). Right panel is a representative elution pattern on a size-exclusion column (Superose 6, PC3.2/30, GE). Underneath is the correspondent. c Schematic of BAP1.com core complex and associated factors depending on the ASXL paralog present. d Western blot analysis of BAP1 and H2AK119ub1 in the different KO conditions indicated above. Two independent clones of ASXL1/2 dKO cells are shown. HDAC1 and H3 serve as nuclear and histone protein loading control respectively. A two-point titration (1:2.5 ratio) is shown for each condition. e Scatterplot showing log2 fold-change (logFC) expression between wild-type and ASXL1/2 dKO cells as a function of average log2 counts per million (logCPM). Differentially expressed genes in ASXL1/2 dKO cells are highlighted in purple. f Venn diagram showing the overlap between genes downregulated or upregulated (right) in BAP1 KO and ASXL1/2 dKO cells
Fig. 3
Fig. 3
BAP1.com is dispensable for Polycomb-mediated silencing. a Western blot analysis of EZH2 and RING1B in wild-type (WT), RING1B KO, and EZH2 KO cells. Lamin B1 is used as a loading control. A two-point titration (1:2 ratio) is shown for each condition. b PCA analysis of WT, RING1B, EZH2, ASXL1, ASXL2, and BAP1 KO transcriptome. c Venn diagram showing the overlap between genes upregulated in BAP1, EZH2, or RING1B KO cells. d Heatmaps showing H2AK119ub1, H3K27me3, and H3K4me3 distribution in a −5/ + 5 kb window around the transcription start site (TSS) of genes upregulated in BAP1 KO cells in wild-type and BAP1 KO cells. Corresponding average profiles are plotted on top of each heatmap. e, f Correlation heatmap of H3K27me3 (e) and H2AK119ub1 (f) distribution between wild-type cells and the different KO conditions indicated. g Plots showing average enrichment of H2AK119ub1 and H3K27me3 in wild-type and BAP1 KO cells at regions that gain H2AK119ub1 upon BAP1 loss
Fig. 4
Fig. 4
BAP1.com promotes transcription independently of an antagonism with the PRC2 complex. a Heatmaps showing H2AK119ub1, H3K27me3, and H3K4me3 distribution in a −5/ + 5 kb window around the transcription start site (TSS) of genes downregulated in BAP1 KO cells in wild-type and BAP1 KO cells. Corresponding average profiles are plotted on top of each heatmap. b Western blot analysis of BAP1 and EZH2 in single and double BAP1/EZH2 KO cells. HDAC1 is used as a loading control. c Dot plot showing proliferation of wild-type cells and two independent clones of BAP1/EZH2 dKO cells. n = 3. d Heatmap of gene expression (Z-scores) in the different genotypes. Top: BAP1-only-regulated genes, and bottom: BAP1- and EZH2-regulated genes, TSS = transcription start site. e Box-plots (median, lower, and upper quartiles, lowest and highest values) of log2 transcript per million (TPM) expression values of BAP1-only-regulated genes (top) and BAP1/EZH2-regulated genes in the different conditions as indicated. Result of the Mann–Whitney test on the EZH2 KO versus wild-type comparison is indicated. f Plot showing average enrichment of H2AK119ub1, H3K27me3, and H3K4me3 in a −5/ + 5 kb around the TSS for BAP1-only-regulated genes (top) and BAP1/EZH2-regulated genes. g Example snapshots of H2AK119ub1, H3K27me3, and H3K4me3 enrichment in WT and BAP1 KO cells at a BAP1-only-regulated gene and a BAP1/EZH2-regulated gene (middle). Expression values of the corresponding genes across WT, EZH2, BAP1, and BAP1/EZH2 KO conditions as detected in corresponding RNA-seq data are shown on the right. Horizontal bars indicate the mean expression
Fig. 5
Fig. 5
Comparison of BAP1 and the CREBBP and SMARCB1 co-activator proteins. a RT-qPCR analysis of CYP26A1 and RARB expression following RA treatment at different time-points in wild-type or BAP1, CREBBP, and SMARCB1 KO cells. n = 2. b Violin plots showing log2 fold-change expression of RA-responsive genes (n = 114 genes, see text for details) in wild-type and BAP1 KO cells. P-value from the Mann–Whitney test is shown. c Violin plots showing log2TPM expression of BAP1- CREBBP-, and SMARCB1-regulated genes in wild-type (WT) or in the respective KO conditions. d Venn diagram showing overlap between genes that are downregulated in BAP1, CREBBP, and SMARCB1 KO cells. e Heatmaps showing ASXL1 and RNA PolII density around the TSS and termination end site (TES) (including 2-kb upstream and downstream) scaled to an equivalent 10 kb in human HEK-293 cells. Corresponding average profiles are plotted above each heatmap. f Scatterplot showing PolII versus ASXL1 enrichment around the TSS (including 2 kb upstream and downstream) at all annotated genes. Pearson correlation coefficient is displayed. g Snapshots of ASXL1 and RNA PolII enrichment at representative regions. The input is displayed below each corresponding ChIP-seq experiment
Fig. 6
Fig. 6
BAP1 function relies on its deubiquitinase activity against H2AK119ub1. a Reintroduction of wild-type or catalytically dead (C91S) BAP1 in BAP1 KO cells. Top panel: western blot analysis of BAP1 expression in cytoplasmic (C) or nuclear (N) fractions. HDAC1 is used as a loading control. Bottom panel: RT-qPCR analysis of three BAP1-regulated genes in wild-type, BAP1 KO and the two rescue conditions. Horizontal bars indicate the mean expression. n = 3. b Western blot analysis of RING1A, RING1B, BAP1, H2AK119ub1, and H3K27me3 in wild-type, RING1A/B double KO, or RING1A/B; BAP1 triple KO HAP1 cells. H4 is used as a loading control. c Venn diagram showing the overlap between genes downregulated in BAP1 KO or upregulated in RING1A/B dKO cells. d Box-plots (median, lower, and upper quartiles, lowest and highest values) of log2 transcript per million (TPM) expression values of BAP1-only-regulated genes (top) and BAP1/PRC1-regulated genes in WT and RING1A/B dKO cells. P-value of the Mann–Whitney test on WT versus RING1A/B dKO comparison is indicated. e Scatterplot showing log2 fold-change (logFC) expression between RING1A/B dKO and RING1A/B; BAP1 tKO cells as a function of average log2 counts per million (logCPM). BAP1, the only differentially expressed genes is highlighted in purple. f RT-qPCR analysis of CYP26A1, RARB, DHRS3, and FAM46A expression following RA treatment at different time-points in wild-type or BAP1, RING1A/B, RING1A/B;BAP1 KO cells
Fig. 7
Fig. 7
Model of BAP1.com function

References

    1. Jensen DE, et al. BAP1: a novel ubiquitin hydrolase which binds to the BRCA1 RING finger and enhances BRCA1-mediated cell growth suppression. Oncogene. 1998;16:1097–112. doi: 10.1038/sj.onc.1201861. - DOI - PubMed
    1. Carbone M, et al. BAP1 and cancer. Nat. Rev. Cancer. 2013;13:153–9. doi: 10.1038/nrc3459. - DOI - PMC - PubMed
    1. Yu H, et al. The ubiquitin carboxyl hydrolase BAP1 forms a ternary complex with YY1 and HCF-1 and is a critical regulator of gene expression. Mol. Cell Biol. 2010;30:5071–85. doi: 10.1128/MCB.00396-10. - DOI - PMC - PubMed
    1. Dey A, et al. Loss of the tumor suppressor BAP1 causes myeloid transformation. Science. 2012;337:1541–6. doi: 10.1126/science.1221711. - DOI - PMC - PubMed
    1. Machida YJ, Machida Y, Vashisht AA, Wohlschlegel JA, Dutta A. The deubiquitinating enzyme BAP1 regulates cell growth via interaction with HCF-1. J. Biol. Chem. 2009;284:34179–88. doi: 10.1074/jbc.M109.046755. - DOI - PMC - PubMed

Publication types

MeSH terms