. 2019 Jan 21;10(1):358.
doi: 10.1038/s41467-018-08147-0.

A GWAS in Latin Americans highlights the convergent evolution of lighter skin pigmentation in Eurasia

Affiliations

A GWAS in Latin Americans highlights the convergent evolution of lighter skin pigmentation in Eurasia

Kaustubh Adhikari et al. Nat Commun. .

Abstract

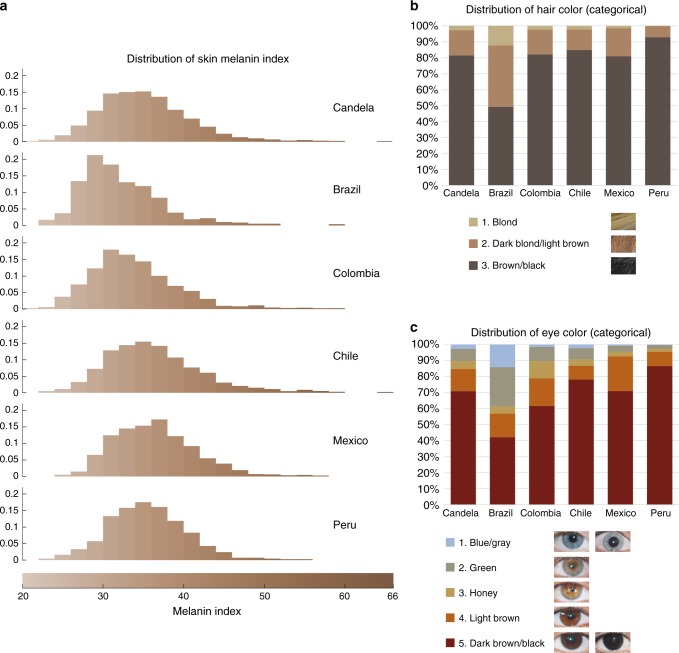
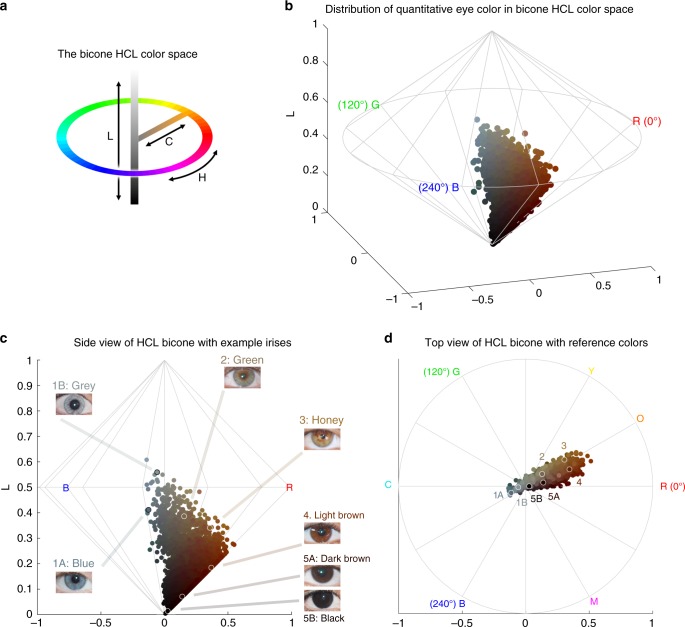
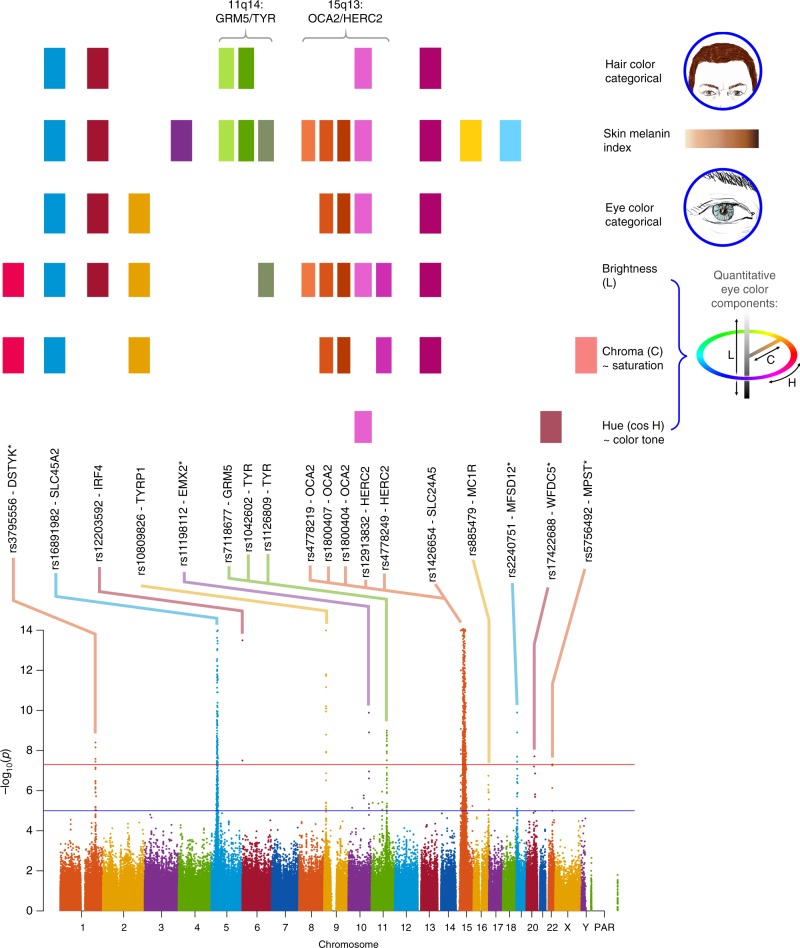
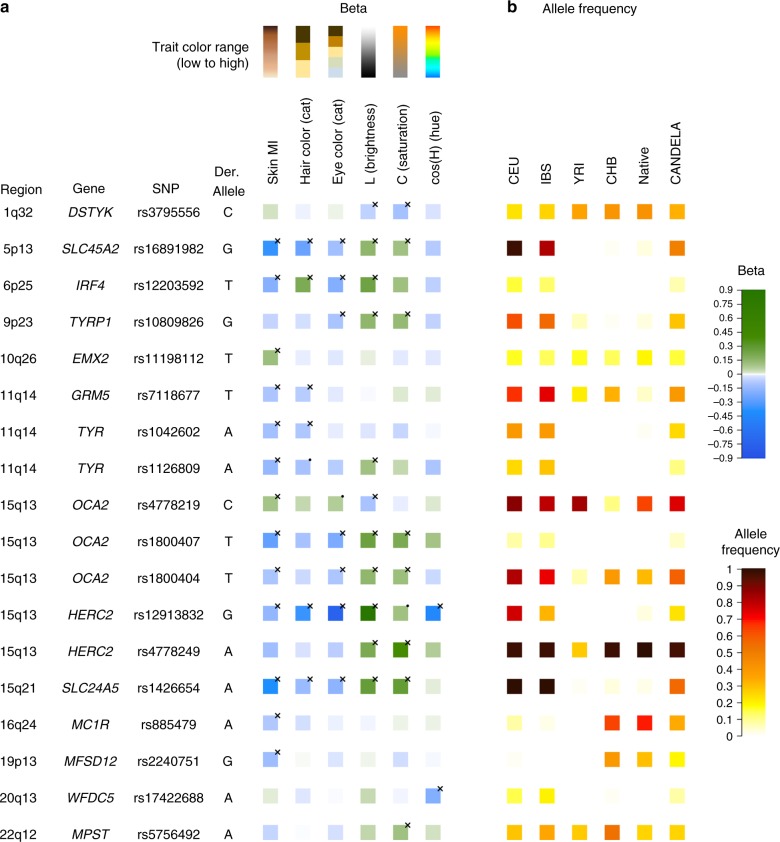
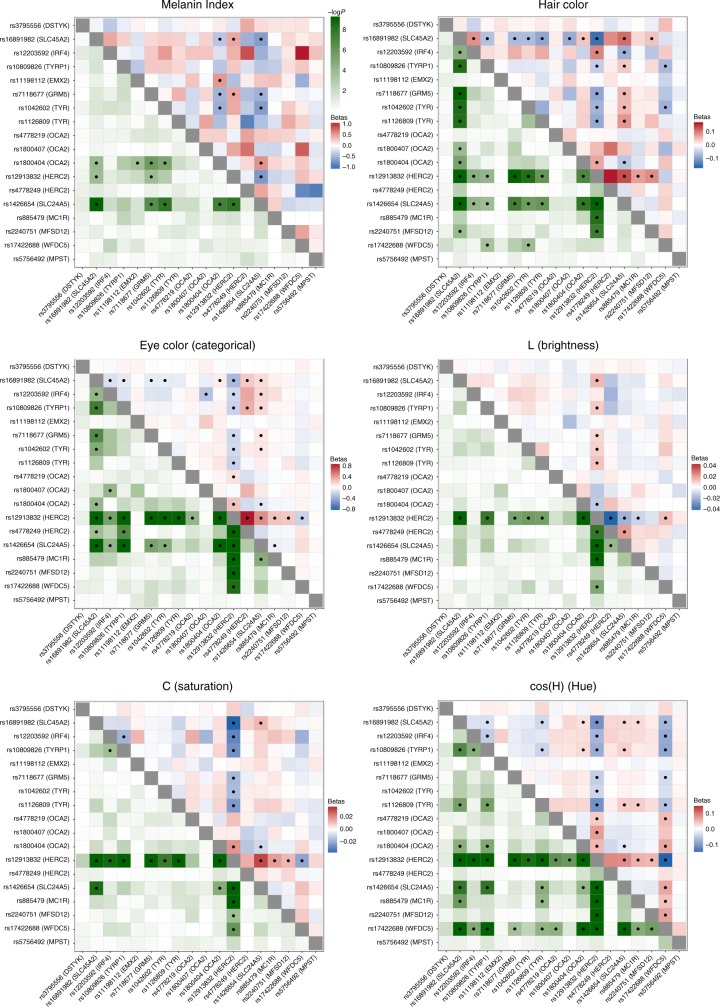
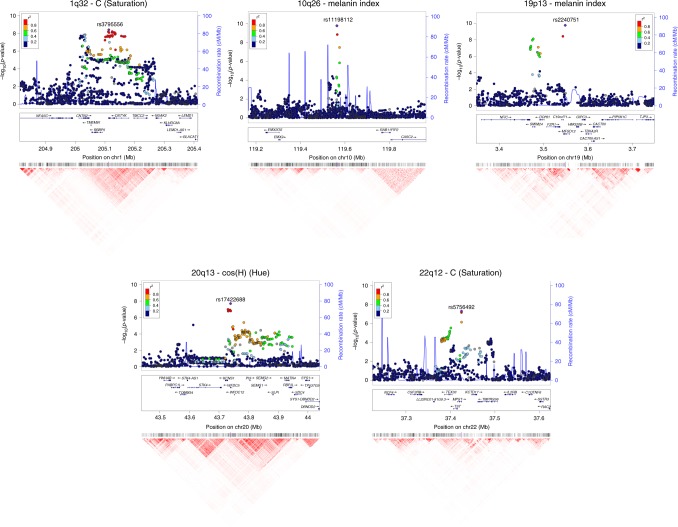
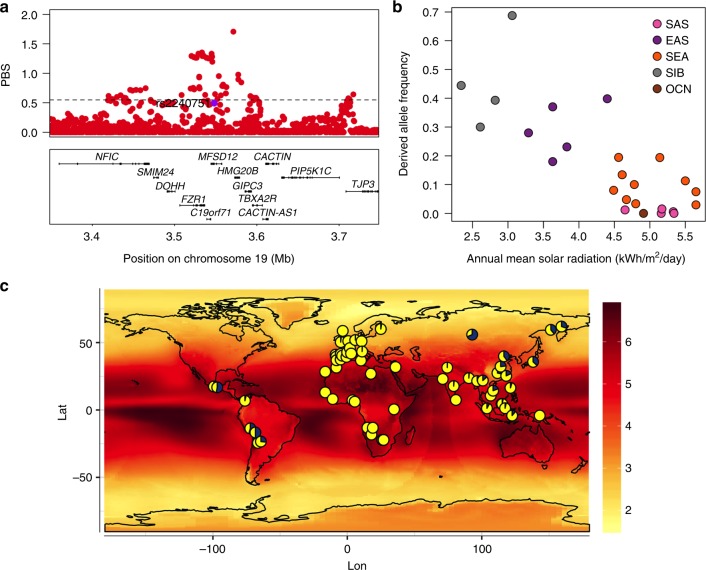
We report a genome-wide association scan in >6,000 Latin Americans for pigmentation of skin and eyes. We found eighteen signals of association at twelve genomic regions. These include one novel locus for skin pigmentation (in 10q26) and three novel loci for eye pigmentation (in 1q32, 20q13 and 22q12). We demonstrate the presence of multiple independent signals of association in the 11q14 and 15q13 regions (comprising the GRM5/TYR and HERC2/OCA2 genes, respectively) and several epistatic interactions among independently associated alleles. Strongest association with skin pigmentation at 19p13 was observed for an Y182H missense variant (common only in East Asians and Native Americans) in MFSD12, a gene recently associated with skin pigmentation in Africans. We show that the frequency of the derived allele at Y182H is significantly correlated with lower solar radiation intensity in East Asia and infer that MFSD12 was under selection in East Asians, probably after their split from Europeans.


Conflict of interest statement

J.C.C.-D. was employed by Living DNA from October 2017 to November 2018. The remaining authors declare no competing interests.

Figures

Fig. 1
Fig. 1
Distribution of skin, hair and eye pigmentation in the CANDELA sample. a Frequency distribution of skin melanin index (MI). Histograms are shown for the full CANDELA sample and for each country sample separately. To facilitate relating MI values to skin color, the MI values (x-axis) were converted to approximate RGB values (scale at the bottom, Supplementary Figure 16). b Stacked bar plots showing the frequency (percent) of the three hair color categories. Bar colors correspond approximately to the sample images for each category shown at the bottom (with the ordinal numbering used in the association analyses shown next to each category). c Stacked bar plots showing the frequency (percent) of eye color categories. Bar colors correspond approximately to the sample images of eyes as shown at the bottom (with the ordinal numbering used in the association analyses shown next to each category). Categories 1 and 5 are composite categories, respectively of blue/gray and dark brown/black and examples of each of the sub-type are shown
Fig. 2
Fig. 2
Quantitative assessment of eye pigmentation in the CANDELA sample. a Three-dimensional distribution of quantitatively assessed iris colors in the bicone HCL (hue, chroma, lightness) color space. Each dot corresponds to a CANDELA individual and its color represents the average iris color for that person. The color space has a polar coordinate system, where the vertical axis represents L (lightness/brightness, from dark = 0 to light = 1), the horizontal distance from the central axis represents C (chroma/saturation, from desaturated = 0 to fully saturated = 1), and H (hue/ tone) represents the angle when a vertical plane is rotated along the central axis (the three primary colors red (R), green (G) and blue (B) being situated at angles of 0°, 120° and 240° respectively). b The full range of the HCL color space, showing how the three color components vary in the space. Hue varies as a color circle, coming back to red at 360°. The unlabeled axes represent the Cartesian equivalents for the C and H variables, which define a polar coordinate system, as shown in panel a. c Side view of the bicone in a showing how the L (lightness/brightness) and C (chroma/saturation) of eye colors vary among CANDELA volunteers. The position of the dots corresponding to the average eye colors of the sample images in Fig. 1c are indicated. d Top view of the bicone in a showing how H varies among the eye colors of CANDELA volunteers. The position of the dots corresponding to the average color of the sample images in Fig. 1c are highlighted by white circles. In addition to the primary RGB colors, the secondary colors orange (O), yellow (Y), cyan (C) and magenta (M) are shown at their corresponding H angles
Fig. 3
Fig. 3
Summary of GWAS findings. Results are presented for six pigmentation traits: skin melanin index (MI, quantitative), categorical hair color, categorical eye color, and three quantitative eye color variables extracted from digital photographs: L (lightness/brightness), C (chroma/saturation) and cos H (cos hue/tone). These traits are represented on the right. The HCL color space with the three axes of variation is shown in the inset. To provide a global summary of the results, a composite Manhattan plot is presented at the bottom combining significant signals for all the traits. Horizontal lines indicate the suggestive (blue line, P value = 1 × 10−5) and significant (red line, P value = 5 × 10−8) thresholds. The y-axis was truncated at –log10(P value) = 14. Index SNPs in each region are listed above the Manhattan plot. The association of these SNPs with specific traits is represented by colored boxes at the top: a box is shown if a SNP is associated with that trait (Table 1). Box colors correspond to colors assigned to each chromosome in the Manhattan plot, with slight variation when multiple independent hits were observed on the same chromosome. Novel genomic regions are marked with an asterisk
Fig. 4
Fig. 4
Phenotypic effects (regression beta-coefficients) and derived allele frequencies for the 18 index SNPs showing independent association in the CANDELA sample (Table 1). In a traits are shown at the top, with illustrative color ranges. Beta-coefficients have been standardized to facilitate comparison across traits. Positive betas are shown in green and negative betas in blue (with color intensity reflecting beta values as indicated on the scale to the right). Significant betas are marked with a cross. In b allele frequencies are shown for the CEU, IBS, CHB and YRI samples from the 1000 Genomes Project Phase 3, the CANDELA sample and Native Americans (from Reich et al. and Chacon-Duque et al.). On the right is shown the color scale used to represent allele frequencies (Supplementary Table 7)
Fig. 5
Fig. 5
Heatmaps of statistical interactions between the 18 index SNPs identified here. Each panel corresponds to a different trait. The lower left triangle represents −log10 P values for the interaction term included in the regression model (with the color scale shown at the top). The upper right triangle represents regression beta-coefficients for each interaction term, colored from blue (negative effect) to white (no effect) to red (positive effect). As the scale for each trait is different, separate scales for effect sizes are shown next to each panel. Interactions that are significant (after Bonferroni correction) are marked with a black dot
Fig. 6
Fig. 6
Regional association (LocusZoom) plots for SNPs in the five genomic regions showing novel genome-wide significant associations to pigmentation traits. Chromosomal location and trait are specified in the title of each panel. In each region, index SNPs (Table 1) are highlighted with a purple diamond. Colors for other SNPs represent the strength of LD between that SNP and the index SNP (in the 1000 Genomes AMR data). Local recombination rate in the AMR data is shown as a continuous blue line (scale on the right y-axis). Genes in each region, their intron–exon structure, direction of transcription and genomic coordinates (in Mb, using the NCBI human genome sequence, Build 37, as reference) are shown in the middle of each panel. At the bottom is shown a pairwise LD heatmap across all SNPs in a region (using r2, ranging from red indicating r2 = 1 to white indicating r2 = 0)
Fig. 7
Fig. 7
Immunohistochemical analysis of MFSD12 protein expression in the epidermis of human scalp. MFSD12 expression (green fluorescence) was detected in multiple skin cell types (a, b). MFSD12 expression levels were higher in melanocytes (identified with an anti-melanocyte antibody in red fluorescence) than in adjacent keratinocytes (green only). Co-localization of both MFSD12 and the melanocyte-specific protein gp100 expression can be seen in yellow/orange fluorescence (arrow). Insets show higher magnification views of arrowed MFSD12-expressing melanocytes in skin epidermis. c A proportion of keratinocytes in scalp hair follicle from the same tissue also expressed MFSD12(green only). By contrast with the skin, MFSD12 expression was not detected in hair melanocytes (i.e., seen as red fluorescence only indicating gp100 protein expression). d Positive control (human kidney). Note MFSD12 expression in kidney tubular cells (arrow). Scale bars: a, b = 50 µM. c = 15 µM, d = 30 µM
Fig. 8
Fig. 8
Evidence for selection in the MFSD12 gene region. a PBS scores in the 1000 Genomes CHB sample for SNPs across the region (index SNP rs2240751 is highlighted in purple and the horizontal black line represents the 99th percentile threshold). b Plot of the derived allele frequency at rs2240751 against mean annual solar radiation in Easter Eurasian populations. Populations are abbreviated as follows: SAS South Asians, EAS East Asians, SEA South East Asians, SIB Siberians, OCN Oceanians. c Allele frequencies at rs2240751 in 64 native populations from across the world mapped onto solar radiation. Pies charts are centered at the approximate geographic location of each population with the derived allele frequency represented in blue. Geographic coordinates, sample size, mean annual solar radiation and the frequency of the derived allele for each population are shown in Supplementary Table 10 and Supplementary Figure 11

References

    1. Norton HL, et al. Genetic evidence for the convergent evolution of light skin in Europeans and East Asians. Mol. Biol. Evol. 2007;24:710–722. doi: 10.1093/molbev/msl203. - DOI - PubMed
    1. Sturm RA. Molecular genetics of human pigmentation diversity. Hum. Mol. Genet. 2009;18:R9–R17. doi: 10.1093/hmg/ddp003. - DOI - PubMed
    1. Liu F, Wen B, Kayser M. Colorful DNA polymorphisms in humans. Semin. Cell Dev. Biol. 2013;24:562–575. doi: 10.1016/j.semcdb.2013.03.013. - DOI - PubMed
    1. Martin AR, et al. An unexpectedly complex architecture for skin pigmentation in Africans. Cell. 2017;171:1340–1353 e14. doi: 10.1016/j.cell.2017.11.015. - DOI - PMC - PubMed
    1. Crawford NG, et al. Loci associated with skin pigmentation identified in African populations. Science. 2017;358:pii: eaan8433. doi: 10.1126/science.aan8433. - DOI - PMC - PubMed

Publication types

MeSH terms