. 2019 Jan 21;10(1):354.
doi: 10.1038/s41467-019-08300-3.

The lineage stability and suppressive program of regulatory T cells require protein O-GlcNAcylation

Affiliations

The lineage stability and suppressive program of regulatory T cells require protein O-GlcNAcylation

Bing Liu et al. Nat Commun. .

Abstract

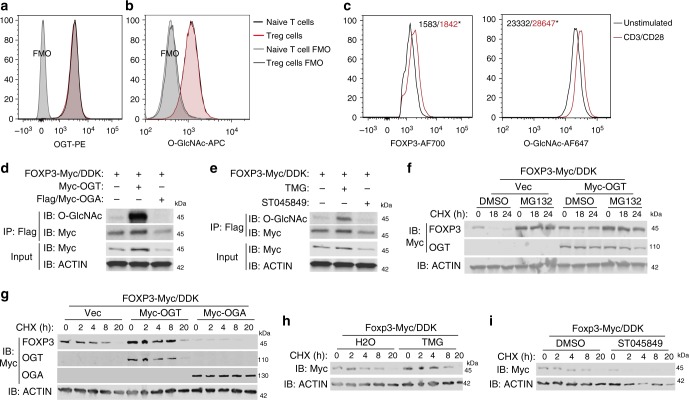
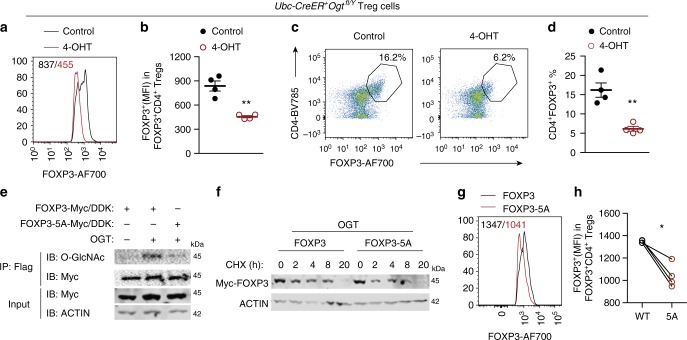
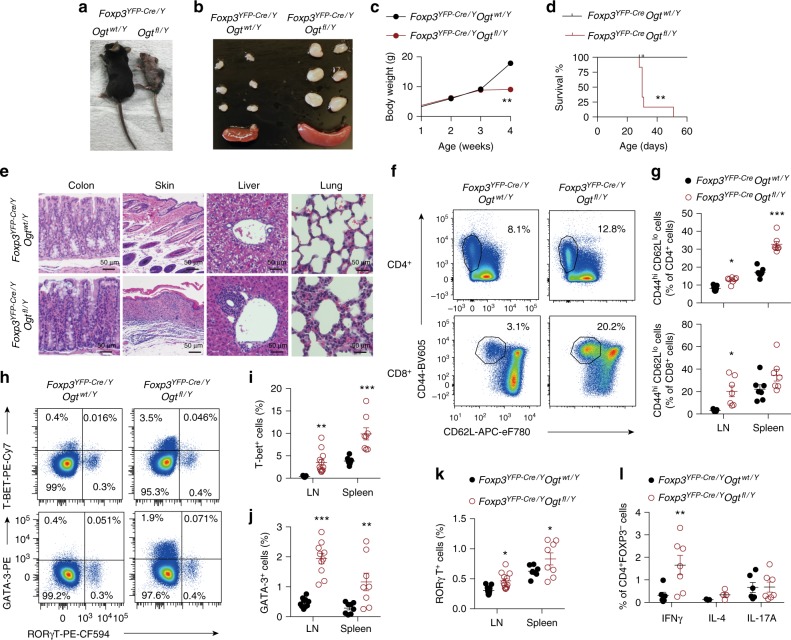
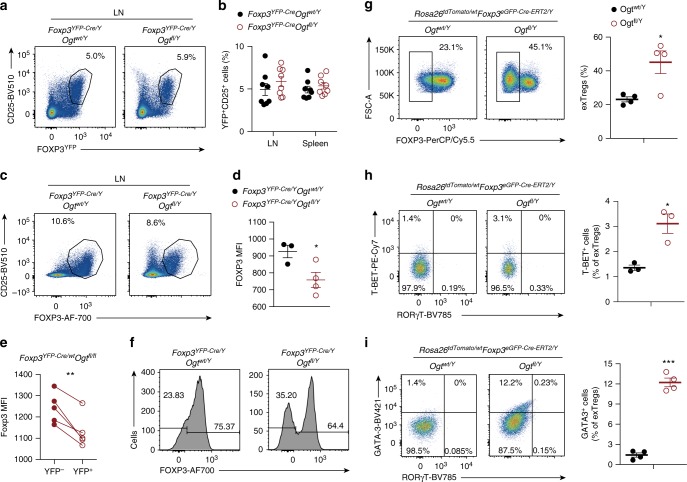
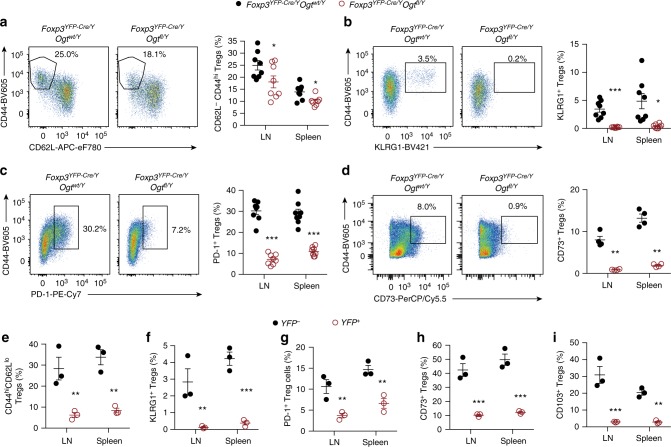
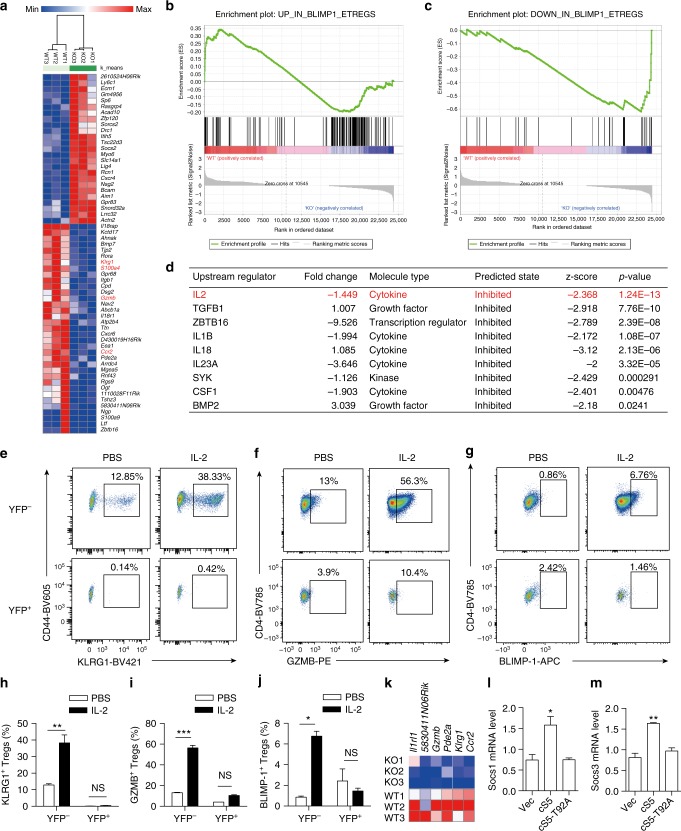
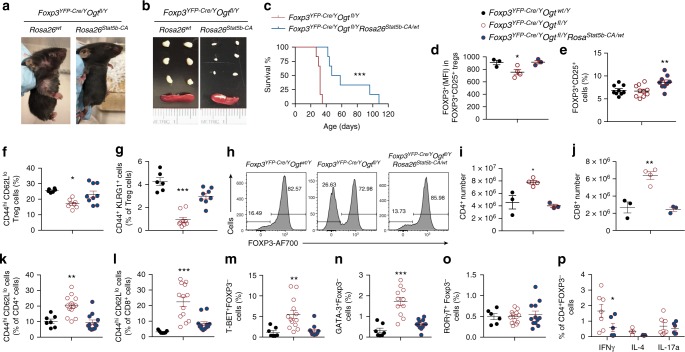
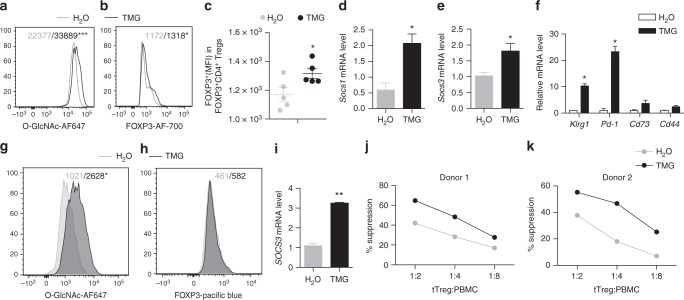
Regulatory T (Treg) cells control self-tolerance, inflammatory responses and tissue homeostasis. In mature Treg cells, continued expression of FOXP3 maintains lineage identity, while T cell receptor (TCR) signaling and interleukin-2 (IL-2)/STAT5 activation support the suppressive effector function of Treg cells, but how these regulators synergize to control Treg cell homeostasis and function remains unclear. Here we show that TCR-activated posttranslational modification by O-linked N-Acetylglucosamine (O-GlcNAc) stabilizes FOXP3 and activates STAT5, thus integrating these critical signaling pathways. O-GlcNAc-deficient Treg cells develop normally but display modestly reduced FOXP3 expression, strongly impaired lineage stability and effector function, and ultimately fatal autoimmunity in mice. Moreover, deficiency in protein O-GlcNAcylation attenuates IL-2/STAT5 signaling, while overexpression of a constitutively active form of STAT5 partially ameliorates Treg cell dysfunction and systemic inflammation in O-GlcNAc deficient mice. Collectively, our data demonstrate that protein O-GlcNAcylation is essential for lineage stability and effector function in Treg cells.


Conflict of interest statement

The authors declare no competing interests.

Figures

Fig. 1
Fig. 1
O-GlcNAc-cycling enzymes regulate FOXP3 stability in vitro. a, b Mean fluorescence intensity (MFI) of OGT (a) and O-GlcNAcylation (b) in CD4+CD25naïve T cells, CD4+CD25+FOXP3+ Treg cells and corresponding Fluorescence Minus One (FMO) negative controls. c Treg cells isolated from wildtype mice were stimulated with or without anti-CD3/CD28 beads for 24 h ex vivo (n = 3). MFI of FOXP3 and O-GlcNAcylation was analyzed in CD4+CD25+ FOXP3+ Treg cells. d, e HEK 293 cells were transfected FOXP3 together with OGT or OGA (d) or treated with inhibitors of OGT (ST045849) or OGA (TMG) (e). FOXP3 O-GlcNAcylation was determined by immunoprecipitation followed by western blotting. f FOXP3 stability was determined by treatment of cycloheximide (CHX) in combination with MG132 with or without OGT overexpression, DMSO was used as a control for MG132. gi FOXP3 stability was determined in the presence of OGT/OGA overexpression (g), TMG (h), or ST045849 (i). Data are shown as mean ± s.e.m. *p < 0.05 by unpaired student’s t-test
Fig. 2
Fig. 2
O-GlcNAcylation stabilizes the FOXP3 protein in Treg cells. ad Treg cells isolated from Ubc-CreER+Ogtfl/Y mice were treated with 4-OHT for 3day ex vivo, ethanol was used as the control, n = 4 each group. MFI of FOXP3 in CD4+FOXP3+ Treg cells was analyzed in a and quantified in b. Representative flow cytometry of CD4+ FOXP3+Treg cells was plotted in c and the frequencies of Treg cells were shown in d. e FOXP3 or FOXP3-5A were transfected in HEK 293 cells with or without OGT. FOXP3 O-GlcNAcylation was determined by immunoprecipitation followed by Western blotting. f FOXP3 and FOXP3-5A stability was determined by treatment of CHX in the presence of OGT overexpression. g, h CD4+CD25 naïve T cells isolated from wildtype mice were infected with retroviruses expressing FOXP3 or FOXP3-5A in the presence of anti-CD3/CD28 beads (n = 4). MFI of FOXP3 was analyzed (g) and quantified (h) in CD4+FOXP3+ Treg cells. Data are shown as mean ± s.e.m. *p < 0.05; **p < 0.01 by unpaired student’s t-test (b, d) and paired student’s t-test (h)
Fig. 3
Fig. 3
OGT-deficiency in Treg cells leads to a scurfy phenotype in male mice. a, b Representative images of 4-week-old Foxp3YFP-Cre/Y Ogtwt/Y and Foxp3YFP-Cre/Y Ogtfl/Y mice (a) and peripheral LNs and spleen (b). c, d Body weight curve (c, n = 5) and survival curve (d, n = 6) of Foxp3YFP-Cre/Y Ogtwt/Y and Foxp3YFP-Cre/Y Ogtfl/Y mice. e Representative images of H&E staining of the colon, skin, liver, and lung from 4-week-old Foxp3YFP-Cre/Y Ogtwt/Y and Foxp3YFP-Cre/Y Ogtfl/Y mice. f, g Representative flow cytometry plots showing CD44hiCD62Llo effector T cells among CD4+ (top) and CD8+ (bottom) T cells in the LNs (f) and quantification of the frequencies in the LNs and spleen of 2-week-old Foxp3YFP-Cre/Y Ogtwt/Y and Foxp3YFP-Cre/Y Ogtfl/Y mice, at least n = 6 each group (g). hk Representative flow cytometry plots showing T-BET+, GATA3+ and RORγT+ cells among CD4+ T cells in the LNs (h) and quantification of the frequencies of T-BET+ cells (i), GATA3+ cells (j) and RORγT+ cells (k) in the LNs and spleen of 2-week-old Foxp3YFP-Cre/Y Ogtwt/Y and Foxp3YFP-Cre/Y Ogtfl/Y mice were shown, n = 8 each group. l Frequencies of IFNγ+, IL-4+ and IL-17A+ cells in CD4+FOXP3- T cells stimulated with PMA/lonomycin in the LNs of 2-week-old Foxp3YFP-Cre/Y Ogtwt/Y and Foxp3YFP-Cre/Y Ogtfl/Y mice, at least n = 3 each group. Data are shown as mean ± s.e.m. *p < 0.05; **p < 0.01; ***p < 0.001 by unpaired student’s t-test (c, g, and il) and Kaplan-Meier Analysis (d)
Fig. 4
Fig. 4
Protein O-GlcNAcylation stabilizes the Treg cell lineage. a, b Flow cytometry of YFP+CD25+ cells among CD4+ T cells in the LNs (a) and frequencies of YFP+CD25+ cells in the LNs and spleen from 2-week-old Foxp3YFP-Cre/Y Ogtwt/Y and Foxp3YFP-Cre/Y Ogtfl/Y mice, n = 8 each group (b). c, d Flow cytometry of FOXP3+CD25+ cells among CD4+ T cells (c) and MFI of FOXP3 in FOXP3+CD25+ Treg cells (d, n = 3–4) in the LNs from 2-week-old Foxp3YFP-Cre/Y Ogtwt/Y and Foxp3YFP-Cre/Y Ogtfl/Y mice. e MFI of FOXP3 in OGT-sufficient and -deficient Treg cells in the LNs from Foxp3YFP-Cre/Y Ogtfl/fl mice, n = 5. f Histogram of FOXP3 expression in CD4+CD25+YFP+ Treg cells in the LNs from 2-week-old Foxp3YFP-Cre/Y Ogtwt/Y and Foxp3YFP-Cre/Y Ogtfl/Y mice, n = 6 each group. g Flow cytometry and quantification of the frequencies of Td-tomato+GITR+FOXP3 ex-Treg cells among CD4+ T cells in the LNs from Foxp3eGFP-Cre-ERT2/Y Ogtwt/Y Rosa26tdTomato/wt and Foxp3 eGFP-Cre-ERT2/Y Ogtfl/Y Rosa26tdTomato/wt mice, n = 4. h, i T-BET+, GATA3+ and RORγT+ cells among ex-Treg cells in the LNs from Foxp3eGFP-Cre-ERT2/Y Ogtwt/Y Rosa26tdTomato/wt and Foxp3 eGFP-Cre-ERT2/Y Ogtfl/Y Rosa26tdTomato/wt mice, n = 3–4. Data are shown as mean ± s.e.m. *p < 0.05; **p < 0.01; ***p < 0.001 by unpaired (b, d, gi) and paired (e) student’s t-test
Fig. 5
Fig. 5
O-GlcNAcylation is required for the effector differentiation of Treg cells. ad Frequencies of CD44hiCD62Llo (a), CD44+KLRG1+ (b), CD44+PD-1+ (c), and CD44+CD73+ (d) cells among YFP+CD25+ Treg cells in the LNs and spleen from 2-week-old Foxp3YFP-Cre/Y Ogtwt/Y and Foxp3YFP-Cre/Y Ogtfl/Y mice, at least n = 4 each group. ei Frequencies of indicated cell populations among YFPOGT-sufficient and YFP+ OGT-deficient CD4+TCRβ+CD25+GITR+ Treg cells in the LNs and spleen from Foxp3YFP-Cre/wt Ogtfl/fl mice, n = 3 each group. Data are shown as mean ± s.e.m. *p < 0.05; **p < 0.01; ***p < 0.001 by unpaired student’s t-test
Fig. 6
Fig. 6
Attenuated IL-2/STAT5 signaling in OGT-deficient Treg cells. a Hierarchical clustering of top differentially expressed genes (60 genes with FDR q values less than 0.1) between OGT-sufficient and OGT-deficient Treg cells using Morpheus. b, c Enrichment plots for up-regulated (b) and down-regulated (c) genes in Blimp1+ eTreg cells from the Gene Set Enrichment Analysis (GSEA) of differentially expressed genes between OGT-sufficient and OGT-deficient Treg cells. d Ingenuity Pathway Analysis (IPA) of predicted upstream regulators for observed changes in gene expression. ej Foxp3YFP-Cre/wt Ogffl/fl female mice were injected with PBS or the IL-2 immune complex (n = 2–5) for 3 consecutive days and Treg cells were analyzed at day 6. Flow cytometry of CD44+KLRG1+(e), CD4+GZMB+ (f) and CD4+BLIMP-1+ (g) Treg cells among YFPOGT-sufficient and YFP+ OGT-deficient Treg cells (CD4+CD25+GITR+) in LNs and spleen and corresponding frequencies in hj. k Expression of STAT5-target genes in OGT-sufficient and OGT-deficient Treg cells. lm mRNA levels of Socs1 (l) and Socs3 (m) in OGT-sufficient Treg cells after retrovirus infection as indicated, n = 3 each group. Data are shown as mean ± s.e.m. *p < 0.05; **p < 0.01; ***p < 0.001 by two-way ANOVA (hj) and one-way ANOVA (l, m)
Fig. 7
Fig. 7
Constitutive activation of STAT5 partially rescues Treg cell dysfunction. a, b Representative images of mice (a) and peripheral LNs and spleen (b) from 2-week-old Foxp3YFP-Cre/Y Ogtfl/Y and Foxp3YFP-Cre/YOgtfl/Y Rosa26Stat5b-CA/wt mice. c Survival curve of Foxp3YFP-Cre/Y Ogtfl/Y and Foxp3YFP-Cre/YOgtfl/Y Rosa26Stat5b-CA/wt mice (n = 6). d MFI of FOXP3 in FOXP3+CD25+ Treg cells in the LNs from 2-week-old Foxp3YFP-Cre/Y Ogtwt/Y, Foxp3YFP-Cre/Y Ogtfl/Y and Foxp3YFP-Cre/YOgtfl/Y Rosa26Stat5b-CA/wt mice, at least n = 3 each group. e Frequencies of FOXP3+CD25+ Treg cells among CD4+ T cells, at least n = 9 each group. fg Frequencies of CD44hiCD62Llo (f) and CD44+KLRG1+ (g) eTreg cells among FOXP3+CD25+ Treg cells in the LNs from 2-week-old Foxp3YFP-Cre/Y Ogtwt/Y, Foxp3YFP-Cre/Y Ogtfl/Y and Foxp3YFP-Cre/YOgtfl/Y Rosa26Stat5b-CA/wt mice, at least n = 6 each group. h Histogram of FOXP3 expression in CD4+CD25+YFP+ Treg cells in the LNs from 2-week-old Foxp3YFP-Cre/Y Ogtwt/Y, Foxp3YFP-Cre/Y Ogtfl/Y and Foxp3YFP-Cre/YOgtfl/Y Rosa26Stat5b-CA/wt mice. i, j Absolute number of CD4+ (i) and CD8+ (j) T cells in the LNs, at least n = 3 each group. k, l Frequencies of CD44hiCD62Llo effector T cells in CD4+ (k) and CD8+ cells (l), at least n = 7 each group. mo Frequencies of T-BET+ (m), GATA3+ (n) and RORγT+ (o) populations among CD4+FOXP3 cells in the LNs, at least n = 6 each group. p Frequencies of INFγ, IL-4 and IL-17A-producing CD4+FOXP3 cells from Foxp3YFP-Cre/Y Ogtfl/Y and Foxp3YFP-Cre/YOgtfl/Y Rosa26Stat5b-CA/wt mice, at least n = 3 each group. Data are shown as mean ± s.e.m. *p < 0.05; **p < 0.01; ***p < 0.001 by Kaplan-Meier Analysis (c), unpaired student’s t-test (p) and one-way ANOVA (dg, io)
Fig. 8
Fig. 8
Activating O-GlcNAcylation promotes Treg cell suppressive function. ac MFI of protein O-GlcNAcylation (a), FOXP3 (b, c) in mouse CD4+FOXP3+ Treg cells treated with TMG, H2O treatment was used as a control (n = 5). d, e mRNA levels of Socs1 (d) and Socs3 (e) in mouse Treg cells treated with TMG, H2O treatment was used as a control (n = 3). f Gene expression in iTreg cells treated with TMG, H2O treatment was used as a control (n = 2). g, h MFI of protein O-GlcNAcylation (g) and FOXP3 (h) in human tTreg cells treated with TMG for 7 days (n = 3), H2O treatment was used as a control. i mRNA levels of SOCS3 in human tTreg cells treated with TMG, H2O treatment was used as a control (n = 3). j, k Suppression activity of human tTreg cells treated with TMG for 7 days, H2O treatment was used as a control. Data are shown as mean ± s.e.m. *p < 0.05 by unpaired student’s t-test

References

    1. Josefowicz SZ, Lu LF, Rudensky AY. Regulatory T cells: mechanisms of differentiation and function. Annu. Rev. Immunol. 2012;30:531–564. doi: 10.1146/annurev.immunol.25.022106.141623. - DOI - PMC - PubMed
    1. Sakaguchi S, Yamaguchi T, Nomura T, Ono M. Regulatory T cells and immune tolerance. Cell. 2008;133:775–787. doi: 10.1016/j.cell.2008.05.009. - DOI - PubMed
    1. Burchill MA, Yang JY, Vogtenhuber C, Blazar BR, Farrar MA. IL-2 receptor beta-dependent STAT5 activation is required for the development of Foxp3(+) regulatory T cells. J. Immunol. 2007;178:280–290. doi: 10.4049/jimmunol.178.1.280. - DOI - PubMed
    1. Burchill MA, et al. Linked T cell receptor and cytokine signaling govern the development of the regulatory T cell repertoire. Immunity. 2008;28:112–121. doi: 10.1016/j.immuni.2007.11.022. - DOI - PMC - PubMed
    1. Lio CW, Hsieh CS. A two-step process for thymic regulatory T cell development. Immunity. 2008;28:100–111. doi: 10.1016/j.immuni.2007.11.021. - DOI - PMC - PubMed

Publication types

MeSH terms