. 2019 Mar;20(3):301-312.
doi: 10.1038/s41590-018-0294-9. Epub 2019 Jan 21.

Memory CD4+ T cells are generated in the human fetal intestine

Affiliations

Memory CD4+ T cells are generated in the human fetal intestine

Na Li et al. Nat Immunol. 2019 Mar.

Abstract

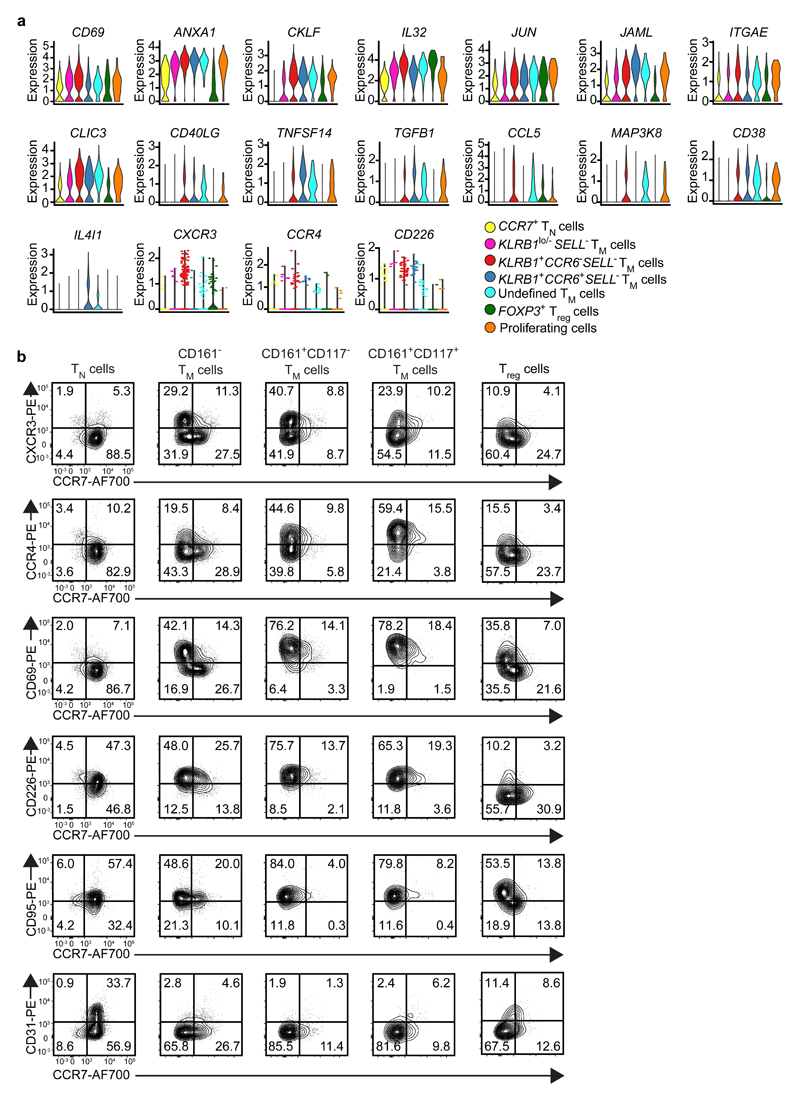
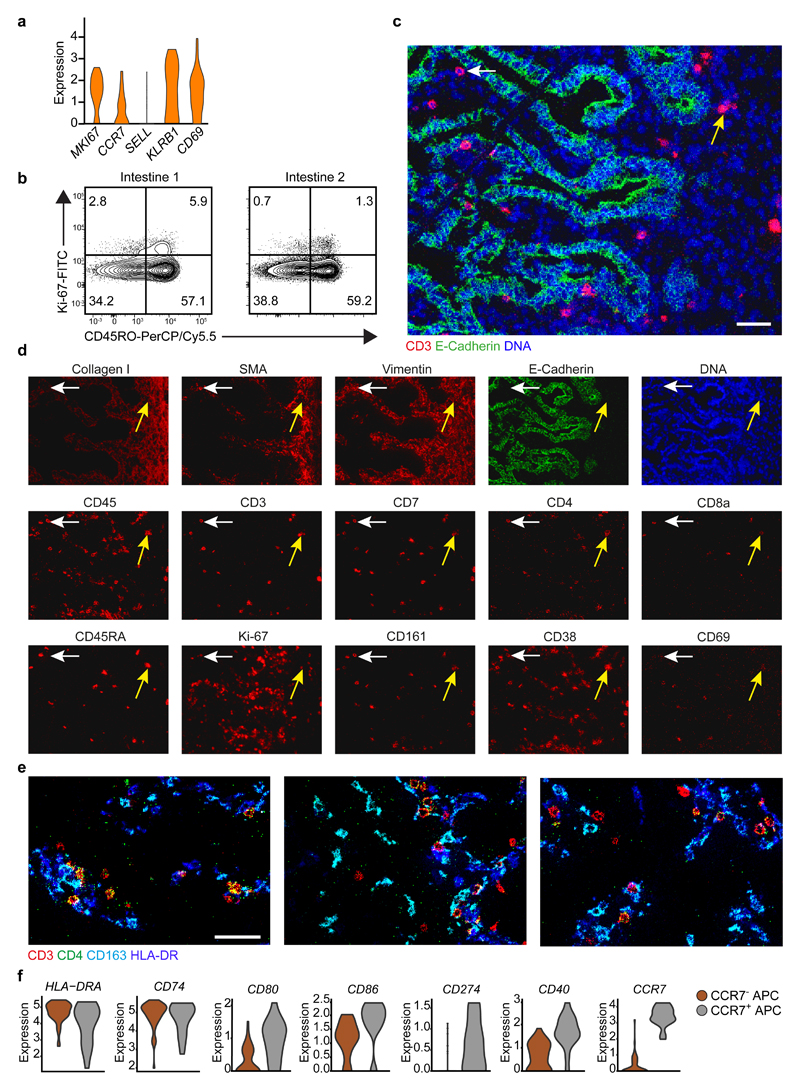
The fetus is thought to be protected from exposure to foreign antigens, yet CD45RO+ T cells reside in the fetal intestine. Here we combined functional assays with mass cytometry, single-cell RNA sequencing and high-throughput T cell antigen receptor (TCR) sequencing to characterize the CD4+ T cell compartment in the human fetal intestine. We identified 22 CD4+ T cell clusters, including naive-like, regulatory-like and memory-like subpopulations, which were confirmed and further characterized at the transcriptional level. Memory-like CD4+ T cells had high expression of Ki-67, indicative of cell division, and CD5, a surrogate marker of TCR avidity, and produced the cytokines IFN-γ and IL-2. Pathway analysis revealed a differentiation trajectory associated with cellular activation and proinflammatory effector functions, and TCR repertoire analysis indicated clonal expansions, distinct repertoire characteristics and interconnections between subpopulations of memory-like CD4+ T cells. Imaging mass cytometry indicated that memory-like CD4+ T cells colocalized with antigen-presenting cells. Collectively, these results provide evidence for the generation of memory-like CD4+ T cells in the human fetal intestine that is consistent with exposure to foreign antigens.


Conflict of interest statement

Competing Interests

The authors declare no competing financial interests.

Figures

Fig. 1
Fig. 1. Mass cytometric analysis of fetal intestinal CD4+ T cells.
a, t-SNE embedding of all CD4+ T cells (n = 110,332) derived from human fetal intestines (n = 7). Colors represent the ArcSinh5-transformed expression values of the indicated markers. b, t-SNE plot depicting the population cell border for TN cells (dashed yellow line), TM cells (dashed red line), and Treg cells (dashed green line). c, Density map describing the local probability density of cells, where black dots indicate the centroids of identified clusters using Gaussian mean-shift clustering. d, t-SNE plot showing cluster partitions in different colors. e, Heatmap showing median expression values and hierarchical clustering of markers for the identified subpopulations. f, Biaxial plots showing CD45RA and CCR7 expression on the indicated clusters analyzed by mass cytometry. The 22 clusters were merged into 6 phenotypic groups according to the heatmap shown in (e). g, Composition of the CD4+ T cell compartment in each fetal intestine represented by vertical bars, where the colored segment lengths represent the proportion of cells as a percentage of all CD4+ T cells in the sample. Colors as shown in (e).
Fig. 2
Fig. 2. Single-cell RNA-sequencing of fetal intestinal CD4+ T cells.
a, t-SNE embedding of fetal intestinal CD4+ T cells (n = 1,804) showing seven transcriptionally distinct clusters, including CCR7+ TN (n = 358), KLRB1lo/–SELL TM (n = 237), KLRB1+CCR6SELL TM (n = 640), KLRB1+CCR6+SELL TM (n = 336), undefined TM (n = 101), FOXP3+ Treg cells (n = 71), and proliferating cells (n =61). Colors indicate different cell clusters. b, Heatmap showing the normalized single-cell gene expression value (Z-Score, purple-to-yellow scale) for the top 20 differentially upregulated genes in each identified cluster. Colors as shown in (a). c–e, Expression of the indicated genes in each identified cluster at (c) the RNA level (log-normalized) and (d,e) the protein level analyzed by (d) mass cytometry (CyTOF, ArcSinh5-transformed) or (e) flow cytometry, presented as violin plots. Dashed lines indicate background levels. Colors as shown in (a).
Fig. 3
Fig. 3. Targeted analysis of memory-like fetal intestinal CD4+ T cells.
a, Expression (log-normalized) of the indicated genes in distinct CD4+ T cell clusters as determined by single-cell RNA-seq analysis, presented as violin plots. Colors indicate different cell clusters. b, Biaxial plots showing expression of CXCR3, CCR4, CD69, CD226, CD95, and CD31 vs. CCR7 on the indicated CD4+ T cell clusters analyzed by flow cytometry. Data represent two to three independent experiments.
Fig. 4
Fig. 4. Single-cell trajectory analysis of fetal intestinal CD4+ T cells.
a–b, t-SNE embeddings of all fetal intestinal CD4+ T cells analyzed by (a) mass cytometry (n = 10,436) and (b) single-cell RNA-seq (n = 1,743) at the onset and at the middle of the t-SNE computation. Colors indicate different cell clusters. c, A single-cell trajectory from the RNA-seq data (excluding Treg cells and proliferating cells) recovered by pseudotime analysis. Colors indicate different cell clusters as shown in (b). Grey arrows indicate three small branches. d, Three kinetic modules of pseudotime-dependent genes (n = 1,376) depicted in a log-variance-stabilized expression heatmap, indicating gene-enriched biological processes. Genes confirmed by mass cytometry and flow cytometry are denoted by black labels, and genes involved in TCR signalling are denoted by gray labels. The dashed grey box indicates the coordinated expression profile of TNF, FASL, and FYN. Euclidean distance values comparing gene expression profiles for each ordered pair of neighboring cells along the pseudotime trajectory are shown in the graph (right).
Fig. 5
Fig. 5. CD5 expression analysis and high-throughput TCR-sequencing of fetal intestinal CD4+ T cells.
a–b, CD5 expression on the indicated CD4+ T cell clusters. (a) The biaxial plots depict one representative experiment, and (b) the bar graphs depict the median fluorescence intensity (MFI) of CD5 expression for each cluster relative to the corresponding CD161+CD117 TM subpopulation in each fetal intestine (n = 7). Data represent six independent experiments. Error bars indicate mean ± SEM. *p < 0.05, Two-tailed Wilcoxon matched-pairs signed-ranks test. c, Expression (log-normalized) of CD5 gene transcripts in the indicated cell clusters, presented as violin plots. d, Dot plots showing the percentage of TCR cDNA molecules per unique TCRβ sequence in each cluster from each fetal intestine. Data are from two independent samples. A single duplicate is shown for samples with technical replicates. e, Dot plots showing the normalized Shannon-Wiener index for TCRα (TRA) and TCRβ (TRB) sequences in each cluster from each fetal intestine. Data are from two independent samples. f, Dot plots showing averaged TCR repertoire characteristics weighted per clonotype for each cluster. Data are from two independent samples. g, Dendrogram showing weighted clonal overlaps for TCRβ nucleotide sequences among clusters, analyzed using the F2 similarity metric in VDJtools. Colors indicate different fetal intestines.
Fig. 6
Fig. 6. Functional profiling of fetal intestinal CD4+ T cells.
a–b, Purified fetal intestinal CD4+ T cells were treated with a control antibody or stimulated with anti-CD3 and anti-CD28 for 4 h. Intracellular expression of TNF, IL-2, IFN-γ, IL-4, granzyme B, and CD154 was determined for each subpopulation by flow cytometry. (a) The biaxial plots show data from one representative experiment after stimulation with anti-CD3 and anti-CD28, and (b) the bar charts show data for each subpopulation from each fetal intestine (TNF: n = 4 samples in two independent experiments; IL-2 and granzyme B: n = 3 samples in two independent experiments; IFN-γ, IL-4 and CD154: n = 7 samples in four independent experiments). Error bars indicate mean ± SEM. *p < 0.05, **p <0.01, Kruskal-Wallis test with Dunn’s test for multiple comparisons.
Fig. 7
Fig. 7. Characterization and spatial localization of fetal intestinal CD4+ T cells and APCs.
a, Expression (log-normalized) of the indicated genes in proliferating fetal intestinal CD4+ T cells, presented as violin plot. b, Biaxial plots showing expression of Ki-67 vs. CD45RO in the fetal intestinal CD4+ T cell compartment analyzed by flow cytometry. Data represent two independent experiments. c, Representative mass cytometry image of a fetal intestine showing the overlay of CD3 (red), Ecadherin (green), and DNA (blue). Scale bar, 100 μm. d, Representative mass cytometry images of fetal intestines showing expression of the indicated stromal markers, immune markers, Ki-67 and DNA by the cells identified in (c). Yellow arrows: CD4+CD45RA+ TN cells; white arrows: CD4+CD45RA TM cells. e, Representative mass cytometry images of a fetal intestine showing the overlay of CD3 (red), CD4(green), CD163 (cyan), and HLA-DR (blue). Scale bar, 50 μm. Colors and scale bars are similar in all three panels. Data in (b-d) represent four independent samples in four independent experiments. f, Expression (log-normalized) of the indicated genes in two clusters of APCs, presented as violin plots. CCR7 APCs (n = 49), CCR7+ APCs (n = 17).

Comment in

  • Pre-birth memory.
    Lim AI, Harrison OJ, Belkaid Y. Lim AI, et al. Nat Immunol. 2019 Mar;20(3):254-256. doi: 10.1038/s41590-019-0326-0. Nat Immunol. 2019. PMID: 30742077 No abstract available.

References

    1. Janeway CA., Jr Approaching the asymptote? Evolution and revolution in immunology. Cold Spring Harb Symp Quant Biol. 1989;54(Pt 1):1–13. - PubMed
    1. Fan X, Rudensky AY. Hallmarks of Tissue-Resident Lymphocytes. Cell. 2016;164:1198–1211. - PMC - PubMed
    1. Thome JJC, et al. Early-life compartmentalization of human T cell differentiation and regulatory function in mucosal and lymphoid tissues. Nat Med. 2015;22:72–77. - PMC - PubMed
    1. Bunders MJ, et al. Memory CD4(+)CCR5(+) T cells are abundantly present in the gut of newborn infants to facilitate mother-to-child transmission of HIV-1. Blood. 2012;120:4383–4390. - PubMed
    1. Zhang X, et al. CD4 T cells with effector memory phenotype and function develop in the sterile environment of the fetus. Sci Transl Med. 2014;6:238ra72. - PubMed

Publication types

MeSH terms