. 2019 Feb;566(7744):393-397.
doi: 10.1038/s41586-019-0879-y. Epub 2019 Jan 21.

Commonality despite exceptional diversity in the baseline human antibody repertoire

Affiliations

Commonality despite exceptional diversity in the baseline human antibody repertoire

Bryan Briney et al. Nature. 2019 Feb.

Abstract

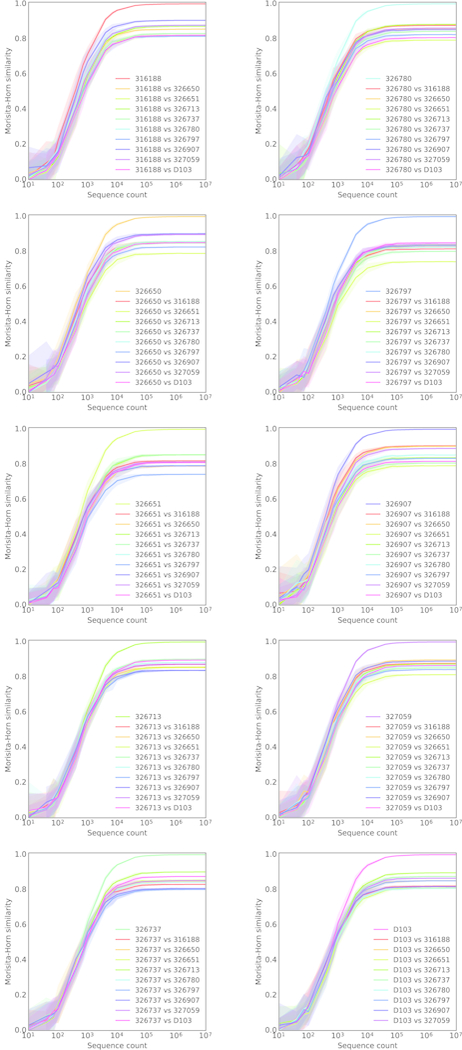
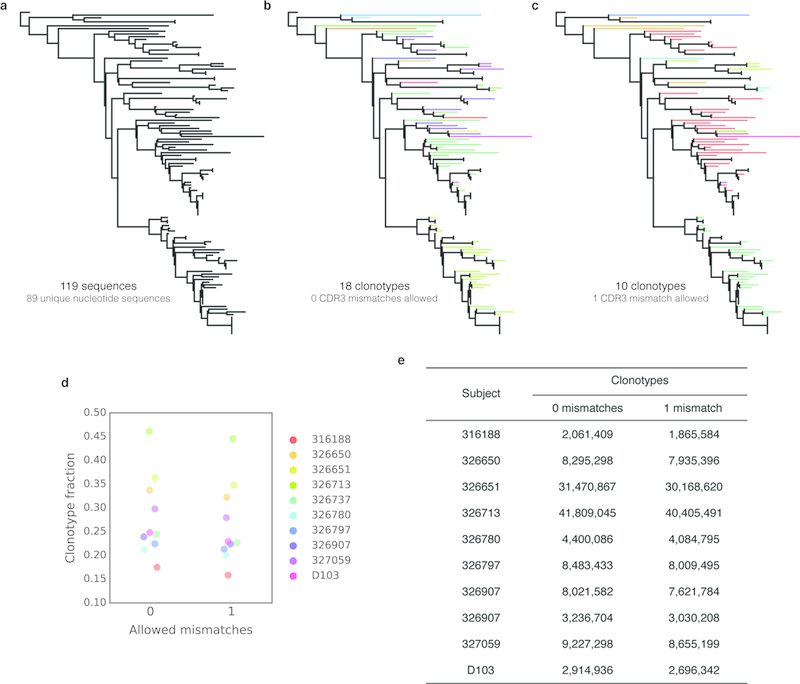
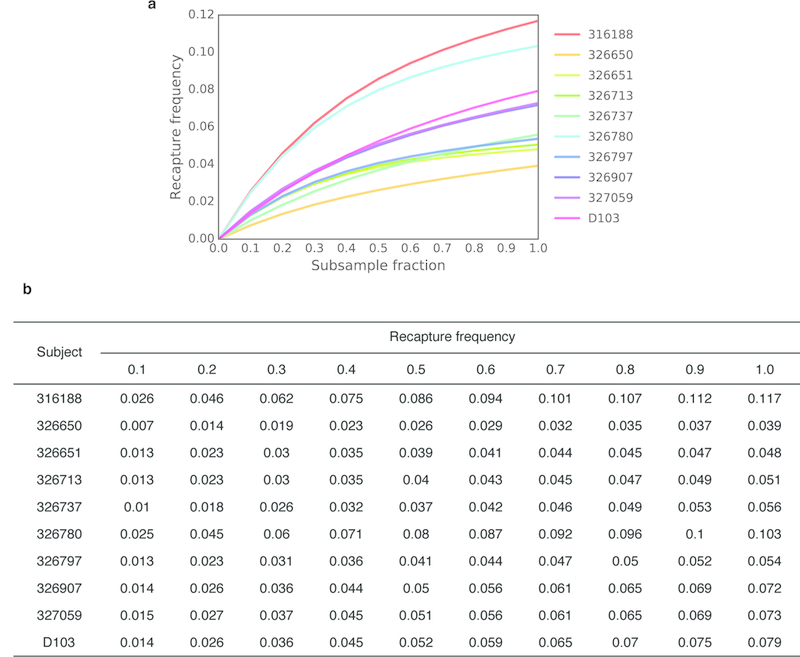
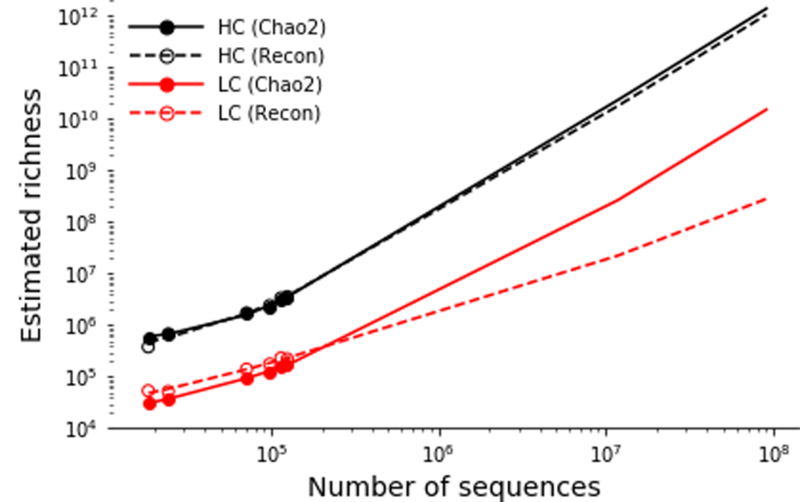
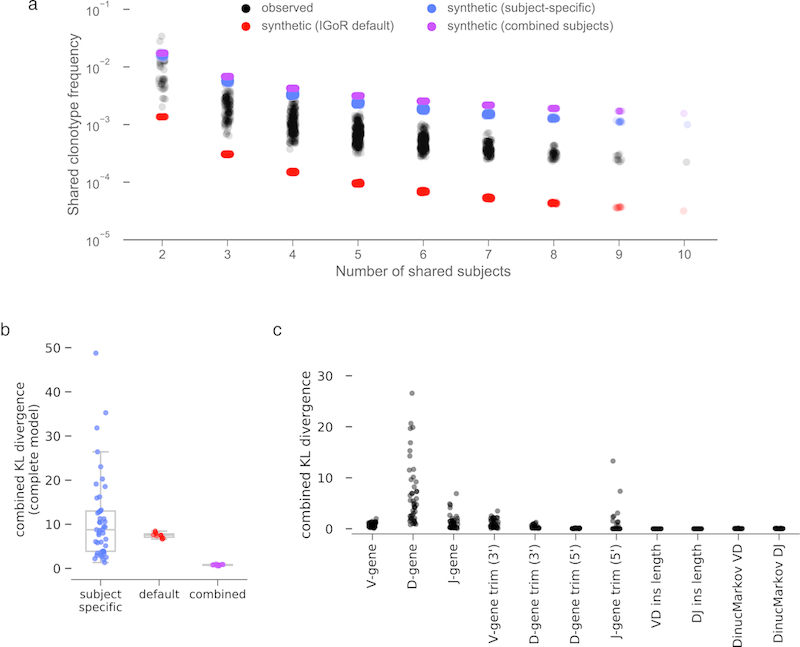
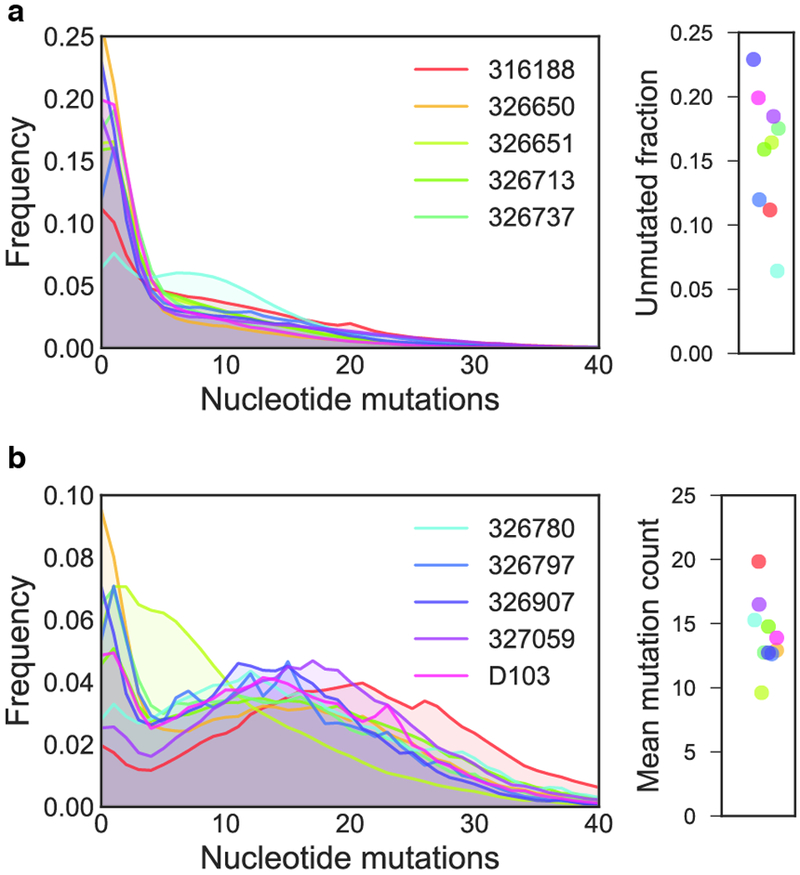
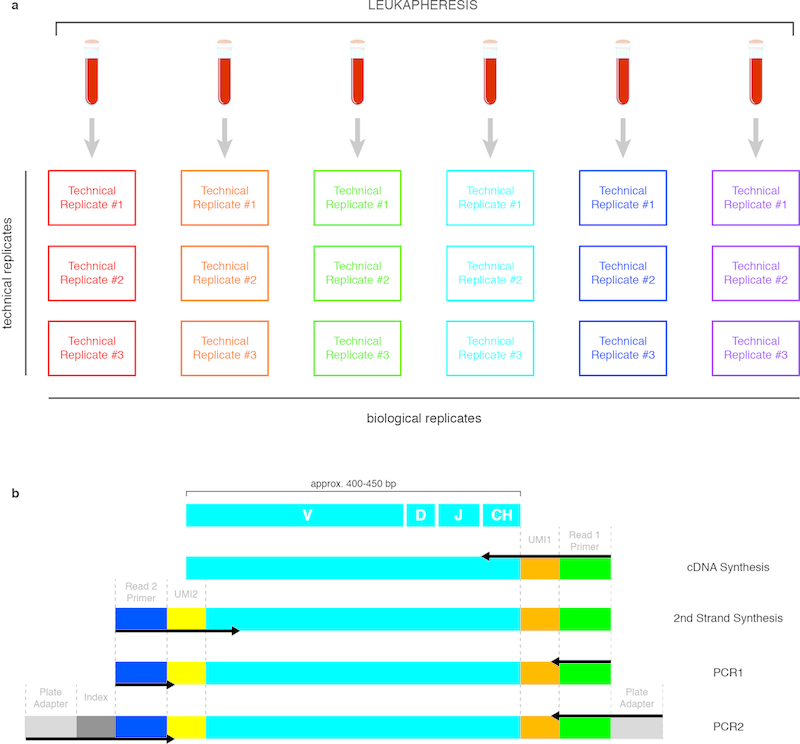
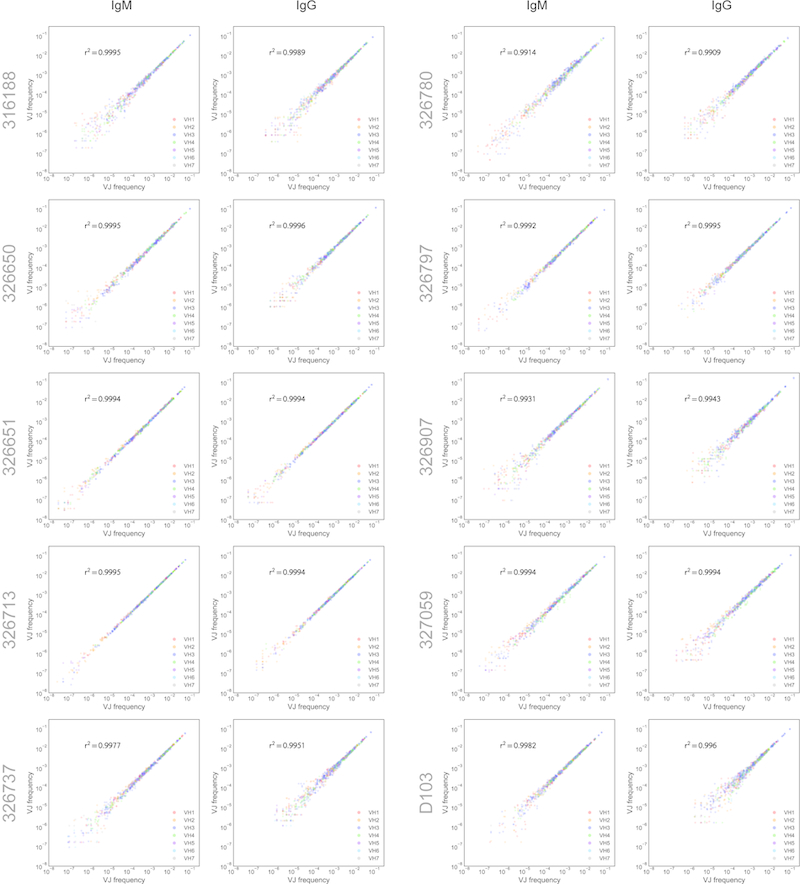
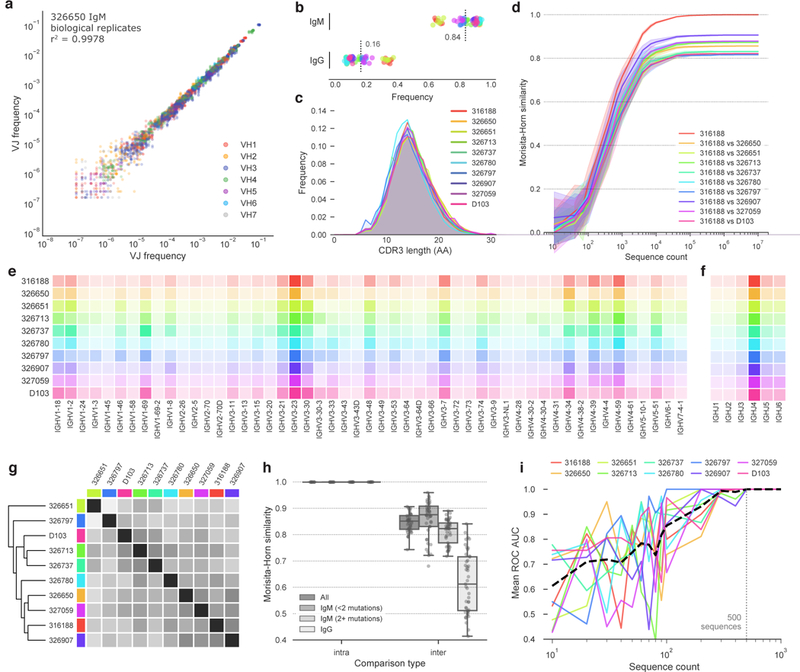
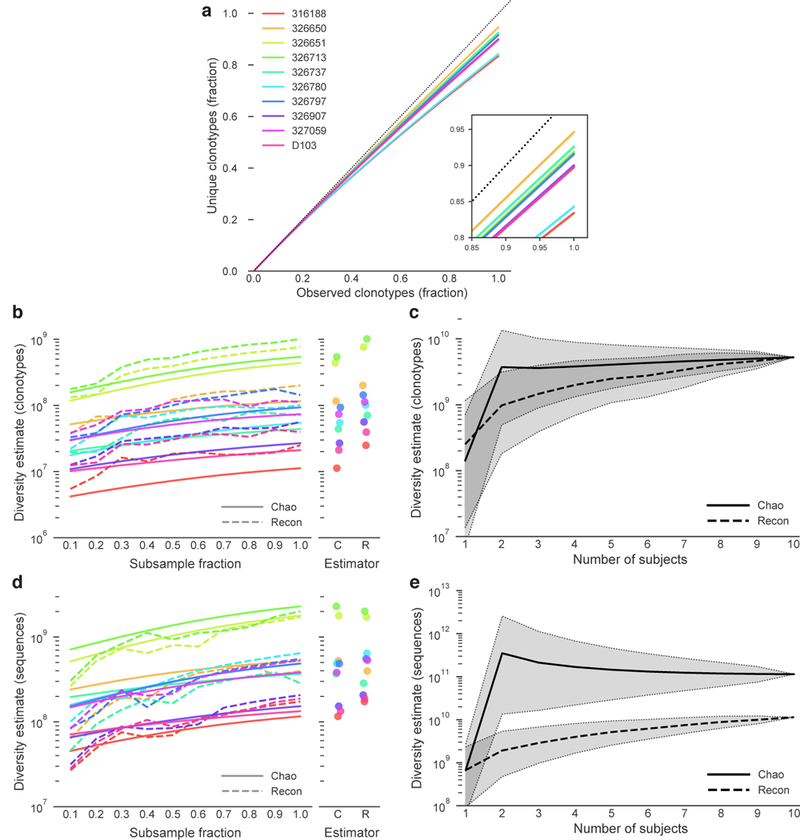
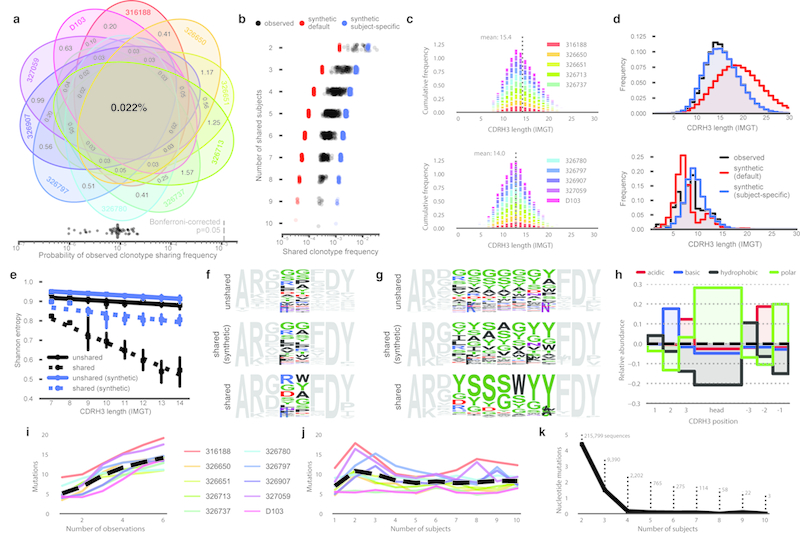
In principle, humans can produce an antibody response to any non-self-antigen molecule in the appropriate context. This flexibility is achieved by the presence of a large repertoire of naive antibodies, the diversity of which is expanded by somatic hypermutation following antigen exposure1. The diversity of the naive antibody repertoire in humans is estimated to be at least 1012 unique antibodies2. Because the number of peripheral blood B cells in a healthy adult human is on the order of 5 × 10⁹, the circulating B cell population samples only a small fraction of this diversity. Full-scale analyses of human antibody repertoires have been prohibitively difficult, primarily owing to their massive size. The amount of information encoded by all of the rearranged antibody and T cell receptor genes in one person-the 'genome' of the adaptive immune system-exceeds the size of the human genome by more than four orders of magnitude. Furthermore, because much of the B lymphocyte population is localized in organs or tissues that cannot be comprehensively sampled from living subjects, human repertoire studies have focused on circulating B cells3. Here we examine the circulating B cell populations of ten human subjects and present what is, to our knowledge, the largest single collection of adaptive immune receptor sequences described to date, comprising almost 3 billion antibody heavy-chain sequences. This dataset enables genetic study of the baseline human antibody repertoire at an unprecedented depth and granularity, which reveals largely unique repertoires for each individual studied, a subpopulation of universally shared antibody clonotypes, and an exceptional overall diversity of the antibody repertoire.


Conflict of interest statement

The authors declare no competing financial interests.

Figures

Extended Data Figure 1.
Extended Data Figure 1.. Nearly full-length antibody gene amplification from biological and technical replicate samples.
a) Schematic of biological and technical replicate samples. Biological replicates (columns) are derived from distinct cell aliquots, so identical clonotypes or sequences found in multiple biological replicates must arise from different cells. Technical replicates (rows) were amplified using discrete RNA aliquots from a single cell aliquot. b) Strategy for nearly full-length antibody heavy chains. Black arrows indicate primers. Primers in the cDNA synthesis step anneal to the heavy chain constant region (CH) and add the first unique molecular identifier (UMI) and the Illumina read 1 primer annealing site. Primers in the 2nd strand synthesis step anneal to the framework 1 (FR1) region of the variable gene and add a second UMI and the Illumina read 2 primer annealing site.
Extended Data Figure 2.
Extended Data Figure 2.. V/J frequency correlations of technical and biological replicates.
For each subject, the frequency of V/J combinations was compared for technical replicates (left panels) or biological replicates (right panels). The coefficient of determination (r) is shown for each plot.
Extended Data Figure 3.
Extended Data Figure 3.. Nucleotide mutation frequencies.
a) The distribution of nucleotide mutations in sequences encoding IgM are shown. On the right, the number of unmutated sequences containing no mutations in the variable gene segment is also plotted. b) The distribution of nucleotide mutations in sequences encoding IgG are shown. On the right, the mean mutation frequency for the IgG population of each subject is shown. Each line represents a single subject. For legibility, the legend is split between the two plots. Although only five subjects are shown in the legend of each plot, data from all ten subjects is present in each plot.
Extended Data Figure 4.
Extended Data Figure 4.. Cross-subject repertoire similarity.
Pairwise Morisita-Horn similarity comparisons between each subject and all other subjects. Similarity was computed using the frequency of V-gene, J-gene and CDRH3 length combinations. Each line represents the mean of 20 independent repertoire samplings (with replacement). The shading surrounding the mean line indicates the 95% confidence interval.
Extended Data Figure 5.
Extended Data Figure 5.. Collapsing sequences into clonotypes.
a) To demonstrate the effect of collapsing an expanded clonal lineage into clonotypes, we selected a previously reported lineage of Zika-specific monoclonal antibodies isolated from the plasmablast population of an acutely infected patient. Of 119 sequences, 89 were unique at the nucleotide level. b) Sequences encoding the same V-gene, J-gene and an identical CDRH3 amino acid sequence were collapsed into clonotypes, and the sequence phylogeny was colored by clonotype. 119 total sequences were collapsed into 18 clonotypes. c) Sequences were collapsed into clonotypes, allowing a single mismatch in the CDRH3 amino acid sequence, and the sequence phylogeny was colored by clonotype. 119 total sequences were collapsed into 10 clonotypes. d) The clonotype fraction (number of clonotypes divided by the total number of filtered sequences) when collapsing clonotypes while allowing zero or one mismatch in the CDRH3 amino acid sequence for each subject in this study. e) Number of total clonotypes recovered when allowing zero or one mismatch in the CDRH3 amino acid sequence for each subject in this study.
Extended Data Figure 6.
Extended Data Figure 6.. Capture-recapture frequency.
a) Recapture frequency for each subject. Lines represent the mean of 10 random samplings (without replacement) for all subsample fractions except compete sampling (1.0). b) Mean recapture frequency for each subsample fraction.
Extended Data Figure 7.
Extended Data Figure 7.. Relative light chain diversity estimation.
Using previously reported datasets of paired heavy and light antibody chains, clonotype diversity was estimated for heavy and light chains using both Chao2 and Recon estimators. Estimates are shown in filled or unfilled points. Lines indicate the least squares polynomial best fit (degree=2) and is extrapolated to include both the lowest (1.17×10⁸) and highest (9.06×10⁸) number of UMI-corrected sequences from the 10 sequenced subjects.
Extended Data Figure 8.
Extended Data Figure 8.. Variance between inferred V(D)J recombination models.
a) Frequency of clonotype sharing between observed human subjects (black), synthetic datasets generated with IGoR’s default recombination model (red), synthetic datasets generated with subject-specific recombination models (blue) or synthetic datasets generated with a combined subjects recombination model (purple). b) Combined Kullback-Leibler divergence (KL divergence) between pairs of subject-specific models (blue), between subject-specific models and IGoR’s default model (red), or between subject-specific models and the combined-subject model (purple). c) Combined KL divergence between pairs of subject-specific models, separated by “event” type.
Figure 1.
Figure 1.. Uniqueness of the repertoires of individual subjects.
a) Frequency comparison of V/J combinations in biological replicates from subject 326650. V/J combinations are colored according to the V-gene used. b) Sequence frequency by antibody isotype. Subjects are colored as in (c). Each point represents a single biological replicate. Mean of all samples is indicated for each isotype. c) CDRH3 length distribution for each subject. CDRH3 lengths were determined using the IMGT numbering scheme. d) Morisita-Horn similarity of pairwise comparisons between subject 316188 and each of the other subjects. Lines indicate mean similarity of 20 bootstrap samplings and shaded areas indicate 95% confidence intervals. Data from subject 316188 is representative; plots for all other subjects can be found in Figure ED4. V-gene (e) and J-gene (f) use by subject. Increased color intensity indicates higher frequency. Subjects are colored as in (c). g) Clustered distance matrix of subjects, using pairwise VJ-CDR3len Morisita-Horn similarity as the distance measure. Distance matrix was computed using single-linkage clustering (Euclidean distance metric). Subject colors are as in (c). A dendrogram representation of the distance matrix is also shown on the left side of the distance matrix. h) Comparison of intra- and inter-subject VJ-CDR3len similarity, using either all sequences, IgM sequences with fewer than two nucleotide mutations, IgM sequences with two or more mutations, or IgG sequences. Points represent individual intra- or inter-subject comparisons. Boxplots show the median line and span the 25th-75th percentile, with whiskers indicating the 95% confidence interval. i) Mean receiver operating characteristic (ROC) area under the curve (AUC) for a one-versus-rest SVM classifier. The ROC AUC does not drop below 1.0 for any subject when the test/training datasets include ≥500 sequences each, and that threshold is indicated with a dashed vertical line.
Figure 2.
Figure 2.. Clonotype and sequence diversity amongst the 10 subjects.
a) Clonotype rarefaction curves for each subject. Lines represent the mean of 10 independent samplings, with the exception of the 1.0 fraction, which was sampled once. The dashed line represents a perfectly diverse sample. Inset is a close-up of the rarefaction curve ends. b) Total clonotype repertoire diversity estimates were computed for increasingly large fractions of each subject’s clonotype repertoire. Each line represents the mean of 10 random sub-samplings without replacement (again, except for the 1.0 fraction). Chao estimates are shown in solid lines, Recon estimates are shown in dashed lines. Subject colors are as in (a). Maximum diversity (1.0 fraction of each subject) for each estimator is shown in the right panel. c) Overall cross-subject clonotype diversity of each possible combination of 1 or more subjects. The Chao estimate is a solid line and the Recon estimate is a dashed line. Shaded regions indicate 95% confidence intervals. The confidence intervals in (c) are for different groupings of subjects, not for the estimators themselves. d) Total sequence repertoire diversity estimates were computed for increasingly large fractions of each subject’s sequence repertoire. Each line represents the mean of 10 random sub-samplings without replacement (except for the 1.0 fraction, for which only a single calculation was made). Chao estimates are shown in solid lines, Recon estimates are shown in dashed lines. Subject colors are as in (a). Maximum diversity (1.0 fraction of each subject repertoire) for each estimator is shown in the right panel. e) Overall cross-subject nucleotide sequence diversity of each possible combination of 1 or more subjects. The Chao estimate is a solid line and the Recon estimate is a dashed line. Shaded regions indicate 95% confidence intervals. Confidence intervals are as in (c).
Figure 3.
Figure 3.. Shared clonotypes and sequences amongst the 10 subjects.
a) Venn diagram of shared clonotype frequency. b) Shared clonotype frequency between subject groups. Points represent different group combinations. Observed sequences (black), synthetic sequences generated with IGoR’s default model (red), and sequences generated with subject-specific models (blue) are shown. c) CDRH3 length distribution of clonotypes found in one biological replicate (top) or all six biological replicates (bottom). CDRH3 length is defined using IMGT numbering. The legend was split maintain legibility; data for all subjects is present in both plots. d) CDRH3 length distribution of unshared clonotypes (top) or clonotypes shared by the majority of subjects (bottom). Observed sequences (black), default model (red) and subject-specific model (blue) synthetic sequences are shown. e) Per-position Shannon entropy of the CDRH3 head regions of unshared (solid) or majority-shared (dashed) clonotypes. Points indicate the mean, whiskers indicate the 95% confidence interval, and lines represent the linear best fit. f-g) Sequence logos of the CDRH3s encoded by observed unshared clonotypes, observed majority-shared clonotypes, and synthetic majority-shared clonotypes of length 8 (f) or 13 (g). Head region amino acid coloring: polar amino acids (GSTYCQN) are green, basic (KRH) blue, acidic (DE) red, and hydrophobic (AVLIPWFM) black. All torso residues are grey. h) Relative abundance of amino acid properties in the CDRH3s of majority-shared clonotypes. Abundances are normalized to the frequency in unshared clonotypes. i) Nucleotide mutations for singly observed or repeatedly observed clonotypes. Colored lines indicate the mean for each subject, the dashed black line indicates the mean of all subjects. j) Nucleotide mutations for shared or unshared clonotypes. Colored lines indicate the mean for each subject, the dashed black line indicates the mean of all subjects. k) Mutation frequency of nucleotide sequences shared by two or more subjects. Points indicate mean mutation frequency. The number of unique nucleotide sequences in each shared group is shown.

References

    1. Rajewsky K Clonal selection and learning in the antibody system. Nature 381, 751–758 (1996). - PubMed
    1. Alberts B et al. The Generation of Antibody Diversity. (Garland Science, 2002).
    1. Boyd SD & Crowe JE Jr. Deep sequencing and human antibody repertoire analysis. Curr. Opin. Immunol. 40, 103–109 (2016). - PMC - PubMed
    1. Briney B & Burton D Massively scalable genetic analysis of antibody repertoires. bioRxiv 447813 (2018). doi:10.1101/447813 - DOI
    1. Briney B, Le K, Zhu J & Burton DR Clonify: unseeded antibody lineage assignment from next-generation sequencing data. Sci. Rep. 6, 23901 (2016). - PMC - PubMed

EXTENDED DATA REFERENCES

    1. van Dongen JJM et al. Design and standardization of PCR primers and protocols for detection of clonal immunoglobulin and T-cell receptor gene recombinations in suspect lymphoproliferations: report of the BIOMED-2 Concerted Action BMH4-CT98–3936. Leukemia 17, 2257–2317 (2003). - PubMed
    1. Masella AP, Bartram AK, Truszkowski JM, Brown DG & Neufeld JD PANDAseq: paired-end assembler for illumina sequences. BMC Bioinformatics 13, 31 (2012). - PMC - PubMed
    1. Meyerhans A, Vartanian JP & Wain-Hobson S DNA recombination during PCR. Nucleic Acids Res. 18, 1687–1691 (1990). - PMC - PubMed
    1. Martin M Cutadapt removes adapter sequences from high-throughput sequencing reads. EMBnet.journal 17, 10–12 (2011).
    1. DeKosky BJ et al. In-depth determination and analysis of the human paired heavy- and light-chain antibody repertoire. Nat. Med. 21, nm3743 (2014). - PubMed

Publication types