. 2019 Feb;21(2):238-250.
doi: 10.1038/s41556-018-0267-0. Epub 2019 Jan 21.

Targeting the perivascular niche sensitizes disseminated tumour cells to chemotherapy

Affiliations

Targeting the perivascular niche sensitizes disseminated tumour cells to chemotherapy

Patrick Carlson et al. Nat Cell Biol. 2019 Feb.

Abstract

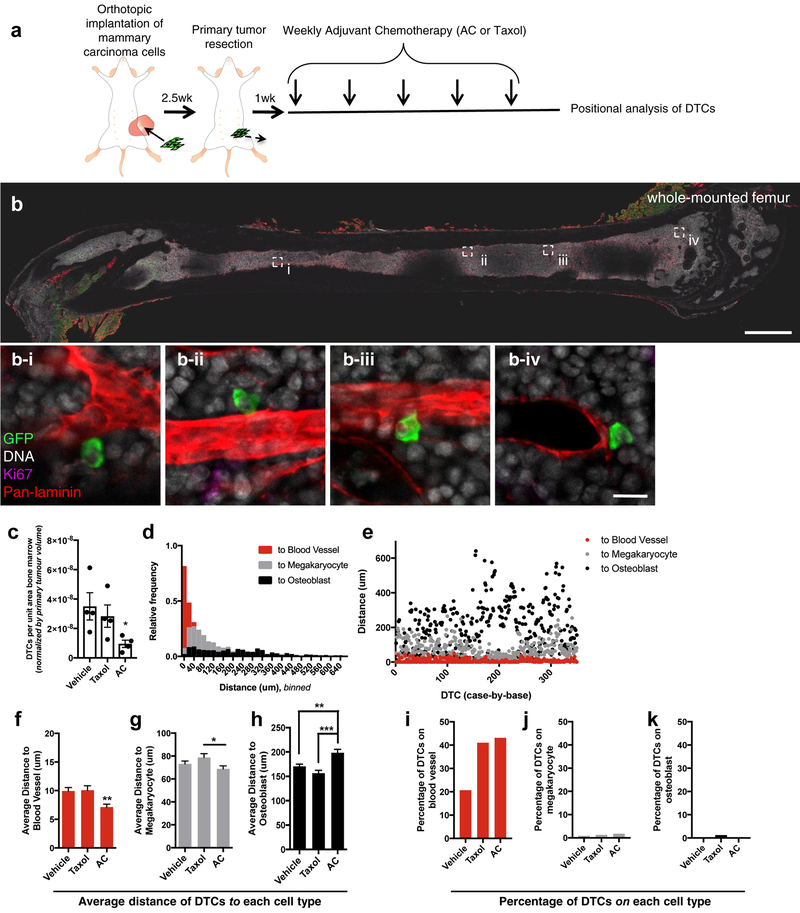
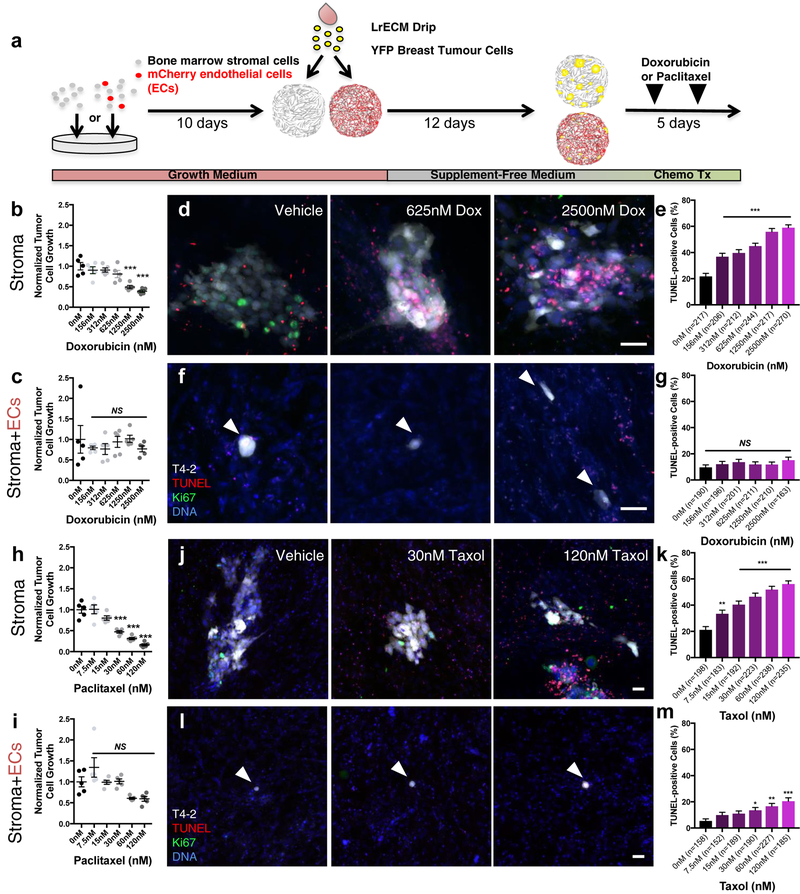
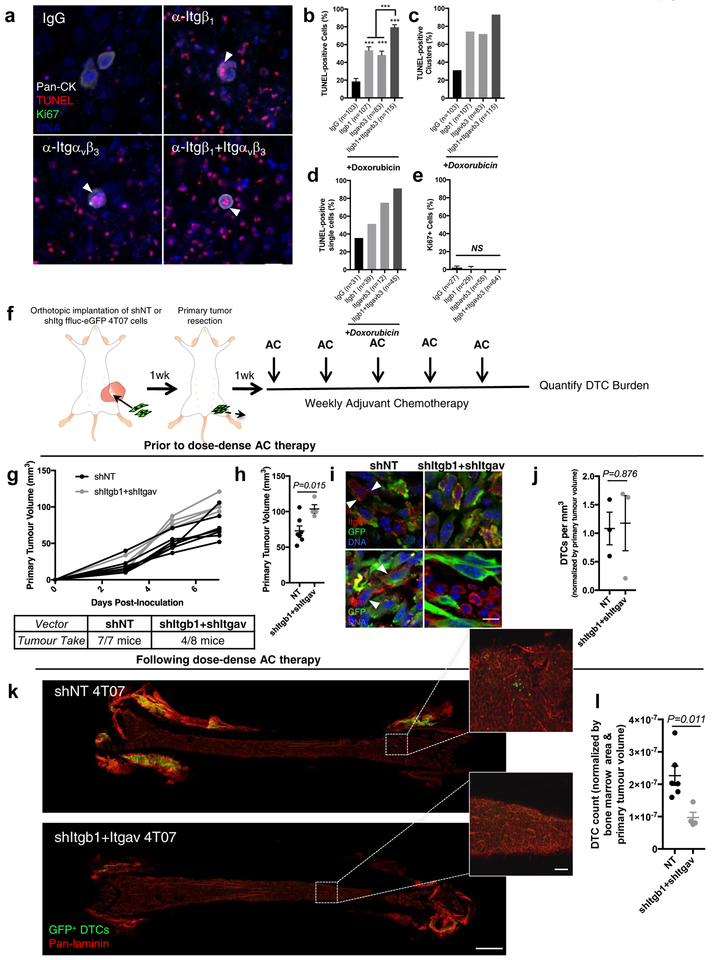
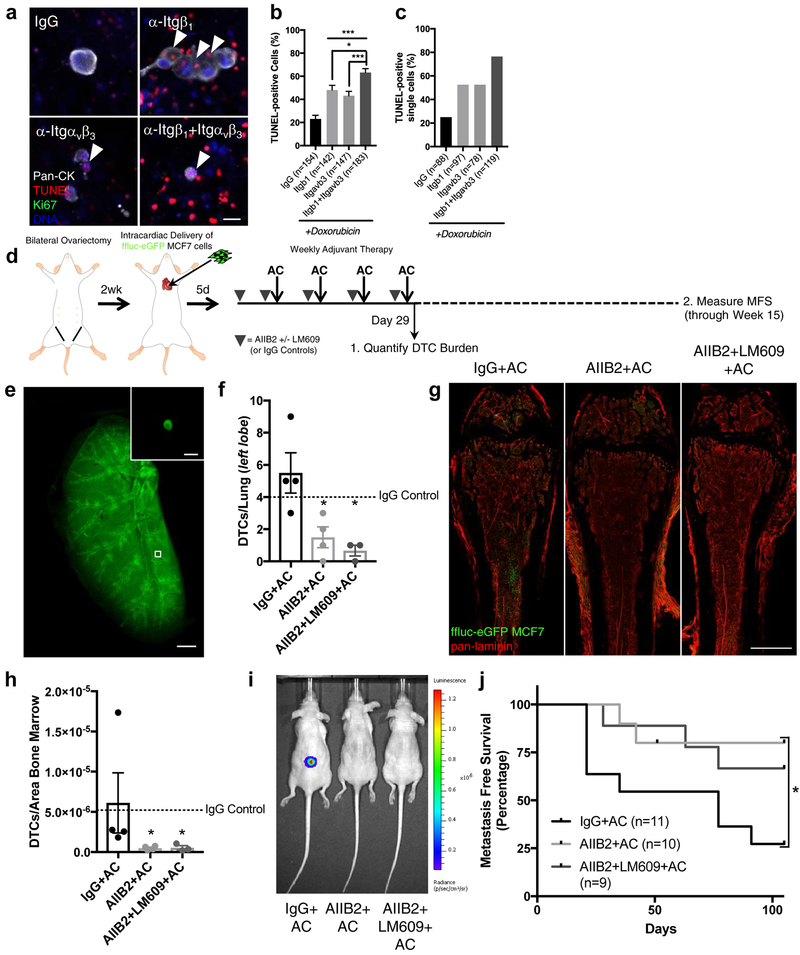
The presence of disseminated tumour cells (DTCs) in bone marrow is predictive of poor metastasis-free survival of patients with breast cancer with localized disease. DTCs persist in distant tissues despite systemic administration of adjuvant chemotherapy. Many assume that this is because the majority of DTCs are quiescent. Here, we challenge this notion and provide evidence that the microenvironment of DTCs protects them from chemotherapy, independent of cell cycle status. We show that chemoresistant DTCs occupy the perivascular niche (PVN) of distant tissues, where they are protected from therapy by vascular endothelium. Inhibiting integrin-mediated interactions between DTCs and the PVN, driven partly by endothelial-derived von Willebrand factor and vascular cell adhesion molecule 1, sensitizes DTCs to chemotherapy. Importantly, chemosensitization is achieved without inducing DTC proliferation or exacerbating chemotherapy-associated toxicities, and ultimately results in prevention of bone metastasis. This suggests that prefacing adjuvant therapy with integrin inhibitors is a viable clinical strategy to eradicate DTCs and prevent metastasis.


Conflict of interest statement

Competing Interests.

The authors declare no competing interests.

Figures

Figure 1:
Figure 1:. Dose-dense chemotherapeutic regimens select for perivascular disseminated tumour cells.
a) Schematic of the experiment to identify if DTCs localize to a specific nice following dose-dense chemotherapy. After resection of the ffluc-eGFP+ primary tumour, mice were treated with five cycles of weekly adriamycin (2mg/kg) and cyclophosphamide (AC; 60mg/kg), paclitaxel (Taxol; 20 mg/kg), or vehicle. DTC position within BM was analyzed by staining and whole-mounting femurs one week after final treatment. b) Tile scans encompassing the entire exposed face of the BM and the full Z-depth (~100 μm) that could be imaged using this method were acquired. Scale bar, 1 mm. b i-iv) Four examples of perivascular, GFP+, Ki67 DTCs are shown in BM following AC treatment (scale bar, 20 μm). c) Quantification of DTCs in femoral BM of vehicle-, Taxol- and AC-treated animals, normalized by BM area analyzed and volume of the primary tumour at resection. For each treatment, n=4 femurs from 4 different animals were analyzed. * P= 0.022 vs. vehicle-treated mice by Kruskal-Wallis and Dunn’s test to correct for multiple comparisons. 350 DTCs were analyzed across n=3 femurs from three different animals, and d) binned in histogram format or e) dot-plotted as individual distances to the nearest blood vessel (red), megakaryocyte (gray) or osteoblast (black). f-h) The average of these distances to the nearest f) blood vessel, g) megakaryocyte and h) osteoblast for mice that underwent treatment with vehicle (n=488 DTCs analyzed across 3 animals), AC (n=350) or Taxol (n=327). ** P= 0.0039 (vs. vehicle) or P=0.0061 (vs. Taxol) for (f); * P=0.047 for (g); **P=0.0017 for (h) and *** P<0.0001 for (h); all by one-way analysis of variance (ANOVA) followed by Tukey’s multiple comparisons test. i-k) The percentage of DTCs quantified across three mice in direct contact with i) blood vessels, j) megakaryocytes and k) osteoblasts for mice that underwent treatment with vehicle, Taxol or AC. For c, f-h, centre line represents the mean, and error bars the s.e.m. Statistical tests and P values are indicated. Source data are provided in Supplementary Table 1.
Figure 2:
Figure 2:. Microvascular endothelium protects breast tumour cells from chemotherapy.
a) Schematic of experiment to determine whether endothelium protects DTCs from chemotherapy. Dose response of HMT-3522-T4–2 (T4–2) breast cancer cells on BM b) stroma and c) MVNs to doxorubicin (n=5 independent experiments). NS, no significance, *** P<0.0001 compared to vehicleby one-way ANOVA and Dunnett’s multiple comparison test.. Following treatment, cultures were TUNEL-stained to assess apoptosis. d) Representative images of TUNEL-stained T4–2 ‘DTCs’ treated with increasing doses of doxorubicin (Dox) on BM stroma. Scale bar, 50 μm e) Percentage of TUNEL-positive DTCs per DTC cluster as a function of dose. *** P<0.0001 for all conditions vs. vehicle by one-way ANOVA and Dunnett’s multiple comparisons test. f) Representative images of TUNEL-stained T4–2 DTCs treated with increasing doses of Dox on BM MVNs. Scale bar, 50 μm. g) Percentage of TUNEL-positive DTCs per DTC cluster as a function of dose. NS denotes no significance compared to vehicle by one-way ANOVA and Dunnett’s multiple comparisons test. h, i) Dose response of T4–2 DTCs on BM h) stroma and i) MVNs to paclitaxel/Taxol (n=5 independent experiments). NS denotes no significance, *** P<0.0001 by one-way ANOVA and Dunnett’s multiple comparison test, compared to vehicle. j) Representative images of TUNEL-stained T4–2 cells treated with increasing doses of Taxol on BM stroma. Scale bar, 50 μm. k) Percentage of TUNEL-positive DTCs per DTC cluster as a function of dose. *** P<0.0001 compared to vehicle by one-way ANOVA and Dunnett’s multiple comparisons test. l) Representative images of TUNEL-stained T4–2 cells treated with increasing doses of Taxol on BM MVNs. Scale bar, 50 μm. m) Percentage of TUNEL-positive DTCs per DTC cluster as a function of dose.*P=0.0437, **P=0.0012, *** P<0.0001 compared to vehicle by one-way ANOVA and Dunnett’s multiple comparisons test. For b-c, e, g-I, k, m, centre line represents the mean, and error bars the s.e.m. Statistical tests and P values are indicated. For TUNEL analyses, the number of cells (predominantly single cells and clusters of 2–4 cells) analyzed per condition across n=3 independent experiments is stated within each panel. Source data are provided in Supplementary Table 1.
Figure 3:
Figure 3:. Perivascular niche-mediated chemoprotection does not depend on DTC cell cycle status.
Analysis of single DTCs on stroma (MSC) or BM MVNs (MSC+EC) following treatment with a) 2500 nM doxorubicin or b) 120 nM paclitaxel. Data depict the percentage of TUNEL-positive single cells over n=3 independent experiments. In a) *** P=0.0004 and in b) P=0.0713 by unpaired, two-tailed t test. c) Schematic for experiment to determine how cell cycle status influences response to doxorubicin on BM stroma and BM MVNs. Here, cultures were seeded with T4–2 cells expressing tdTomato and a mVenus-p27K reporter, treated with 2500nM doxorubicin and NucView405 to label apoptotic cells, and imaged for 72 hours. d) Stills from time-lapse videos on BM stroma (top) or BM MVNs (bottom). Q indicates a quiescent cell that subsequently undergoes apoptosis (white asterisk); P denotes a proliferative cell that subsequently undergoes apoptosis (white asterisk); both on stroma. Scale bar, 20 μm. e) Quantification of relative percentages of p27+ and p27 T4–2 cells that apoptose within 72h of doxorubicin treatment on BM stroma (MSC) and on BM MVNs (MSC+EC) from n=6 independent videos per condition. ** P=0.0027 comparing MSC to MSC+EC by Two-way ANOVA. f) Schematic for experiment to determine whether ‘priming’ MVNs with IGF-1 to trigger DTC proliferation sensitizes DTCs to doxorubicin. g) Representative images of quiescent, microvascular-associated DTCs at Day 10 (left), and after priming with vehicle or with 300 ng/ml IGF-1 at Day 17 (middle). Cultures were fixed and stained at this time point to analyze the proliferative status and viability of tumour cells (right). Scale bars, 50 μm. h) Percentage of TUNEL-positive DTCs per DTC cluster as a function of priming with vehicle or 300 ng/mL IGF-1, and treating with 2500 nM doxorubicin. n=30 and 32 cells from single cells or clusters of mostly 2–4 cells were analyzed for the vehicle- and IGF-1- primed conditions, respectively, over n =3 independent experiments. P=0.793 by unpaired, two-tailed t test. For a-b, e, h centre line represents the mean, and error bars the s.e.m. Statistical tests and P values are indicated. Source data are provided in Supplementary Table 1.
Figure 4:
Figure 4:. Integrin β1 and integrin αvβ3 protect perivascular disseminated tumour cells from chemotherapy.
a) Functional enrichment analysis conducted on whole transcriptome sequencing data derived from BM stroma and BM MVNs (n=2 biologically independent samples; 3-fold differential expression cutoff). Enrichment was tested by Fisher’s exact test and controlled for multiple testing by false discovery rate (FDR). FDR (-log10) of significantly enriched Gene Ontology molecular function terms are plotted. Integrin binding was amongst the most enriched molecular functions. b) Gene set enrichment analysis of Reactome “Integrin cell surface interactions” pathway. The leading edge subset of genes defining the enrichment are outlined. c) Heatmap of relative expression values in stroma and MVNs of the 27 target genes that define the leading edge GSEA analysis in (b). d) Quantitative, ECM-targeted proteomic data displayed as a volcano plot, showing significantly enriched genes in BM stroma and BM MVNs. Data are derived from n=3 biologically independent samples; P values generated by unpaired, nonparametric, two-sided t test (Mann-Whitney). e) Schematic of experiment to test whether priming DTCs with inhibitory antibodies targeting integrin subunits sensitizes DTCs to doxorubicin. f) Representative images of fixed and TUNEL-stained T4–2 ‘DTCs’ on BM MVNs following treatment with the array of function blocking antibodies listed (or isotype/IgG control) and 2500nM doxorubicin. White arrowheads denote apoptotic DTCs; scale bar, 20 μm. Quantification of TUNEL-positive DTCs and DTC clusters following treatment with the array of function blocking antibodies listed (or isotype/IgG control) and 2500nM doxorubicin on BM MVNs yielded the total percentage of g) TUNEL-positive cells across 1–10 DTC/DTC clusters, h) TUNEL-positive single DTCs and i) TUNEL-positive DTCs within clusters of 2–4 DTCs. The number of cells/cell clusters analyzed per condition is stated within each panel. For (g) and (i), * P<0.05, ** P<0.01 and *** P<0.001 when compared to control (IgG) by one-way ANOVA and Dunnett’s multiple comparisons test. Centre line represents the mean, error bars the s.e.m. Source data are provided in Supplementary Table 1.
Figure 5:
Figure 5:. Endothelial von Willebrand Factor and VCAM-1 confer DTC resistance to doxorubicin.
a) IF staining for VWF, SPP1, TNC and VCAM-1 to assess localization to BM microvessels. Scale bar, 20 μm (VWF); 10 μm (SPP1, TNC, and VCAM1). b) Representative immunoblot of ECs infected with non-targeting (NT) shRNA or two different shRNA clones targeting VWF. Blot was co-stained for VWF and the nuclear envelope proteins Lamin A/C (loading control). c) Densitometry from n=3 biologically independent samples, normalized to intensity of shNT band on each blot. **P=0.008, ***P=0.0002 by one-way ANOVA and Dunnett’s multiple comparisons test. d) Representative immunostains (n=3 independent experiments) for VWF in BM MVNs composed of shNT ECs or shVWF ECs after 27-days in selection-free media. Scale bar, 100 μm e) Number of clusters and f) tumor cell outgrowth (n=5 independent experiments) in the absence of doxorubicin (n=5 independent experiments). NS, no significance between shNT and shVWF conditions by one-way ANOVA and Dunnett’s multiple comparisons test. Quantification of g) TUNEL-positive DTCs (overall), h) single DTCs and i) 2–4 cell DTC clusters following treatment with 2500nM doxorubicin as a function of endothelial VWF expression. In (g) *P=0.0266 and *** P<0.0001 vs. shNT by one-way ANOVA and Dunnett’s multiple comparisons test. j) TUNEL-positive DTCs/DTC clusters and k) tumour cell outgrowth on BM MVNs following treatment with only VCAM1 blocking antibody or mouse IgG control (n=5 independent experiments). Stated P-values by unpaired, two-tailed t test. l) The percentage of TUNEL-positive DTCs (overall), m) single DTCs and n) clusters of 2–4 DTCs from BM MVNs primed with VCAM1 function blocking antibody or isotype control prior to treatment with 2500nM doxorubicin (as in Fig. 4e). ** P=0.0054 by unpaired, two-tailed t test. For TUNEL analyses, the number of cells (predominantly single cells and clusters of 2–4 cells) analyzed per condition across n=3 independent experiments is stated within each panel. For c, e-g, I, j-l, n centre line represents the mean, and error bars the s.e.m. Source data are provided in Supplementary Table 1.
Figure 6:
Figure 6:. Targeting integrin-β1 and integrin-αvβ3 sensitizes BM DTCs to chemotherapy.
a) TUNEL-stained T4–2 ‘DTCs’ on BM MVNs following treatment with integrin β1 and/or integrin αvβ3 function blocking antibodies and 2500nM doxorubicin. White arrowheads: apoptotic DTCs. Scale bar, 20 μm. Percentage of b) TUNEL-positive DTCs (from predominantly single cells and clusters of 2–4 cells), c) DTC clusters with at least one TUNEL-positive DTC; and d) TUNEL-positive single cells. ***P<0.0001 comparing primed conditions to isotype control, or comparing dual-priming to single agent priming, by one-way ANOVA and Tukey’s multiple comparison test. e) Percentage of Ki67+ DTCs after priming. NS, no significance by one-way ANOVA and Tukey’s multiple comparison test. f) Schematic of experiment to test the combined effect of blocking integrin β1 and integrin αvβ3 on DTC survival in response to chemotherapy in vivo. g) Kinetics of primary tumour growth and take rates for shNT and shItgb1+Itgav 4T07 cells. h) Average primary tumour volume of shNT (n=7 animals) and shItgb1+Itgav (n=4 animals) cohorts at resection. *P=0.0148 by unpaired, two-tailed t test. i) Representative images of n=3 biologically independent shNT and shItgb1+Itgav 4T07 primary tumours, stained for activated integrin-β1 (top row) and integrin αv (bottom row). White arrowheads, integrin expression on GFP+ tumour cells. Scale bar, 10 μm. j) DTCs/mm3 of BM in an untreated cohort of mice (n=3 femurs from three distinct animals). P=0.876 by unpaired, two-tailed t test. k) Representative images of whole-mounted femurs derived from animals treated with dose-dense AC. Scale bar, 1 mm; inset, 100 μm. l) DTCs/femur, normalized by the total area of BM analyzed and by primary tumour volume. n=7 femurs from seven different animals were analyzed for the shNT condition; n=4 femurs from four different animals were analyzed for the shItgb1+shItgav condition. P=0.011 by unpaired, two-tailed t test. For TUNEL and Ki67 analyses, the number of cells (predominantly single cells and clusters of 2–4 cells) analyzed per condition across n=3 independent experiments is stated within each panel. For b, e, h, j, l centre line represents the mean, and error bars the s.e.m. Source data are provided in Supplementary Tables 1 and 2.
Figure 7:
Figure 7:. Targeting integrin-β1 sensitizes DTCs to chemotherapy and prevents bone metastasis.
a) Representative images of TUNEL-stained MCF-7 cells on BM MVNs following priming with integrin-β1 and/or -αvβ3 function-blocking antibodies, and 2500 nM doxorubicin. White arrowheads, apoptotic DTCs. Scale bar, 20 μm. Percentage of b) TUNEL-positive cells from predominantly single cells and clusters of 2–4 cells and c) TUNEL-positive single cells. The number of cells/clusters analyzed per condition across n=3 independent experiments is stated within each panel.***P≤ 0.0007 for IgG primed vs. single agent priming; *P= 0.0149 for integrin β1 primed vs. dual agent priming; ***P=0.0004 for integrin αvβ3 primed vs. dual agent priming, all by one-way ANOVA and Tukey’s post-test. d) Schematic of experiment to test the effect of blocking integrin β1 and integrin αvβ3 function on DTC survival and bone metastasis in vivo. e) Representative image of the left lobe of a Ce3D cleared lung, stained for eGFP to quantify lung DTCs. Scale bar, 1mm. Inset: representative DTC. Scale, 10 μm. f) DTCs/lung following treatment (Day 29). *P=0.022 for AIIB2+AC (n=4 lungs from four animals) vs. IgG+AC (n=4 lungs from four animals), P=0.013 for AIIB2+LM609+AC (n=3 lungs from three animals) vs. IgG+AC; by one-way ANOVA and Dunnett’s post-test. Dashed line: mean value for mice treated with IgG only. g) Representative images of whole-mounted left femoral heads from animals treated with IgG+AC, AIIB2+AC and AIIB2+LM609+AC. Scale bar, 1 mm. h) DTCs/area BM following treatment (Day 29). *P=0.050 for AIIB2+AC (n=4 femurs from four animals) vs. IgG+AC (n=4 femurs from four animals); P=0.043 for AIIB2+LM609+AC (n=3 femurs from three animals) vs. IgG+AC, by Kruskall-Wallis test and Dunn’s post-test. Dashed line: mean value for mice treated with IgG only. i) Bioluminescence of mice from each treatment group at week 15. j) Kaplan-Meier analysis of metastasis-free survival. *P=0.039 by Log-rank Mantel-Cox test; P=0.034 by Gehan-Breslow-Wilcoxon method. Tick mark represents one censored mouse that died of unknown causes. Cohort size: IgG+AC: 11 animals; AIIB2+AC: 10 animals; AIIB2+LM709+AC: 9 animals. For b, f, h centre line represents the mean, error bars: s.e.m. Source data for b, f, h, j provided in Supplementary Table 1.

Comment in

References

    1. Karrison TG, Ferguson DJ & Meier P Dormancy of mammary carcinoma after mastectomy. Journal of the National Cancer Institute 91, 80–85 (1999). - PubMed
    1. Pan H et al. 20-Year Risks of Breast-Cancer Recurrence after Stopping Endocrine Therapy at 5 Years. The New England journal of medicine 377, 1836–1846 (2017). - PMC - PubMed
    1. Braun S et al. Lack of effect of adjuvant chemotherapy on the elimination of single dormant tumor cells in bone marrow of high-risk breast cancer patients. Journal of clinical oncology : official journal of the American Society of Clinical Oncology 18, 80–86 (2000). - PubMed
    1. Ghajar CM Metastasis prevention by targeting the dormant niche. Nature reviews. Cancer 15, 238–247 (2015). - PMC - PubMed
    1. Janni W et al. Persistence of disseminated tumor cells in the bone marrow of breast cancer patients predicts increased risk for relapse--a European pooled analysis. Clinical cancer research : an official journal of the American Association for Cancer Research 17, 2967–2976 (2011). - PubMed

Publication types

MeSH terms