. 2019 Sep;70(3):955-970.
doi: 10.1002/hep.30513. Epub 2019 Mar 22.

Deficiency of Both Farnesoid X Receptor and Takeda G Protein-Coupled Receptor 5 Exacerbated Liver Fibrosis in Mice

Affiliations

Deficiency of Both Farnesoid X Receptor and Takeda G Protein-Coupled Receptor 5 Exacerbated Liver Fibrosis in Mice

Jessica M Ferrell et al. Hepatology. 2019 Sep.

Abstract

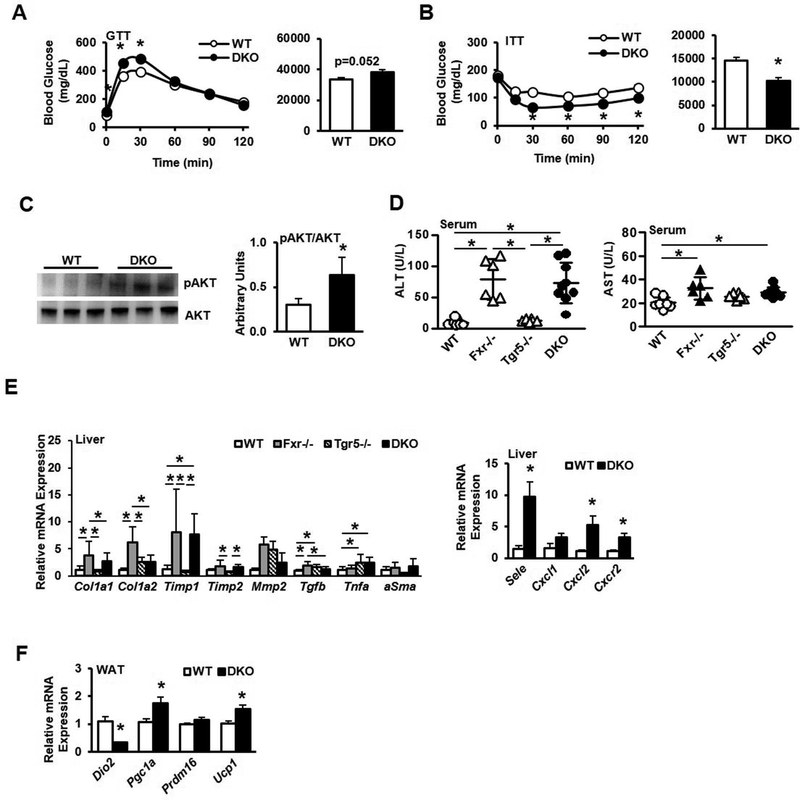
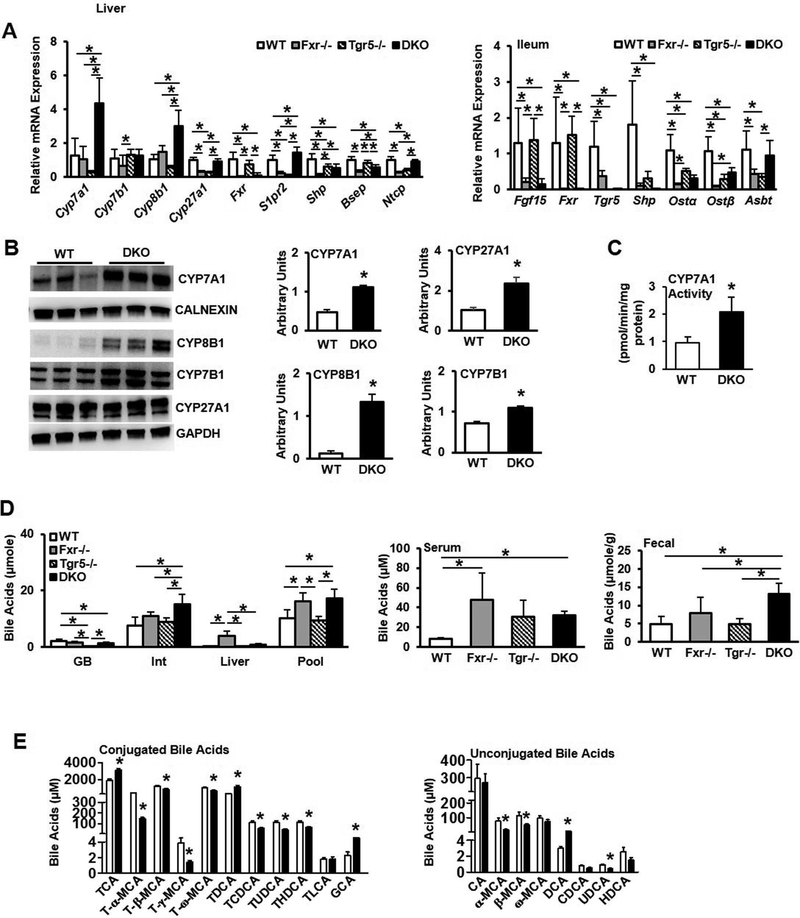
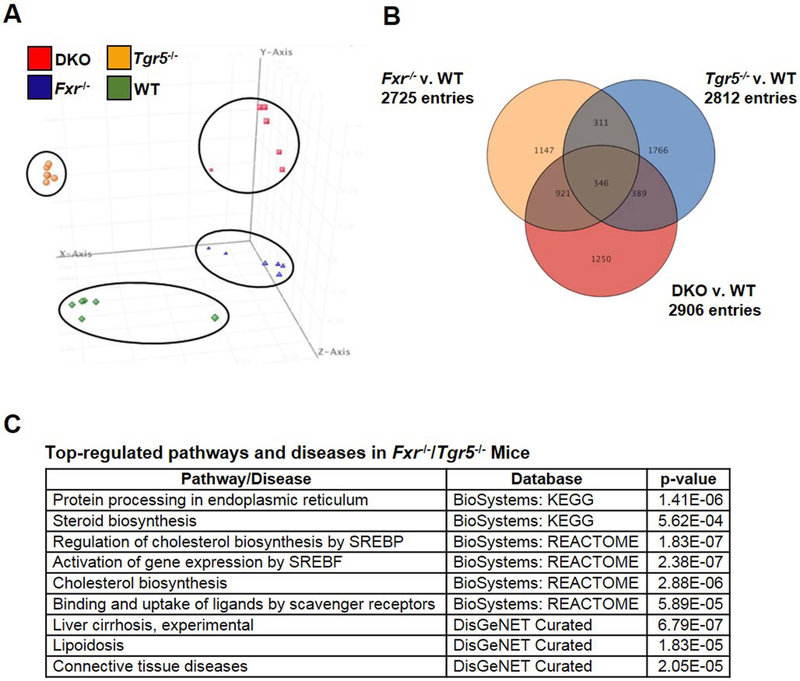
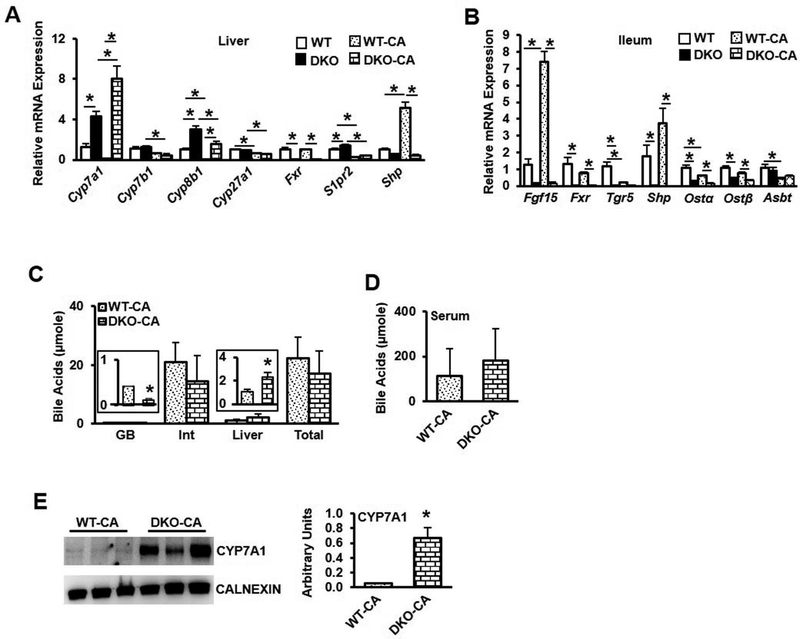
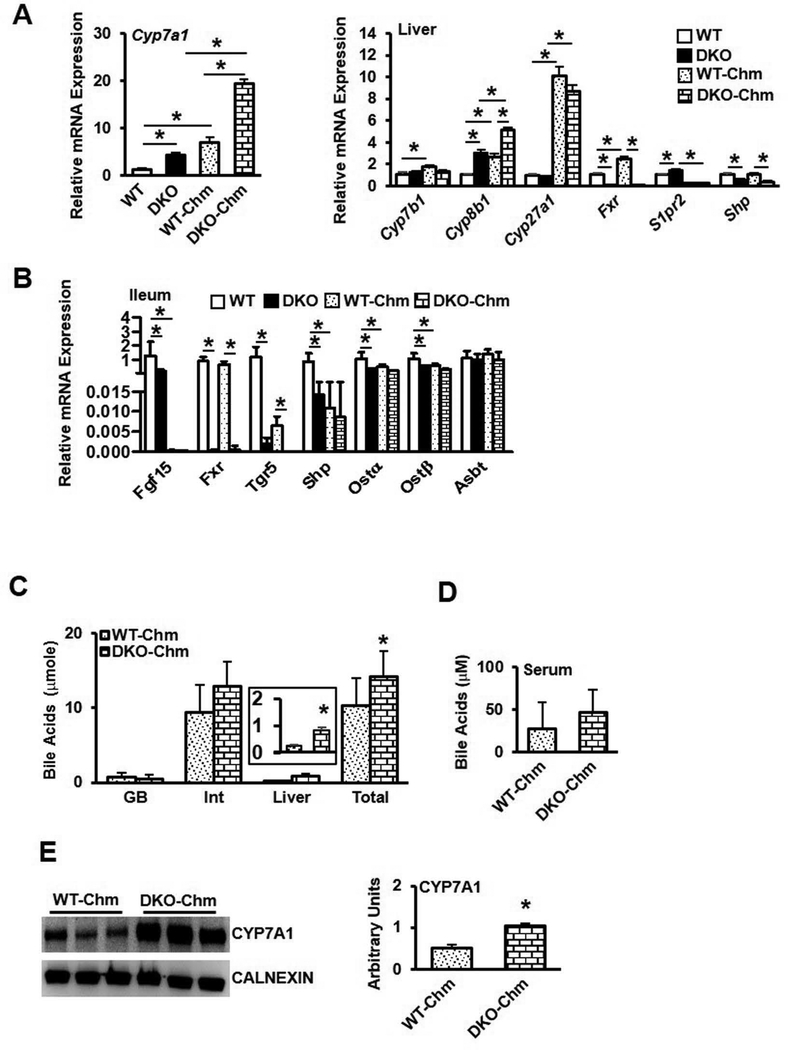
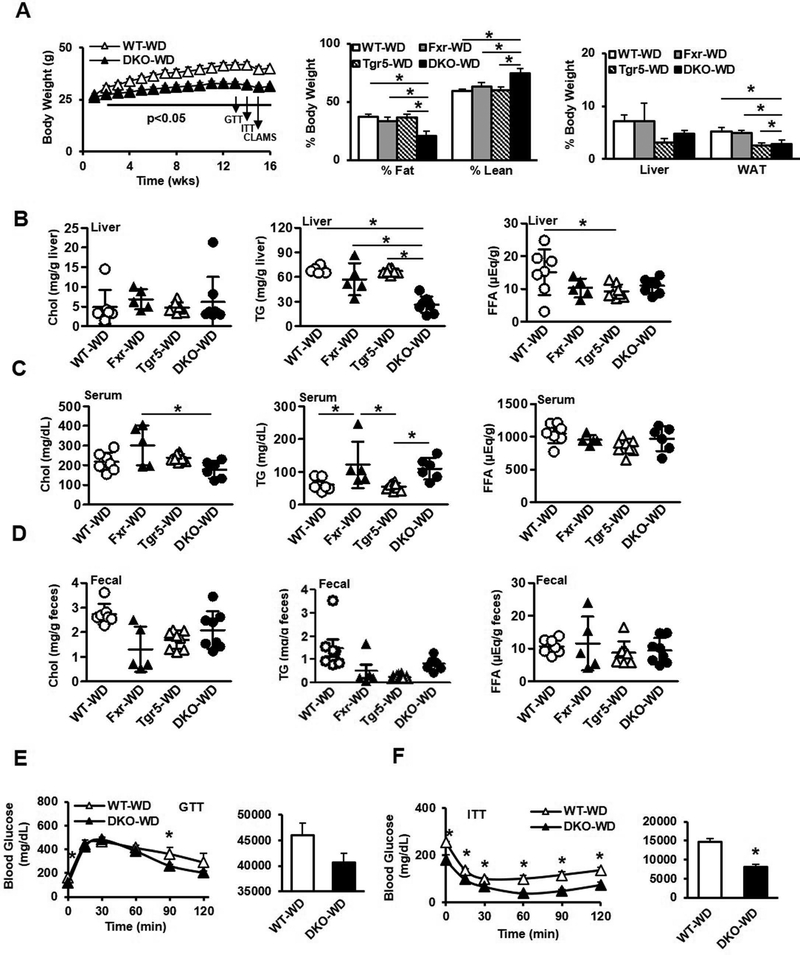
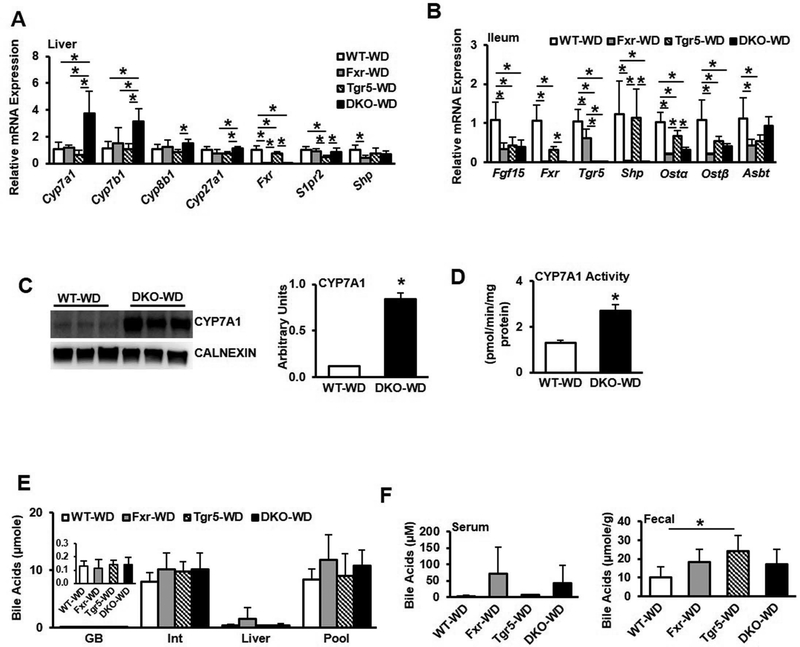
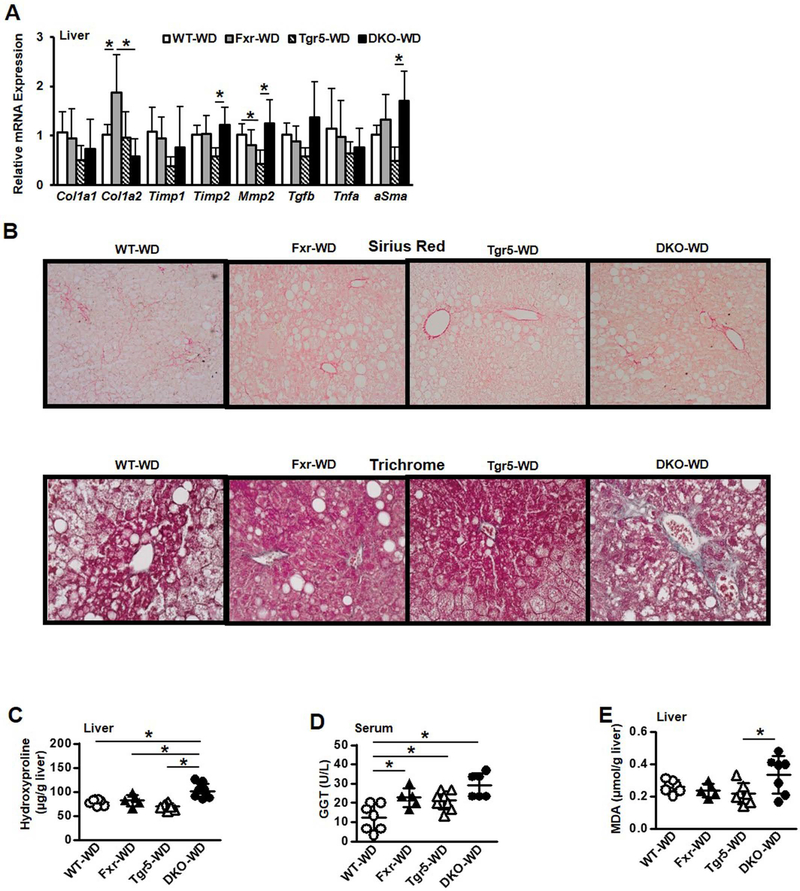
Activation of the nuclear bile acid receptor farnesoid X receptor (FXR) protects against hepatic inflammation and injury, while Takeda G protein-coupled receptor 5 (TGR5) promotes adipose tissue browning and energy metabolism. Here, we examined the physiological and metabolic effects of the deficiency of these two bile acid receptors on hepatic metabolism and injury in mice. Fxr/Tgr5 double knockout mice (DKO) were generated for metabolic phenotyping. Male DKO mice fed a chow diet had reduced liver lipid levels but increased serum cholesterol levels. Liver cholesterol 7α-hydroxylase (Cyp7a1) activity and sterol 12α-hydroxylase mRNA levels were induced, while ileum FXR target genes were suppressed in DKO mice compared to wild-type (WT) mice. Bile acid pool size was increased in DKO mice, with increased taurocholic acid and decreased tauromuricholic acids. RNA sequencing analysis of the liver transcriptome revealed that bile acid synthesis and fibrosis gene expression levels are increased in chow-fed DKO mice compared to WT mice and that the top regulated pathways are involved in steroid/cholesterol biosynthesis, liver cirrhosis, and connective tissue disease. Cholestyramine treatment further induced Cyp7a1 mRNA and protein in DKO mice and increased bile acid pool size, while cholic acid also induced Cyp7a1 in DKO mice, suggesting impaired bile acid feedback regulation. A Western diet containing 0.2% cholesterol increased oxidative stress and markers of liver fibrosis but not hepatic steatosis in DKO mice. Conclusion: FXR and TGR5 play critical roles in protecting the liver from inflammation and fibrosis, and deficiency of both of these bile acid receptors in mice increased cholic acid synthesis and the bile acid pool, liver fibrosis, and inflammation; FXR and TGR5 DKO mice may be a model for liver fibrosis.


Figures

Figure 1.
Figure 1.
Metabolic phenotyping of male wild type, Fxr−/−, Tgr5−/−, and Fxr−/−/Tgr5−/− (DKO) mice, n=6–9. A. Glucose tolerance test (GTT). B. Insulin tolerance test (ITT). C. Immunoblotting analysis of phosphorylated AKT and total AKT protein expression. D. Serum aspartate aminotransferase (AST, left) and alanine aminotransferase (ALT, right). E. Quantitative real-time PCR (QPCR) analysis of liver fibrosis (left) and inflammation (right) mRNA gene expression F. QPCR analysis of white adipose tissue browning factor mRNA expression. WT, wild type mice; Fxr−/−, FXR single knockout mice; Tgr5−/−, Tgr5 single knockout mice; DKO, Fxr−/−/Tgr5−/− double knockout mice. An “*” indicates statistically significant difference (p<0.05) determined by one-way ANOVA (D-E) or Student’s t-test (A-C, E-F).
Figure 2.
Figure 2.
Gene expression profile and bile acid analysis of male wild type, Fxr−/−, Tgr5−/−, and DKO mice, n=6–9. A. QPCR analysis of bile acid synthesis gene expression and FXR-regulated bile acid transporter gene expression in the liver (left) and FXR-induced genes and bile acid transporters in the ileum (right). B. Immunoblotting analysis of liver bile acid synthesis enzyme protein expression. Liver microsomes were isolated to assay CYP7A1 protein and CALNEXIN was used as an internal control. CYP8B1, CYP7B1 and CYP27A1 were assayed in total liver protein and GAPDH was used as an internal control. C. Liver microsomal CYP7A1 enzyme specific activity. D. Total bile acid pool and bile acid concentrations in gallbladder (GB), intestine (Int) and liver (left), serum bile acids (middle) and fecal bile acids (right). E. Conjugated (left) and unconjugated (right) gallbladder bile acid concentrations. WT, wild type mice; Fxr−/−, FXR single knockout mice; Tgr5−/−, Tgr5 single knockout mice; DKO, Fxr−/−/Tgr5−/− double knockout mice. An “*” indicates statistically significant difference (p<0.05) determined by one-way ANOVA (A, D) or Student’s t-test (B-C, E).
Figure 3.
Figure 3.
RNA-sequencing analysis of liver transcriptomes in male wild type, Fxr−/−, Tgr5−/−, and DKO mice. A. Principal component analysis (PCA) of differentially expressed genes (DEGs) in liver of wild type, Fxr−/−, Tgr5−/− and DKO mice (n=6). Each dot represents data from individual mice. B. Venn diagram depicting overlapping and unique genes in Fxr−/−, Tgr5−/− and DKO mice vs. wild type mice. C. Selective representation of significantly up regulated pathways and diseases in DKO mice by pathway analysis and p-values. Detailed RNA-seq and analysis methods are described in Supplemental Materials.
Figure 4.
Figure 4.
Effect of cholic acid feeding on bile acid metabolism in DKO mice. Male wild type mice (WT-CA) and Fxr−/−/Tgr5−/− mice (DKO-CA) were fed a chow diet supplemented with cholic acid (0.5%) for 2 weeks, n=8. A. Liver mRNA expression of genes involved in bile acid synthesis and regulation in chow-fed and cholic acid-fed male mice. B. Ileum mRNA expression of genes involved in bile acid regulation. C. Bile acid content in gallbladder (GB), intestine (Int) and liver, and total bile acid pool size. D. Serum bile acid content. E. Liver microsomal CYP7A1 protein expression. An “*” indicates statistically significant difference (p<0.05) determined by one-way ANOVA (A-B) or Student’s t-test (C-E).
Figure 5.
Figure 5.
Effect of cholestyramine feeding on bile acid metabolism in DKO mice. Male wild type mice (WT-Chm) and Fxr−/−/Tgr5−/− mice (DKO-Chm) were fed a chow diet supplemented with cholestyramine (2%) for 2 weeks, n=8. A. Liver mRNA expression of Cyp7a1 (left) and genes involved in bile acid synthesis and regulation (right) in chow-fed and cholestyramine-fed mice. B. Ileum mRNA expression of FXR-regulated genes involved in bile acid regulation. C. Total bile acid pool and bile acid content in gallbladder (GB), intestine (Int) and liver. D. Serum bile acid content. E. Liver microsomal CYP7A1 protein. An “*” indicates statistically significant difference (p<0.05) determined by one-way ANOVA (A-B) or Student’s t-test (C-E).
Figure 6.
Figure 6.
Effect of Western diet feeding on metabolic phenotype in male wild type, Fxr−/−, Tgr5−/−, and DKO mice fed a high fat, high cholesterol Western diet for 16 weeks, n=5–8. A. Body weight (left), body composition (middle), and liver and white adipose tissue weight (right). B. Liver cholesterol (left), triglycerides (middle) and free fatty acids (right). C. Serum cholesterol (left), triglycerides (middle) and free fatty acids (right). D. Fecal cholesterol (left), triglycerides (middle) and free fatty acids (right). E. Glucose tolerance test. F. Insulin tolerance test. WT-WD, wild type mice fed Western diet; Fxr-WD, Fxr−/− mice fed Western diet; Tgr5-WD, Tgr5−/− mice fed Western diet; DKO-WD, Fxr−/−/Tgr5−/− double knockout mice fed Western diet; * indicates p<0.05. An “*” indicates statistically significant difference (p<0.05) determined by one-way ANOVA (A-D) or Student’s t-test (E-F).
Figure 7.
Figure 7.
Effect of Western diet feeding on gene expression profile and bile acid metabolism in male wild type, Fxr−/−, Tgr5−/−, and DKO mice fed a high fat, high cholesterol Western diet for 16 weeks, n=5–8. A. Liver mRNA expression of genes involved in bile acid synthesis and regulation in chow-fed and Western diet-fed male mice. B. Ileum mRNA expression of genes involved in bile acid regulation. C. CYP7A1 protein expression in liver microsomes. D. CYP7A1 specific activity. E. Bile acid content in gallbladder (GB), intestine (Int) and liver, and total bile acid pool size. F. Serum (left) and fecal (right) bile acid content. WT-WD, wild type mice fed Western diet; Fxr-WD, Fxr−/− mice fed Western diet; Tgr5-WD, Tgr5−/− mice fed Western diet; DKO-WD, Fxr−/−/Tgr5−/− double knockout mice fed Western diet; * indicates p<0.05. An “*” indicates statistically significant difference (p<0.05) determined by one-way ANOVA (A-B, E-F) or Student’s t-test (C-D).
Figure 8.
Figure 8.
Effect of Western diet feeding on gene expression profile, liver steatosis and fibrosis in male wild type, Fxr−/−, Tgr5−/−, and DKO mice fed a high fat, high cholesterol Western diet for 16 weeks, n=5–8. A. Liver fibrotic and inflammatory mRNA expression. B. Sirius Red staining (10x), and Trichrome staining (20x) of mouse liver (representative images from 4 mice in each group). C. Liver hydroxyproline content. D. Liver γ-glutamyl transferase activity. E. Liver malondialdehyde, indicative of thiobarbituric acid reactive substances (TBARS). An “*” indicates statistically significant difference (p<0.05) determined by one-way ANOVA (A, C-E).

References

    1. Chiang JY. Bile acids: regulation of synthesis. J Lipid Res 2009;50:1955–1966. - PMC - PubMed
    1. Inagaki T, Choi M, Moschetta A, Peng L, Cummins CL, McDonald JG, Luo G, et al. Fibroblast growth factor 15 functions as an enterohepatic signal to regulate bile acid homeostasis. Cell Metab 2005;2:217–225. - PubMed
    1. Watanabe M, Houten SM, Wang L, Moschetta A, Mangelsdorf DJ, Heyman RA, Moore DD, et al. Bile acids lower triglyceride levels via a pathway involving FXR, SHP, and SREBP-1c. J Clin Invest 2004;113:1408–1418. - PMC - PubMed
    1. Thomas C, Gioiello A, Noriega L, Strehle A, Oury J, Rizzo G, Macchiarulo A, et al. TGR5-mediated bile acid sensing controls glucose homeostasis. Cell Metab 2009;10:167–177. - PMC - PubMed
    1. Pols TW, Nomura M, Harach T, Lo Sasso G, Oosterveer MH, Thomas C, Rizzo G, et al. TGR5 activation inhibits atherosclerosis by reducing macrophage inflammation and lipid loading. Cell metabolism 2011;14:747–757. - PMC - PubMed

Publication types

MeSH terms

Substances