. 2019 Apr;189(4):868-885.
doi: 10.1016/j.ajpath.2018.12.010. Epub 2019 Jan 19.

Impaired Annulus Fibrosus Development and Vertebral Fusion Cause Severe Scoliosis in Mice with Deficiency of c-Jun NH2-Terminal Kinases 1 and 2

Affiliations

Impaired Annulus Fibrosus Development and Vertebral Fusion Cause Severe Scoliosis in Mice with Deficiency of c-Jun NH2-Terminal Kinases 1 and 2

Veronica Ulici et al. Am J Pathol. 2019 Apr.

Abstract

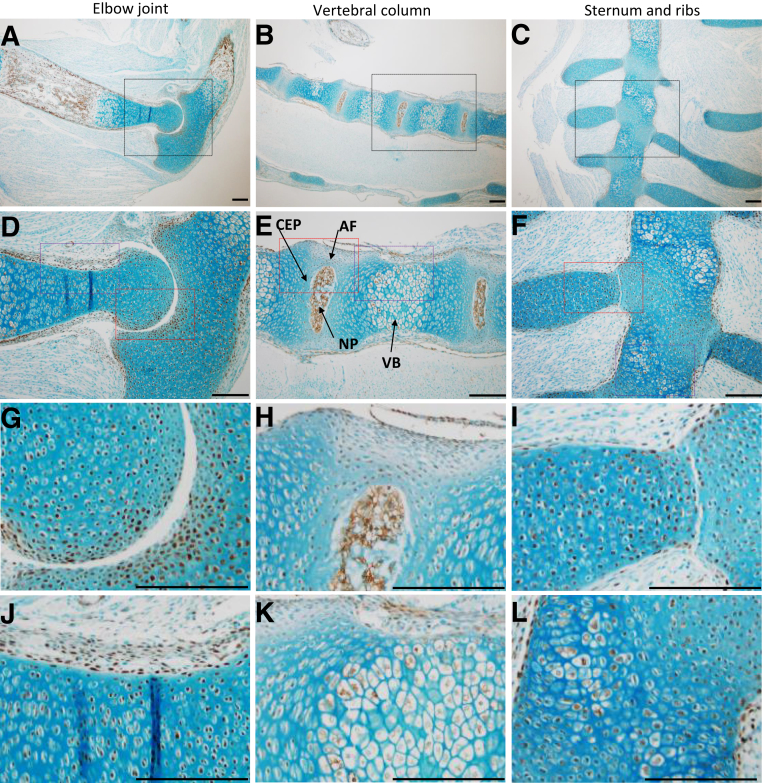
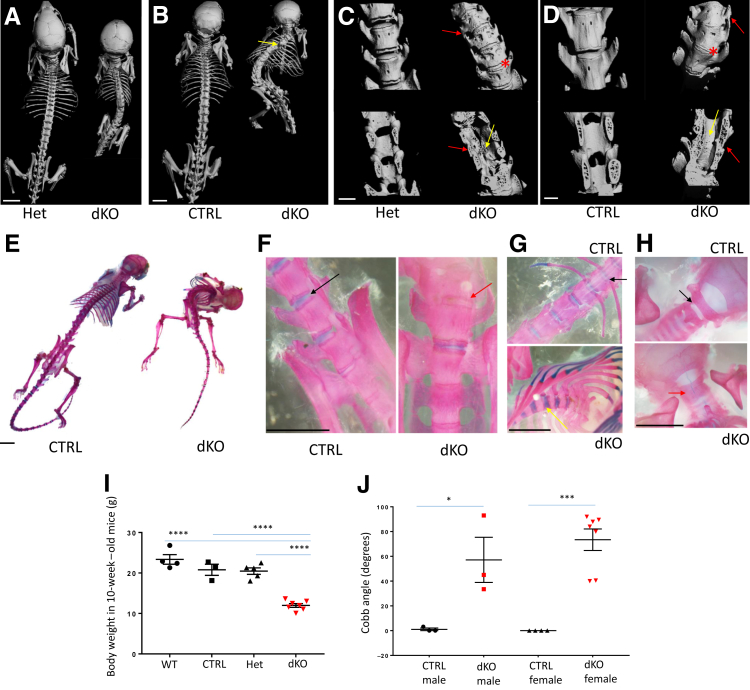
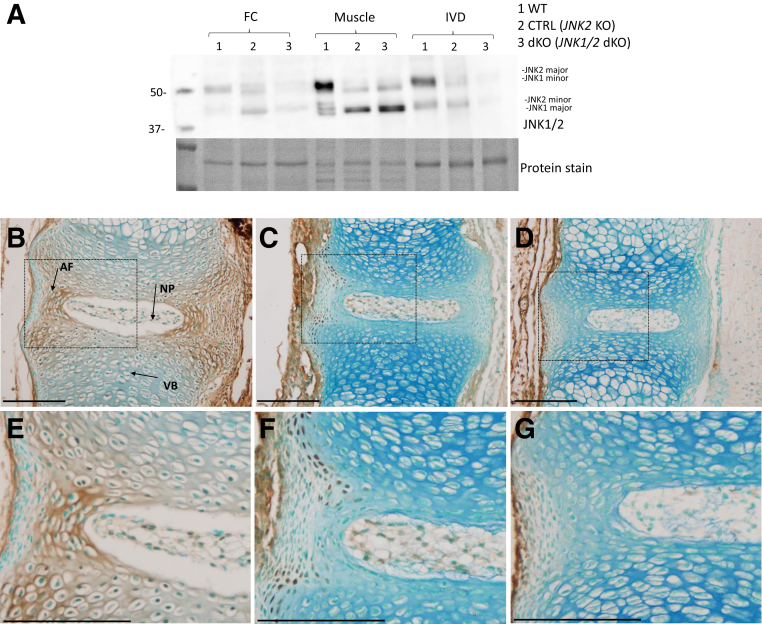
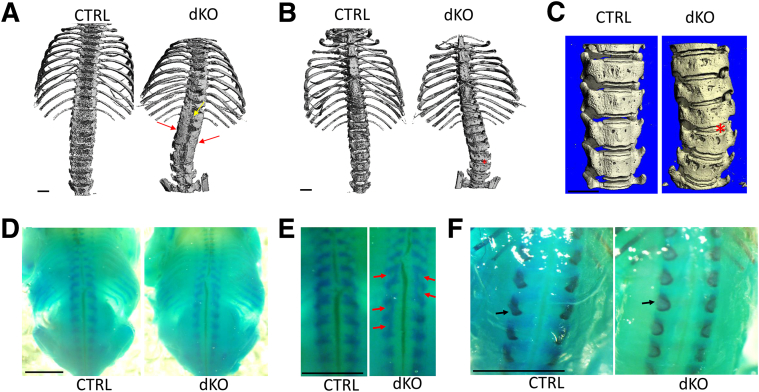
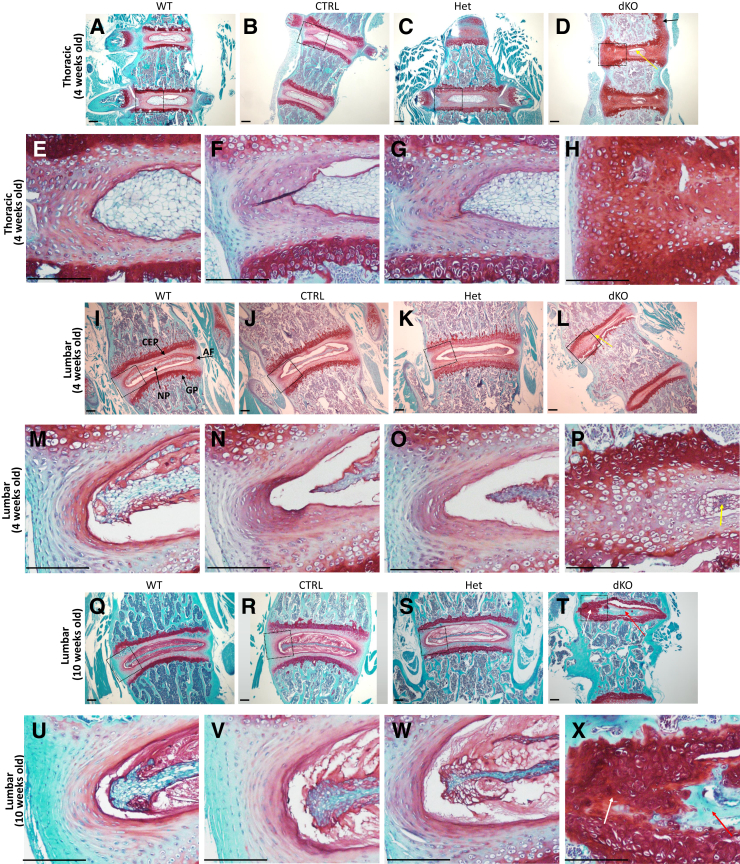
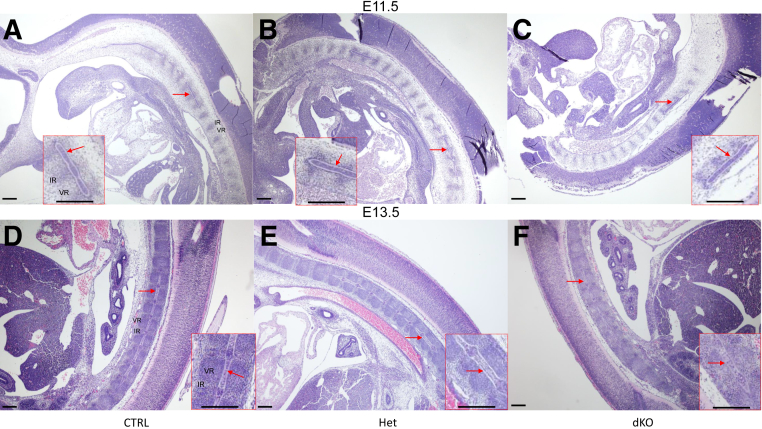
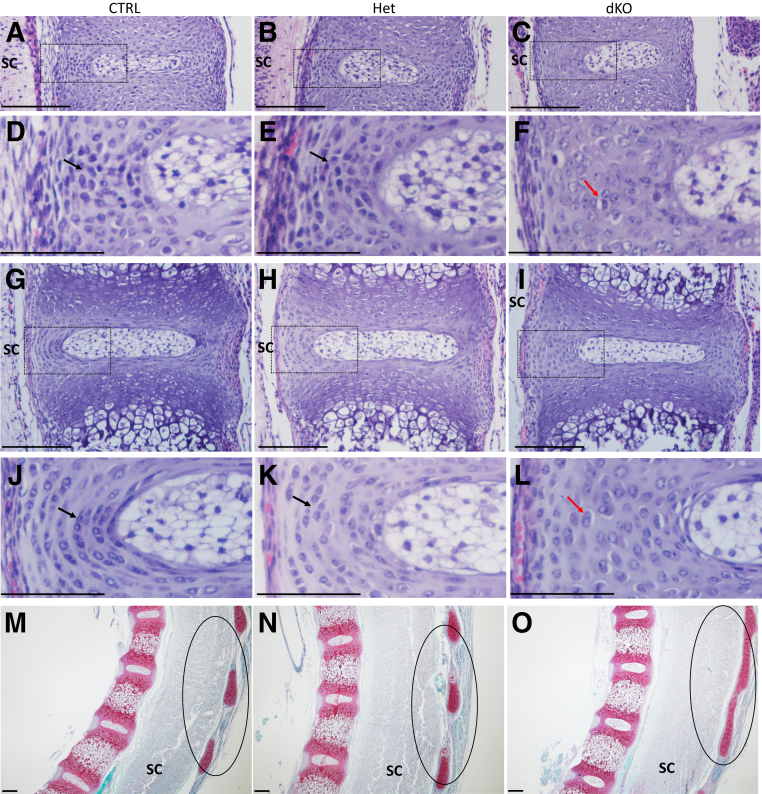
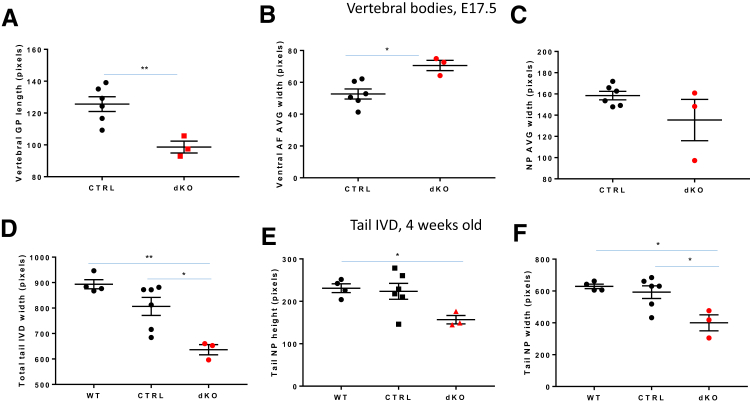
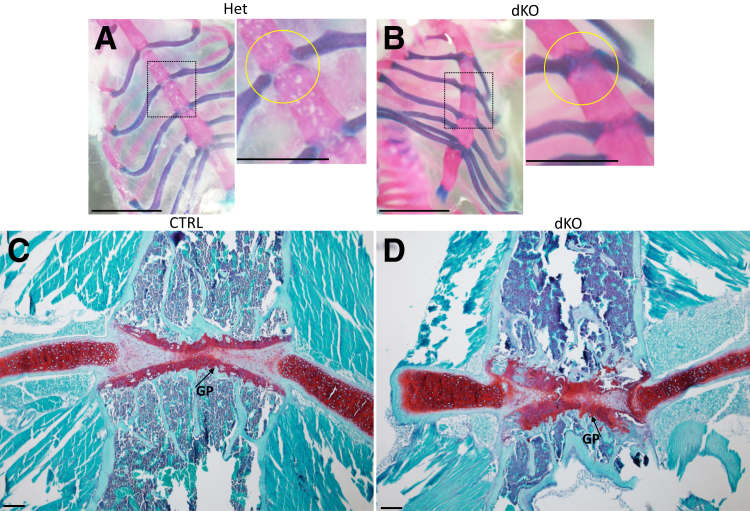
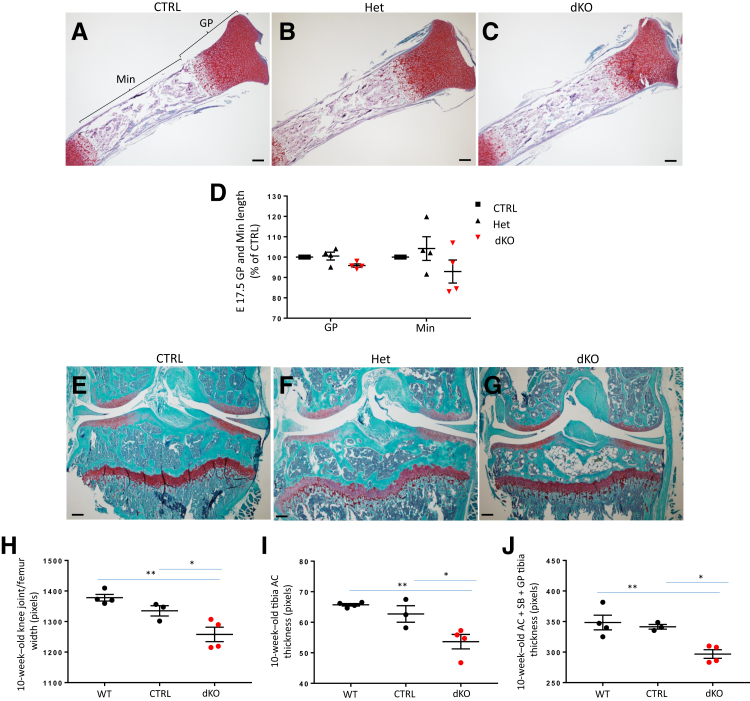
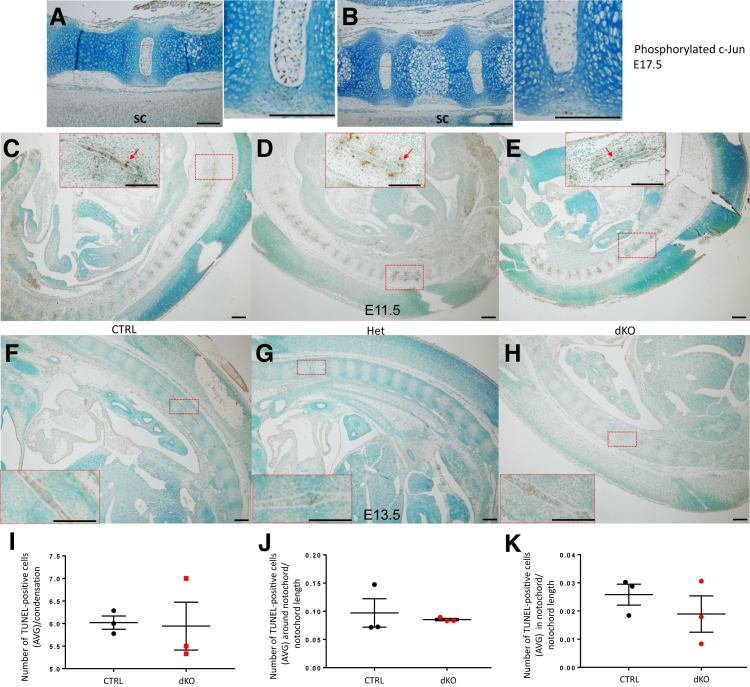
Mitogen-activated protein kinases, including c-Jun NH2-terminal kinase (JNK), play an important role in the development and function of a large variety of tissues. The skeletal phenotype of JNK1 and JNK2 double-knockout (dKO) mice (JNK1fl/flCol2-Cre/JNK2-/-) and control genotypes were analyzed at different embryonic and postnatal stages. JNK1/2 dKO mice displayed a severe scoliotic phenotype beginning during development that was grossly apparent around weaning age. Alcian blue staining at embryonic day 17.5 showed abnormal fusion of the posterior spinal elements. In adult mice, fusion of vertebral bodies and of spinous and transverse processes was noted by micro-computed tomography, Alcian blue/Alizarin red staining, and histology. The long bones developed normally, and histologic sections of growth plate and articular cartilage revealed no significant abnormalities. Histologic sections of the vertebral column at embryonic days 15.5 and 17.5 revealed an abnormal organization of the annulus fibrosus in the dKOs, with chondrocyte-like cells and fusion of dorsal processes. Spinal sections in 10-week-old dKO mice showed replacement of intervertebral disk structures (annulus fibrosus and nucleus pulposus) by cartilage and bone tissues, with cells staining for markers of hypertrophic chondrocytes, including collagen X and runt-related transcription factor 2. These findings demonstrate a requirement for both JNK1 and JNK2 in the normal development of the axial skeleton. Loss of JNK signaling results in abnormal endochondral bone formation and subsequent severe scoliosis.


Figures

Figure 1
Figure 1
Col2-Cre recombinase expression in mouse embryos at embryonic day 17.5. The cells expressing Cre were identified by crossing Col2-Cre mice with ZsGreen reporter mice and performing immunohistochemistry with an antibody to detect ZsGreen. A, B, D, E, G, H, J, and K: Positive cells (brown) were observed in developing long bones (elbow; A, D, G, and J) and vertebral column (B, E, H, and K) that included nucleus pulposus (NP), inner annulus fibrosus (AF), cartilage endplate (CEP), and vertebral body (VB). C, F, I, and L: Positive cells were also seen in the sternum and ribs. The elbow and vertebral column are shown in sagittal orientation, whereas the sternum is presented in the coronal plane. Black boxed areas in A–C are shown in higher-magnification in D–F, respectively. Red boxed areas in D–F are shown in higher-magnification in G–I, respectively, and purple boxed areas in D–F are shown in higher-magnification in J–L, respectively. n = 1. Scale bar = 20 μm (A–L).
Figure 2
Figure 2
Evaluation of the scoliotic phenotype in JNK1/2 dKO and control mice. A–D: Micro–computed tomography (microCT) analysis of whole skeleton in 4-week–old (A and C) and 10-week–old (B and D) JNK1/2 dKO mice, compared with control mice (CTRL; B and D) and heterozygous mice (Het; A and C); C and D show high-resolution microCT (18 μm) of caudal lumbar region. Red arrows point to fusions in transverse processes, and yellow arrows point to fusions of spinous processes; red asterisk marks vertebral fusions at the level of the intervertebral disk. E–H: Alcian blue/Alizarin red staining of 10-week–old whole skeletons (E) and lumbosacral (F), thoracic (G), and cervical (H) regions. Red arrows show vertebral fusions in the dKO, whereas black arrows show similar locations in controls; yellow arrow shows cartilaginous fusion in the thoracic vertebrae. I: Dot plots for comparisons of body weights between 10-week–old wild-type (WT), CTRL, Het, and dKO. J: MicroCT analysis of lumbar scoliosis severity (Cobb angle) in 6-week–old CTRL/Het and dKO mice; dot plots for comparisons between genotypes and sexes. Data are expressed as means ± SEM (I and J). n = 4 (I, WT, and J, female/CTRL); n = 3 (I, CTRL, and J, male/CTRL and male/dKO); n = 5 (I, Het); n = 7 (I, dKO, and J, female/dKO). P ≤ 0.05, ∗∗∗P < 0.001, and ∗∗∗∗P < 0.0001. Scale bars: 5 mm (A, B, and E–H); 1 mm (C and D).
Figure 3
Figure 3
JNK1 and JNK2 protein expression in the vertebral column. JNK1/2 immunoblotting in femoral head cartilage (FC), muscle, and intervertebral disk (IVD) tissues from 6-week–old wild-type (WT), control (CTRL), and JNK1/2 dKO mice. A: Total protein stain was used as a loading control. B–G: JNK1/2 immunohistochemistry in vertebral column sections from embryonic day 17.5 WT (B and E), CTRL (C and F), and JNK1/2 dKO (D and G) mice. Boxed areas in B–D are shown in higher-magnification in E–G, respectively. n = 3 (BG). Scale bar = 20 μm (B–G). AF, inner annulus fibrosus; NP, nucleus pulposus; VB, vertebral body.
Figure 4
Figure 4
Analysis of the rib cage, sternum, and spine in JNK1/2 dKO and control (CTRL) mice. Micro–computed tomographic analysis of rib cage and vertebral column of 11-day–old dKO and CTRL mice. A: Red arrows point to fusions of the vertebrae at the level of the transverse processes and laminae, and yellow arrow points to fusion of spinous processes. B and C: Red asterisk points to fusions at the level of the intervertebral disk. D–F: Alcian blue (D and E), and Alcian blue/Alizarin red (F), staining of whole embryos at embryonic day 17.5. Red arrows point to fusions of the vertebrae dorsally (E), and black arrows point to mineralization centers at the level of spinous processes (F). n = 1 (A–C); n = 3 (D–F). Scale bars: 1 mm (A–C); 5 mm (D–F).
Figure 5
Figure 5
Analysis of the intervertebral disks in the JNK1/2 dKO and control (CTRL) mice. A–X: Safranin O/fast green stain showing 4-week–old (AP) and 10-week–old (QX) thoracic (A–H) and lumbar spine (I–X) intervertebral disks (IVDs), vertebral growth plate (GP), and cartilage endplate (CEP) from wild-type (WT), CTRL, heterozygous (Het), and dKO mice in coronal orientation. D: Thoracic IVDs of 4-week–old dKO mice show strong proteoglycan (PG) stain surrounding a reduced area of nucleus pulposus (NP; yellow arrow) and absence of annulus fibrosus (AF) lamellar structure; in some thoracic segments, a PG-rich cartilaginous tissue connected the cranial and caudal vertebral growth plates (black arrow). L and P: In the lumbar IVDs of 4-week–old dKO mice, the NP was either small (yellow arrows) or absent (not shown here), and both AF and NP were replaced by cartilaginous tissue. Q–X: In 10-week–old dKO, most of AF and NP in distal thoracic (not shown here) and lumbar segments were replaced by areas of cartilage (white arrows; T and X) and bone (red arrows; T and X). Boxed areas in A–D are shown in higher-magnification in E–H, respectively; boxed areas in I–L are shown in higher-magnification in M–P, respectively; and boxed areas in Q–T are shown in higher-magnification in U–X, respectively. n ≥ 3. Scale bar = 20 μm.
Figure 6
Figure 6
Analysis of collagen fiber orientation in JNK1/2 dKO and control (CTRL) mice. Picrosirius red stain (visualized under polarizing light) was used to visualize collagen in lumbar spine intervertebral disks of 4-week–old wild-type (WT), CTRL, heterozygous (Het), and dKO mice. A–H: Images show lack of organization of the collagen fibers in the annulus fibrosus (AF) laminae of dKO mice (D and H), whereas all of the other genotypes showed concentrically aligned fibers in AF laminae (A–C and E–G). Areas in yellow circles in A–D are shown in higher-magnification in E–H, respectively. n = 3. Scale bar = 20 μm.
Figure 7
Figure 7
Evaluation of endochondral bone formation in JNK1/2 dKO and control (CTRL) mice. A: Nucleus pulposus (NP) and annulus fibrosus (AF) are identified with the yellow arrows. A and F: Safranin O stain (A and F) shows replacement of intervertebral disk tissues by bone (red arrow; F) and cartilage (black arrow; F) in 10-week–old dKO mice. B–E and G–J: Immunohistochemistry for type X collagen (B and G), as a marker of hypertrophic chondrocytes, for the cell cycle inhibitor p57 (also expressed by hypertrophic chondrocytes; C and H), for runt-related transcription factor (Runx) 2 (for hypertrophic chondrocytes and osteoblasts; D and I), and for proliferating cell nuclear antigen (PCNA), as a marker of cell proliferation (E and J). Boxed areas in A–J are shown below at higher magnification. n = 3 (dKO and CTRL/heterozygous). Scale bar = 20 μm.
Figure 8
Figure 8
Analysis of notochord development in JNK1/2 dKO and control (CTRL) mice. A–F: Hematoxylin and eosin–stained sections of mouse embryos at embryonic day (E) 11.5 (A–C) and E13.5 (D–F) showing the presence of the notochord (red arrows) in all genotypes. The images represent sagittal sections through the whole embryo. Insets in A–F show higher magnification of areas marked with the red arrow. n = 3 (A–C, E11.5 dKO, and D–F, E13.5 dKO); n = 4 (A–C, E11.5 CTRL/Het); n = 7 (D–F, E13.5 CTRL/Het). Scale bar = 20 μm. Het, heterozygous; IR, intervertebral region; VR, vertebral region.
Figure 9
Figure 9
Analysis of cell organization and collagen fiber orientation in JNK1/2 dKO and control (CTRL) mice. A–L: Hematoxylin and eosin staining of embryonic day (E) 15.5 (A–F) and E17.5 (G–L) intervertebral disk showing larger, unorganized cells in the inner annulus fibrosus of dKO mice (C, F, I, and L) (red arrows; F and L) compared with CTRL (A, D, G, and J) and heterozygous (Het) littermates (B, E, H, and K) (black arrows; D, E, J, and K). Boxed areas in A–C are shown in higher-magnification in D–F, respectively, and boxed areas in G–I are shown in higher-magnification in J–L, respectively. M–O: Safranin O/fast green stain of E17.5 vertebral column (M–O) showing fusion of posterior spinal elements (black circles) in the dKO (O). The images represent sagittal sections through the vertebral column. n = 5 E15.5 dKO (C and F); n = 6 E15.5 CTRL/Het (A, B, D, and E); n = 4 E17.5 dKO (I, L, O); n = 8 E17.5 CTRL/Het (G, H, J, K, M, and N). Scale bars: 20 μm (A–C, G–I, and M–O); 10 μm (D–F and J–L). SC, spinal cord.
Figure 10
Figure 10
Analysis of intervertebral disk (IVD) size in embryonic day (E) 17.5 embryo thoracic spine and 4-week–old tail in JNK1/2 dKO and control (CTRL) mice. Dot plots for comparisons of IVD components between E17.5 CTRL and dKO mice. IVD measurements were taken at the level of two thoracic IVD: T10 to T11 and T11 to T12 in E17.5 dKO and CTRL mice. A–C: An average (AVG) of the two segments was reported for vertebral growth plate (GP) length (A), ventral annulus fibrosus (AF) width (B), and nucleus pulposus (NP) width (C). D–F: Dot plots for comparisons of proximal tail IVD measurements between 4-week–old wild-type (WT), CTRL, and dKO mice, showing IVD width (D), NP height (E), and NP width (F). Data are expressed as means ± SEM (A–F). n = 6 (A–F, CTRL); n = 3 (A–F, dKO); n = 4 (D–F, WT). P ≤ 0.05, ∗∗P < 0.01.
Figure 11
Figure 11
Evaluation of sternum in 10-week–old JNK1/2 dKO and control (CTRL) mice. A and B: Alcian blue/Alizarin red staining showing the presence of a cartilaginous tissue (blue stain, yellow circles) between sternebrae in the JNK1/2 dKO mice. Boxed areas in left panels of A and B are shown in higher-magnification in right panels. B–D: Safranin O/fast green staining showing a tissue rich in proteoglycans between sternebrae (C and D) and the expansion of this cartilaginous tissue in the dKO (B). n = 4 (A and C, CTRL/Het); n = 5 (B and D, dKO). Scale bars: 5 mm (A and B, left panels); 2.5 mm (A and B, right panels); 20 μm (C and D). GP, growth plate; Het, heterozygous.
Figure 12
Figure 12
Analysis of embryonic tibia and 10-week–old knee joints in JNK1/2 dKO and control (CTRL) mice. A–C: Safranin O/fast green staining showing embryonic day (E) 17.5 tibia growth plate (GP) and mineralized regions (Min). D: Dot plots for comparisons of tibia GP and Min regions between E17.5 CTRL, heterozygous (Het), and dKO. E–G: Safranin O/fast green staining showing 10-week–old knee joint sections. H–J: Dot plots for comparisons of knee joint width (H), articular cartilage (AC) thickness (I), and tibial plateau [AC + GP + subchondral bone (SB)] thickness (J) between 10-week–old wild-type (WT), CTRL, and dKO. Data are expressed as means ± SEM (D and H–J). n = 4 (D, E17.5 CTRL, Het, and dKO; H–J, WT and dKO); n = 3 (H–J, CTRL). P ≤ 0.05, ∗∗P < 0.01. Scale bar = 20 μm (A–C and E–G).
Figure 13
Figure 13
Phosphorylated c-Jun immunohistochemical staining of embryonic day (E) 17.5 JNK1/2 dKO and control (CTRL) intervertebral disks (IVDs) and evaluation of apoptosis in vertebral column sections from E11.5 and E13.5 JNK1/2 dKO and control mice. A and B: Immunohistochemistry for phosphorylated c-Jun in lumbar IVDs from E17.5 JNK1/2 dKO and CTRL embryos. There is positive stain in the spinal cord (SC) and other tissues adjacent to the vertebral column in both genotypes. The images represent sagittal sections through the vertebral column. The positive immunostain is brown, and the slides were counterstained with methyl green. Red boxed areas in left panels of A and B are shown in higher-magnification in right panels. C–E: Terminal deoxynucleotidyl transferase-mediated dUTP nick-end labeling (TUNEL)–positive cells (brown; red arrows) can be noticed around notochord regions (in the perinotochordal sclerotome) and at the level of high cell density (condensations) in the vertebral column at E11.5 in all genotypes: CTRL, heterozygous (Het), and dKO. F–H: At E13.5, the positive cells were localized mostly within the notochord. Boxed areas in C–H are shown in higher-magnification images in the insets. I–K: Dot plots for comparisons of number of TUNEL-positive cells per condensation (I), in the perinotochordal sclerotome (J), and within the notochord (K) between E11.5 control (CTRL and Het were pooled for analysis) and dKO. Data are expressed as means ± SEM (I–K). n = 3 (A, B, and I–K, dKO and CTRL/Het, and F–H, dKO and CTRL). Scale bar = 20 μm (A–H). AVG, average.

References

    1. Beier F., Loeser R.F. Biology and pathology of Rho GTPase, PI-3 kinase-Akt, and MAP kinase signaling pathways in chondrocytes. J Cell Biochem. 2010;110:573–580. - PMC - PubMed
    1. Bobick B.E., Kulyk W.M. Regulation of cartilage formation and maturation by mitogen-activated protein kinase signaling. Birth Defects Res C Embryo Today. 2008;84:131–154. - PubMed
    1. Clancy R., Rediske J., Koehne C., Stoyanovsky D., Amin A., Attur M., Iyama K., Abramson S.B. Activation of stress-activated protein kinase in osteoarthritic cartilage: evidence for nitric oxide dependence. Osteoarthritis Cartilage. 2001;9:294–299. - PubMed
    1. Loeser R.F., Erickson E.A., Long D.L. Mitogen-activated protein kinases as therapeutic targets in osteoarthritis. Curr Opin Rheumatol. 2008;20:581–586. - PMC - PubMed
    1. Wood S.T., Long D.L., Reisz J.A., Yammani R.R., Burke E.A., Klomsiri C., Poole L.B., Furdui C.M., Loeser R.F. Cysteine-mediated redox regulation of cell signaling in chondrocytes stimulated with fibronectin fragments. Arthritis Rheumatol. 2016;68:117–126. - PMC - PubMed

Publication types

MeSH terms

Substances