

BPG: Seamless, automated and interactive visualization of scientific data
- PMID: 30665349
- PMCID: PMC6341661
- DOI: 10.1186/s12859-019-2610-2
BPG: Seamless, automated and interactive visualization of scientific data
Abstract
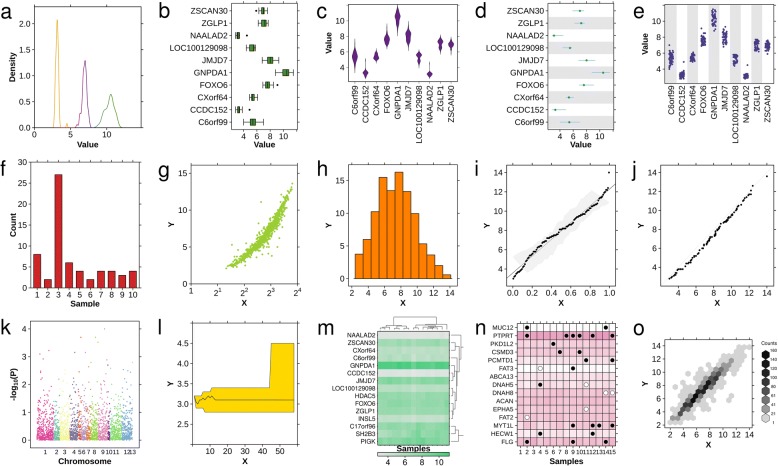
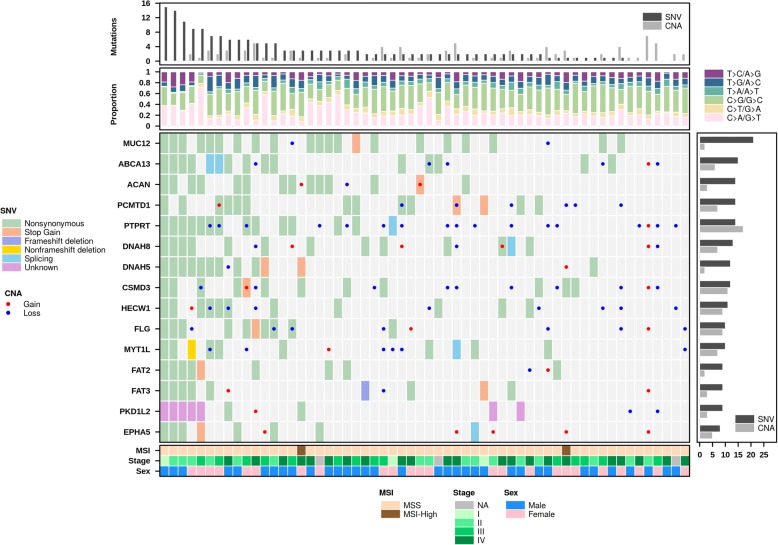
Background: We introduce BPG, a framework for generating publication-quality, highly-customizable plots in the R statistical environment.
Results: This open-source package includes multiple methods of displaying high-dimensional datasets and facilitates generation of complex multi-panel figures, making it suitable for complex datasets. A web-based interactive tool allows online figure customization, from which R code can be downloaded for integration with computational pipelines.
Conclusion: BPG provides a new approach for linking interactive and scripted data visualization and is available at http://labs.oicr.on.ca/boutros-lab/software/bpg or via CRAN at https://cran.r-project.org/web/packages/BoutrosLab.plotting.general.
Keywords: Data-visualization; Interactive plotting; Software; Web-resources.
Conflict of interest statement
Ethics approval and consent to participate
Not Applicable.
Consent for publication
Not applicable.
Competing interests
The authors declare that they have no competing interests.
Publisher’s Note
Springer Nature remains neutral with regard to jurisdictional claims in published maps and institutional affiliations.
Figures
Similar articles
-
VennDiagramWeb: a web application for the generation of highly customizable Venn and Euler diagrams.BMC Bioinformatics. 2016 Oct 3;17(1):401. doi: 10.1186/s12859-016-1281-5. BMC Bioinformatics. 2016. PMID: 27716034 Free PMC article.
-
WIlsON: Web-based Interactive Omics VisualizatioN.Bioinformatics. 2019 Mar 15;35(6):1055-1057. doi: 10.1093/bioinformatics/bty711. Bioinformatics. 2019. PMID: 30535135 Free PMC article.
-
Plotgardener: cultivating precise multi-panel figures in R.Bioinformatics. 2022 Mar 28;38(7):2042-2045. doi: 10.1093/bioinformatics/btac057. Bioinformatics. 2022. PMID: 35134826 Free PMC article.
-
circlize Implements and enhances circular visualization in R.Bioinformatics. 2014 Oct;30(19):2811-2. doi: 10.1093/bioinformatics/btu393. Epub 2014 Jun 14. Bioinformatics. 2014. PMID: 24930139
-
GOplot: an R package for visually combining expression data with functional analysis.Bioinformatics. 2015 Sep 1;31(17):2912-4. doi: 10.1093/bioinformatics/btv300. Epub 2015 May 11. Bioinformatics. 2015. PMID: 25964631
Cited by
-
The proteomic landscape of glioblastoma recurrence reveals novel and targetable immunoregulatory drivers.Acta Neuropathol. 2022 Dec;144(6):1127-1142. doi: 10.1007/s00401-022-02506-4. Epub 2022 Sep 30. Acta Neuropathol. 2022. PMID: 36178522 Free PMC article.
-
Drug screening at single-organoid resolution via bioprinting and interferometry.Nat Commun. 2023 Jun 6;14(1):3168. doi: 10.1038/s41467-023-38832-8. Nat Commun. 2023. PMID: 37280220 Free PMC article.
-
A platform for rapid patient-derived cutaneous neurofibroma organoid establishment and screening.Cell Rep Methods. 2024 May 20;4(5):100772. doi: 10.1016/j.crmeth.2024.100772. Epub 2024 May 13. Cell Rep Methods. 2024. PMID: 38744290 Free PMC article.
-
The Proteogenomics of Prostate Cancer Radioresistance.Cancer Res Commun. 2024 Sep 1;4(9):2463-2479. doi: 10.1158/2767-9764.CRC-24-0292. Cancer Res Commun. 2024. PMID: 39166898 Free PMC article.
-
Deletions Rate-Limit Breast and Ovarian Cancer Initiation.bioRxiv [Preprint]. 2024 Oct 21:2024.10.17.618945. doi: 10.1101/2024.10.17.618945. bioRxiv. 2024. PMID: 39484366 Free PMC article. Preprint.
References
-
- Grinstein G, Trutschl M, Cvek U. Proceedings of the visual data mining workshop. KDD. 2001:7–19.
-
- Anscombe FJ. Graphs in Statistical Analysis. Am Stat. 1973;27:17–21.
-
- Shoresh N, Wong B. Data exploration. Nat Methods. 2012;9:5. - PubMed
-
- O'Donoghue SI, et al. Visualizing biological data-now and in the future. Nat Methods. 2010;7:S2–4. - PubMed
MeSH terms
Grants and funding
LinkOut - more resources
Full Text Sources
Miscellaneous
