

Splicing factor ESRP1 controls ER-positive breast cancer by altering metabolic pathways
- PMID: 30665944
- PMCID: PMC6362360
- DOI: 10.15252/embr.201846078
Splicing factor ESRP1 controls ER-positive breast cancer by altering metabolic pathways
Abstract
The epithelial splicing regulatory proteins 1 and 2 (ESRP1 and ESRP2) control the epithelial-to-mesenchymal transition (EMT) splicing program in cancer. However, their role in breast cancer recurrence is unclear. In this study, we report that high levels of ESRP1, but not ESRP2, are associated with poor prognosis in estrogen receptor positive (ER+) breast tumors. Knockdown of ESRP1 in endocrine-resistant breast cancer models decreases growth significantly and alters the EMT splicing signature, which we confirm using TCGA SpliceSeq data of ER+ BRCA tumors. However, these changes are not accompanied by the development of a mesenchymal phenotype or a change in key EMT-transcription factors. In tamoxifen-resistant cells, knockdown of ESRP1 affects lipid metabolism and oxidoreductase processes, resulting in the decreased expression of fatty acid synthase (FASN), stearoyl-CoA desaturase 1 (SCD1), and phosphoglycerate dehydrogenase (PHGDH) at both the mRNA and protein levels. Furthermore, ESRP1 knockdown increases the basal respiration and spare respiration capacity. This study reports a novel role for ESRP1 that could form the basis for the prevention of tamoxifen resistance in ER+ breast cancer.
Keywords: ESRP1; HTA; ER‐positive breast cancer; alternative splicing; fatty acid metabolism.
© 2019 The Authors.
Figures
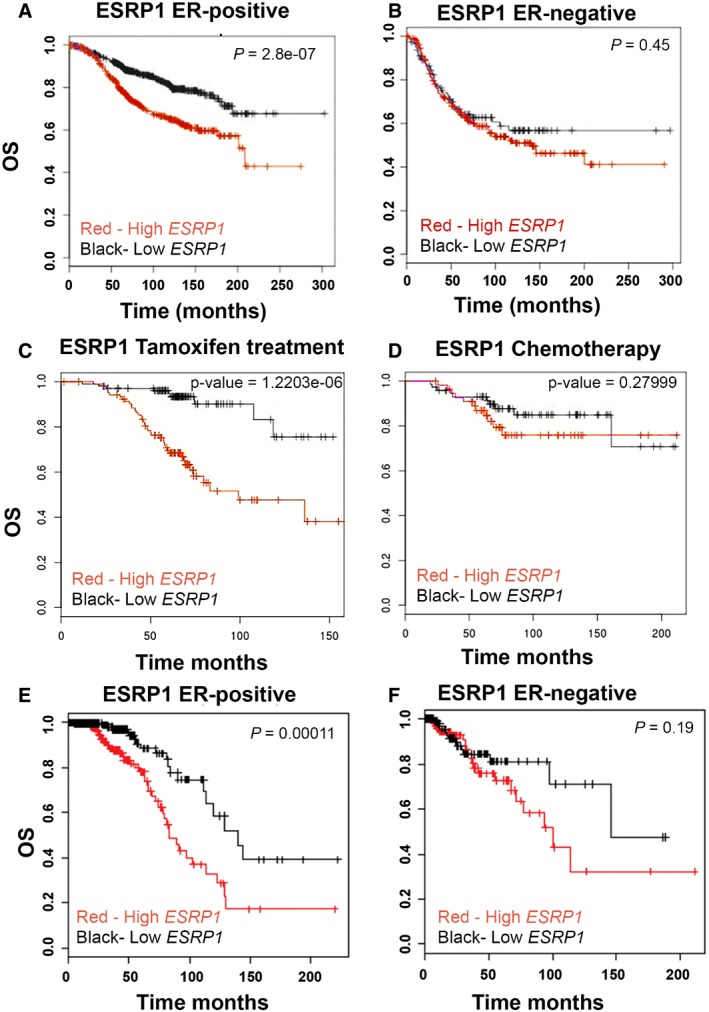
BreastMark microarray platform; Kaplan–Meier curves of overall survival (OS), demonstrating that high expression of ESRP1 (red line) is associated with poor prognosis in ER+ breast cancer. A log rank test was used to calculate P = 2.8 e‐07 (n = 934, number of events = 216).
BreastMark microarray platform; Kaplan–Meier curves of overall survival (OS) of ER− breast cancer. A log rank test was used to calculate P = 0.4481 (n = 322, number of events = 130).
BreastMark microarray platform; correlation of ESRP1 expression with overall survival in tamoxifen‐treated patients. A log rank test was used to calculate P = 1.218, e‐06 (n = 210, number of events = 49).
BreastMark microarray platform; correlation of ESRP1 expression with overall survival in chemotherapy‐treated patients. A log rank test was used to calculate the P = 0.28 (n = 129, number of events = 21)
The Cancer Genome Atlas Breast Invasive Carcinoma (TCGA‐BRCA) RNA‐Seq dataset; Kaplan–Meier curves of overall survival (OS) in ER+ breast cancer, demonstrating that high expression of ESRP1 (red line) is associated with poor prognosis in ER+ breast cancer. A log rank test was used to calculate P = 0.00011 (n = 656, number of events = 62).
The Cancer Genome Atlas Breast Invasive Carcinoma (TCGA‐BRCA) RNA‐Seq dataset; Kaplan–Meier curves of overall survival (OS) in ER− breast cancer. Red‐high ESRP1 expression; Black‐low ESRP1 expression. A log rank test was used to calculate P = 0.19 (n = 100, number of events = 17).
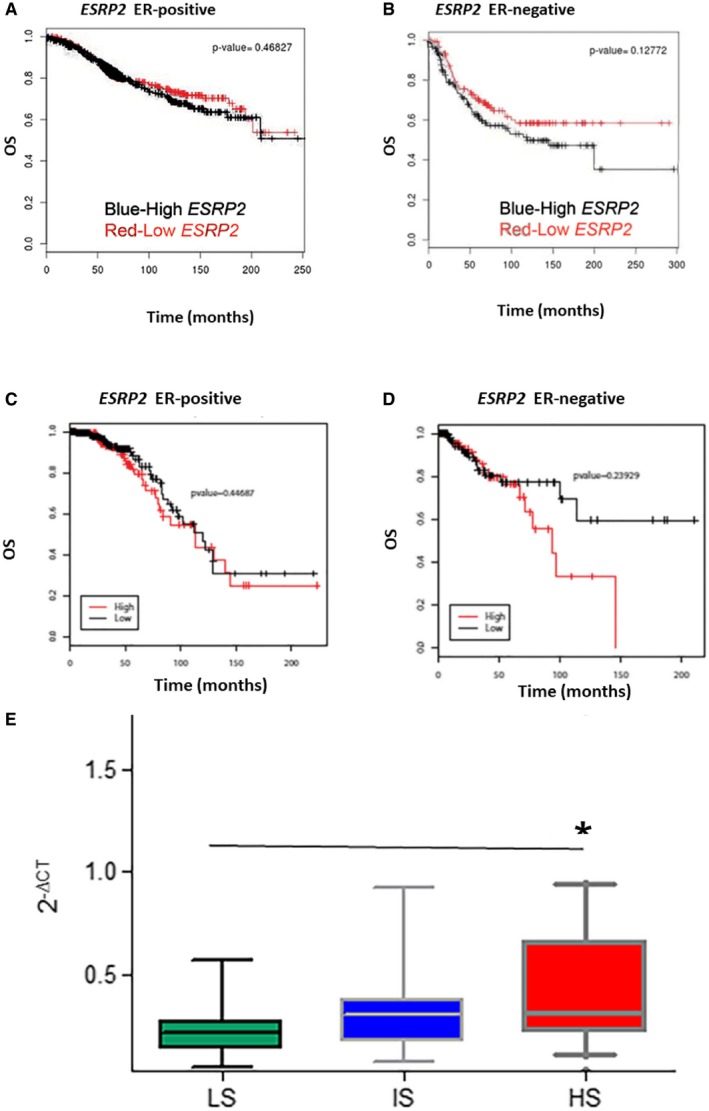
BreastMark microarray platform; Kaplan–Meier curves of overall survival (OS) in ER‐positive (ER+) breast cancer. A log rank test was used to calculate the P = 0.47 (n = 708, number of events = 171) and P = 0.13 (n = 253, number of events = 96)].
BreastMark microarray platform; Kaplan–Meier curves of overall survival (OS) in ER‐negative (ER−) breast cancer. A log rank test was used to calculate the P = 0.13 (n = 253, number of events = 96).
TCGA Breast Invasive Carcinoma (BRCA) RNA‐Seq dataset; Kaplan–Meier curves of overall survival (OS) in ER+ breast cancer. A log rank test was used to calculate the P = 0.45 (n = 210, number of events = 49).
TCGA Breast Invasive Carcinoma (BRCA) RNA‐Seq dataset; Kaplan–Meier curves of overall survival (OS) in ER− breast cancer. Red, high ESRP1 expression; black, low ESRP1 expression. A log rank test was used to calculate the P = 0.24 (n = 129, number of events = 21).
ESRP1 expression in breast cancer with poor prognosis. RT–qPCR assay showing that expression of ESRP1 is higher in patients with high recurrence scores in a Oncotype DX cohort n = 59 (19 LS, 20 IS, and 20 HS); LS, low score; IS, intermediate score; and HS, high score, * represents P < 0.05; data (mean ± SD) were statistically significant and calculated using two‐way ANOVA.
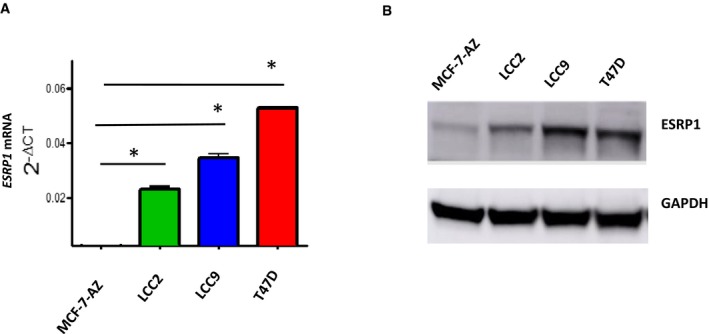
RT–qPCR assay showing ESRP1 expression in endocrine‐resistant (MCF7/LCC2‐tamoxifen resistant, MCF7/LCC9‐fulvestrant and tamoxifen cross‐resistant) and T‐47D cells compared to parental MCF‐7‐AZ therapy‐sensitive cell lines. * represents P < 0.05; statistically significant. All RT–qPCR assays are performed in three independent biological replicates calculated using two‐way ANOVA (data (mean ± SD).
Representative Western blot analysis of the indicated breast cancer cell lines (see details in Materials and Methods). All Western blot assays are performed in three independent biological replicates.
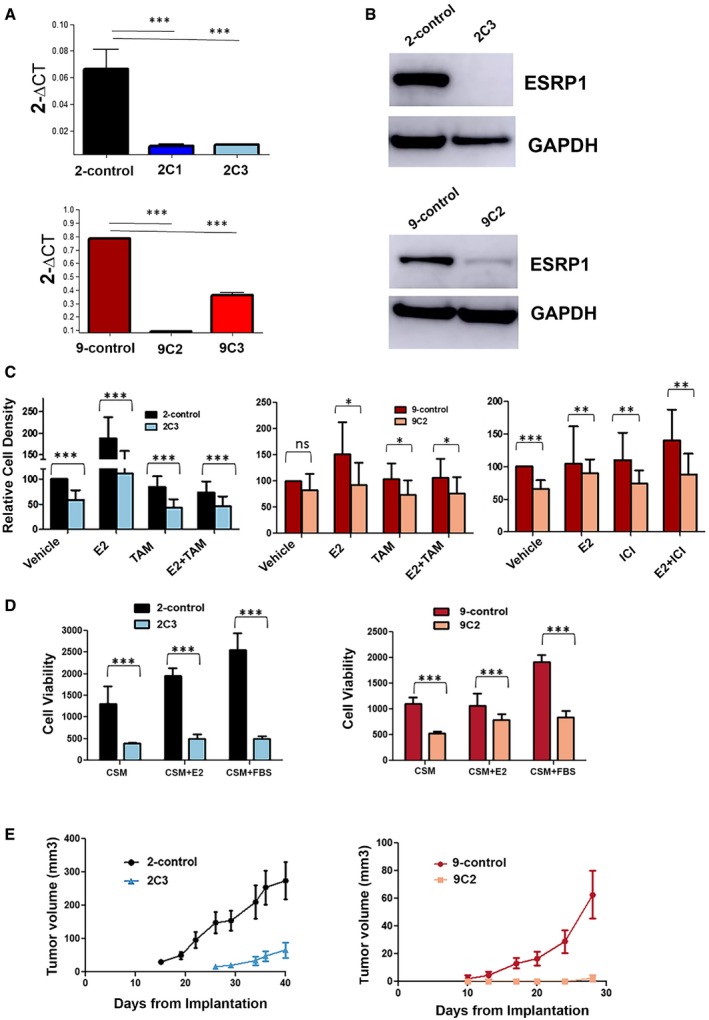
RT–qPCR confirmed the stable knockdown of ESRP1 expression in endocrine‐resistant cells using a shRNA lentiviral system (Mission TRC human shRNA constructs‐Sigma); 2‐control (LCC2 cells transduced with pLKO.1 control vector) and 2C1 and 2C3 (LCC2 cells transduced with pLKO.1 shRNA ESRP1). Clones were selected for expression verification (clone 1 and clone 3); 9‐control (LCC9 cells transduced with pLKO.1 control vector), 9C2 and 9C3 (LCC9 cells transduced with pLKO.1 shRNA ESRP1). Clones were selected for expression verification (clone 2 and clone 3). * represents P < 0.05; statistically significant. Data (mean ± SD) were calculated using two‐way ANOVA based on three independent biological replicates.
Western blot analysis using ESRP1 antibody GTX 131373 (GeneTex). GAPDH is used as the reference control.
Relative cell density was determined by crystal violet assay. Cells were treated with TAM (4‐hydroxytamoxifen; 10−6 M) or ICI (ICI 182,780; 10−9 M) for 6 days in the presence and absence of E2 (β‐estradiol; 10−10 M). Data (mean ± SD) were calculated using two‐way ANOVA based on three independent biological replicates.
Cell viability was determined using Cell Biolabs CytoSelect™ Cell Transformation Assay using 2‐control, 2C3, 9‐control, and 9C2 cells in CSM—charcoal‐stripped media, E2 (β‐estradiol; 10−10 M), and 10% fetal bovine serum. Data (mean ± SD) were calculated using two‐way ANOVA based on three independent biological replicates.
Impact of ESRP1 knockdown on in vivo tumor growth. Five million cells (2‐control, 2C3, 9‐control, and 9C2) were implanted into mammary fat pads of athymic mice (five mice per group) in the presence of supplemental estrogen. Tumors were measured weekly using calipers for external measurements. Tumor volume was calculated as L × W2/2, where L is length and W is width (note the different scale for tumor volumes). Data (mean ± SD) were calculated using two‐way ANOVA (n = 5 mice per group).
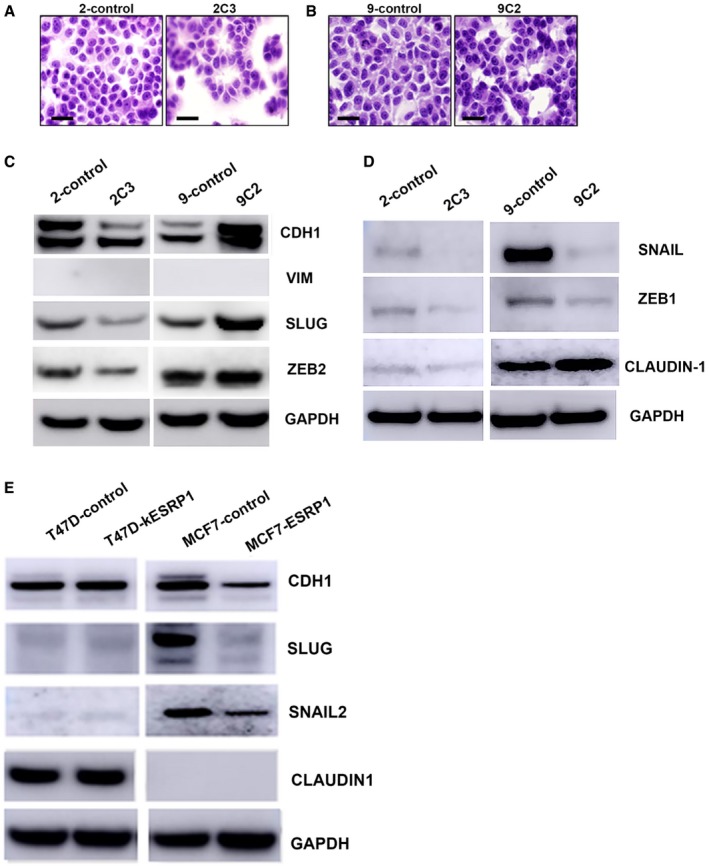
- A
Cell morphology using high‐power magnification (40x) of the cultured cell lines under a microscope in LCC2 model‐2‐control and 2C3 cells. Scale bar: 50 μm.
- B
Cell morphology using high‐power magnification (40×) of the cultured cell lines under a microscope in LCC9 model‐9‐control and 9C2 cells. Scale bar: 50 μm.
- C, D
Protein expression of key EMT‐TFs in ESRP1 knockdown cells (2C3 and 9C2) compared to endocrine‐resistant control cell lines (2‐control and 9‐control) using Western blotting analysis.
- E
Protein expression of key EMT‐TFs in ESRP1 knockdown cells (T‐47D‐kESRP1) and ESRP1‐overexpressing MCF‐7 cells (MCF‐7‐ESRP1) compared to their control counterparts (T‐47D‐control and MCF‐7‐control, respectively).
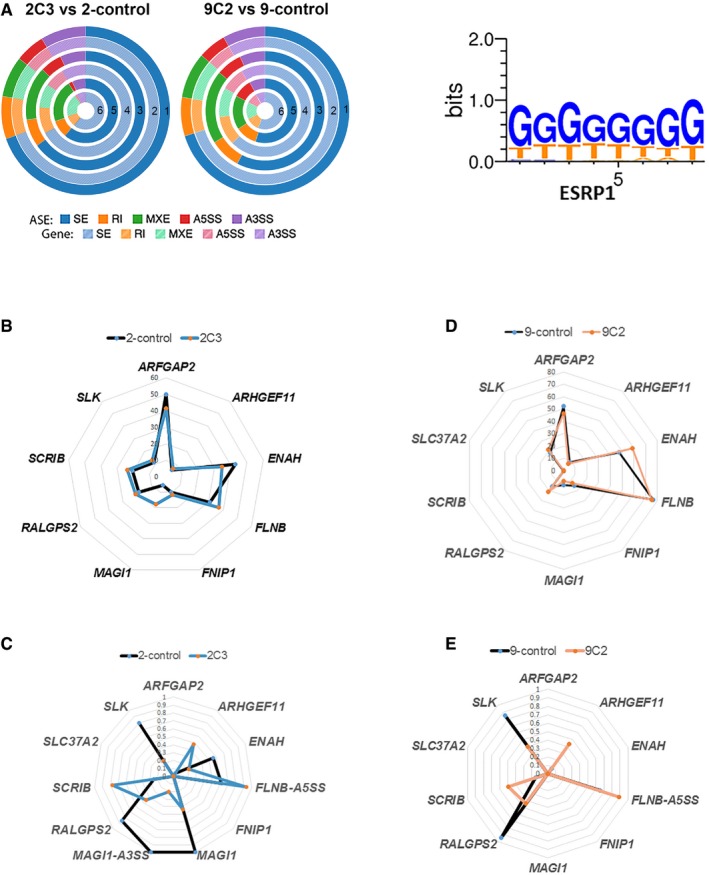
Donut charts for RNA‐Seq analysis showing the differentially regulated alternative splicing events (ASEs) and their corresponding genes in ESRP1 knockdown cells compared to control cells; SE: skipped exon, RI: retained intron, MXE: mutually exclusive exons, A5SS: alternative 5′ splice site, and A3SS: alternative 3′ splice site. The “percent spliced in” (PSI or ψ) value was estimated. Differences in inclusion levels (∆ψ) between samples and their significance were calculated (P < 0.05 and IΔψI > 0.1). Circle 1: all ASEs; Circle 2: all genes corresponding to all ASEs; Circle 3: significant ASEs; Circle 4: significant genes corresponding to significantly altered ASEs; Circle 5: significant ASEs with ESRP1 motifs; Circle 6: significant genes corresponding to significantly altered ASEs with ESRP1 motifs. ESRP binding motifs were obtained from Dittmar et al 31 and analyzed based on the following assumption: The presence of the motif in the downstream region of an exon results in inclusion of the exon, while upstream or intraexonic location leads to exclusion of the exon.
Radar plot showing that the EMT gene signature was not altered at the gene level in the ESRP1 knockdown model (LCC2 set).
Radar plot showing that the EMT gene signature was altered at the ASEs level (SE) in the ESRP1 knockdown model (LCC2 set).
Radar plot showing that the EMT gene signature was not altered at the gene level in the ESRP1 knockdown model (LCC9 set).
Radar plot showing that the EMT gene signature was altered at the ASEs level (SE) in the ESRP1 knockdown model (LCC9 set).
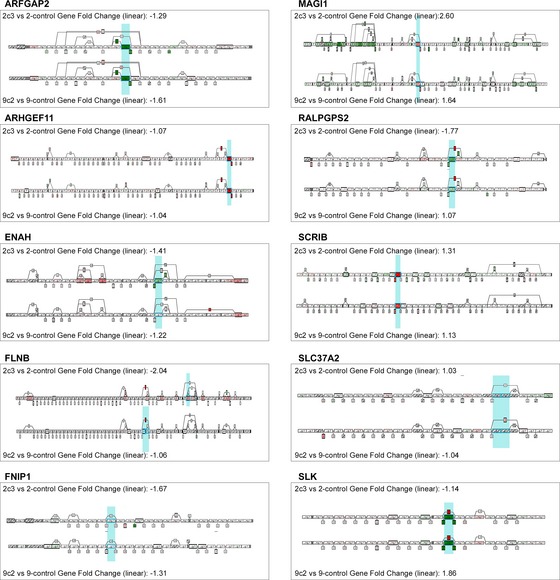
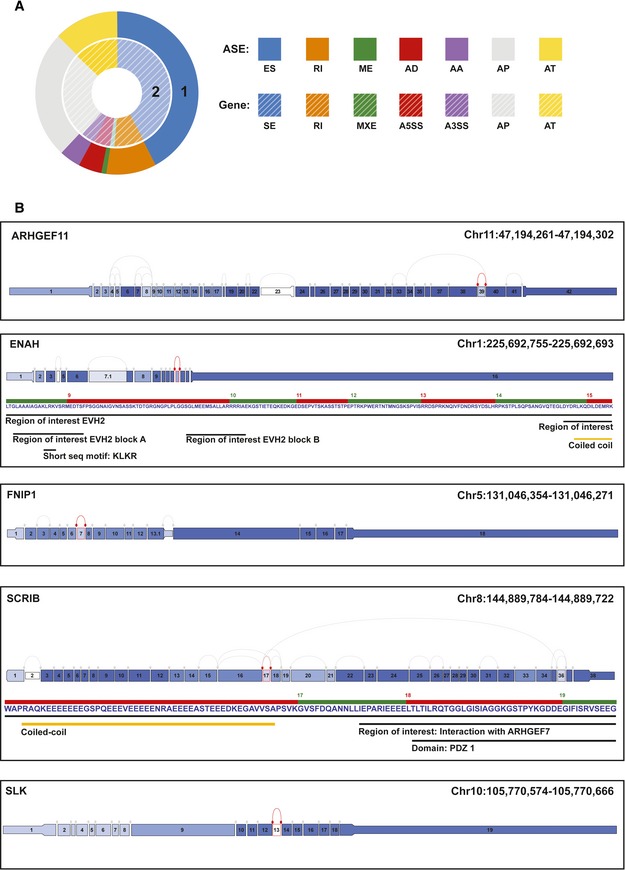
The data were analyzed by categorizing the splice events into seven types: exon skip (ES), alternative 5′ donor (AD), alternative 3′ acceptor (AA), retained intron (RI), mutually exclusive exons (ME), alternative first exon (AP), and alternative last exon (AT). The analysis of splice events was performed using the following filter criteria: Min Gene RPKM ≥ 2, |dPSI| ≥ 0.1, P ≤ 0.02, Min Group Obs % > 0.85; RPKM‐reads per kilobase of transcript per million aligned reads; and |dPSI|‐absolute changes in percent splicing (dPSI, ∆Ψ). The events are presented as differential expression of splice events between ESRP1low and ESRP1high cases.
TCGA splice graphs for the EMT signature genes in ESRP1high versus ESRP1low tumors. A splice graph of the gene's exons is shaded based on the expression level and shows the selected splice event outlined in red.
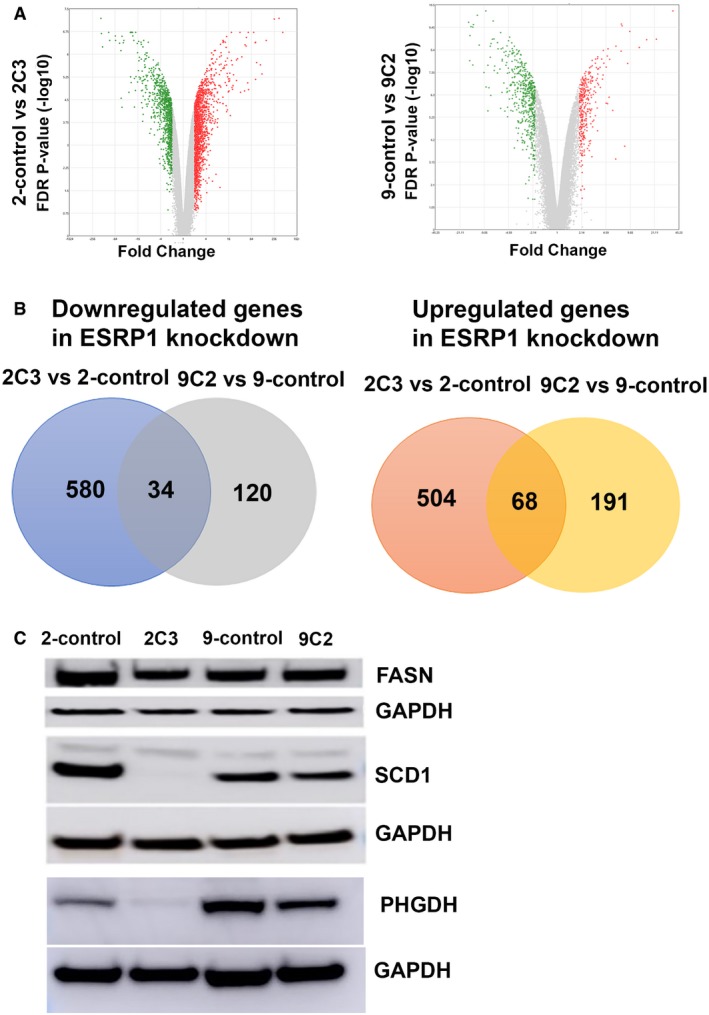
Volcano plots showing the distribution of significant gene expression changes using the HTA 2.0 platform.
Differential gene expression analysis of ESRP1 knockdown compared to resistant control cells using HTA 2.0 platform; downregulated genes in ESRP1 knockdown (left panel) and upregulated genes in ESRP1 knockdown (right panel) common in 2‐control versus 2C3, and 9‐control versus 9C2.
Validation of the protein levels of FASN, SCD1, and PHGDH protein levels in ESRP1 knockdown versus control resistant cell lines using Western blot analysis. GAPDH was used as the loading control. The data are representative of three individual biological replicates.
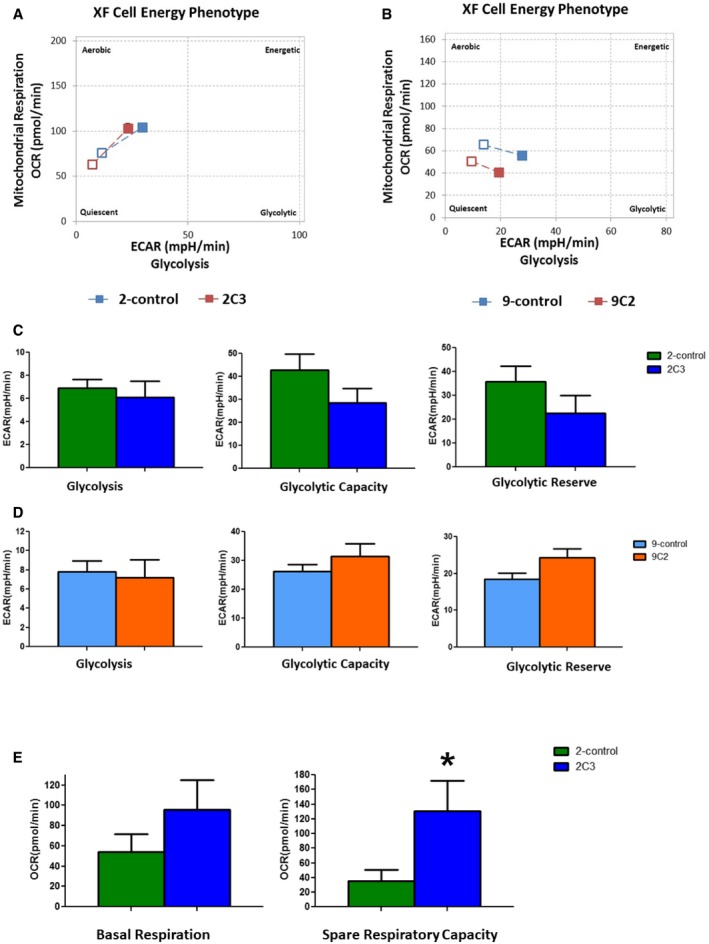
Agilent Seahorse XF Cell Energy Phenotype Profile. The relative utilization of the two energy pathways of control and ESRP1 knockdown cells is determined under both baseline (Baseline Phenotype‐open squares) and stressed (Stressed Phenotype‐full squares) conditions—2‐control (blue squares) versus 2C3 (red squares).
Agilent Seahorse XF Cell Energy Phenotype Profile. The relative utilization of the two energy pathways of control and ESRP1 knockdown cells is determined under both baseline (Baseline Phenotype‐open squares) and stressed (Stressed Phenotype‐full squares) conditions—9‐control (blue squares) versus 9C2 (red squares).
Agilent Seahorse XF Glycolysis Stress representing extracellular acidification rate (ECAR) components‐glycolysis, glycolytic capacity, and glycolytic reserve—2‐control (green columns) and ‐2C3 ESRP1 knockdown (blue columns). Data (mean ± SD) are calculated using two‐way ANOVA based on the three independent biological replicates.
Agilent Seahorse XF Glycolysis Stress representing extracellular acidification rate (ECAR) components—glycolysis, glycolytic capacity, and glycolytic reserve—9‐control (light blue columns) and 9C2 ESRP1 knockdown (orange columns). Data (mean ± SD) are calculated using two‐way ANOVA based on the three independent biological replicates.
Mitochondrial respiration through oxygen consumption rate (OCR) components—basal respiration and spare respiration capacity. The data are representative of three independent sets. * represents P < 0.05; statistically significant. Data (mean ± SD) are calculated using two‐way ANOVA based on the three independent assays.
References
-
- Ali S, Coombes RC (2002) Endocrine‐responsive breast cancer and strategies for combating resistance. Nat Rev Cancer 2: 101–112 - PubMed
Publication types
MeSH terms
Substances
Grants and funding
LinkOut - more resources
Full Text Sources
Medical
Research Materials
Miscellaneous
